
The Relationship between Environmental Factors and Other Factors
with Energy Intake in Students of SMA Muhammadiyah 11
Jakarta in 2022
Irhamna Amalia, Imas Arumsari and Fildzah Badzlina
Department of Nutrition, Faculty of Health Sciences, University of Muhammadiyah Prof. Dr. Hamka, Jakarta, Indonesia
Keywords: Energy Intake, Fast Food, Environmental Factors, Sugar-Sweetened Beverages, Muhammadiyah 11.
Abstract: Energy intake influences the incidence of nutritional problems in adolescents. This is related to the
adolescent lifestyle that always wants to do anything in a short time and always follow the latest trends. The
purpose of this study was to determine the relationship between environmental factors and the contribution
of western fast food and sugar-sweetened beverages (SSBs) intake to RDA with total energy in students of
SMA Muhammadiyah 11 Jakarta. This study has a cross-sectional design. This research was conducted on
159 students of class X and XI SMA Muhammadiyah 11 Jakarta. Environmental factors data were obtained
by filling out questionnaires independently, consumption data of western fast food and sugar-sweetened
beverages (SSBs) were obtained by interviewing a semi-quantitative food frequency questionnaire (SQ-
FFQ), and data on energy intake was obtained by interviewing food recall 2 x 24 hours. A total of 159
students participated in this study. The proportion of students with excessive intake was 18,20%. Based on
data analysis, factors that are related to the total energy in students of SMA Muhammadiyah 11 Jakarta are
the contribution of western fast-food intake and the contribution of sugar-sweetened beverages (SSBs)
intake.
1 INTRODUCTION
Being overweight is one of the nutritional problems
experienced by many adolescents. The highest
prevalence of overweight occurs in America, which
is 30% of American adolescents experiencing
overweight problems, and 22 – 25% of European
adolescents also experience the same problem
(Bibiloni et al., 2013). In 2018 there were 13.5% of
adolescents aged 16-18 years in Indonesia
experienced overweight problems, while in DKI
Jakarta province reached 21.1% of adolescents aged
16 – 18 years experienced overweight problems
(Kemenkes RI, 2018).
The high number of nutritional problems in
adolescents can occur due to an imbalance between
the food intake consumed and their needs.
Adolescents who consume more food intake than
their needs have a 4.69 times greater risk of obesity
compared to adolescents who consume adequate
energy intake (Adiyanti et al., 2015). If the food
intake consumed by a person is to his needs, the
optimal nutritional status will be achieved (Kuswari
et al., 2018).
Food intake comes from all food or drinks
consumed by a person (Palupi, 2014). In
adolescents, a person will be more easily influenced
by the environment and their closest people, and
adolescents will quickly follow the times or trends
that are developing in society, especially in terms of
modern food (Ardiani et al., 2017). At the age of
adolescence, someone can already eat the food he
likes and can also solve their curiosity about food
(Chikamah & Nisa, 2020). Western fast food is one
of the foods favored by almost all teenagers. Fast
food products have high energy content and make a
significant contribution to the recommended daily
energy intake (Mackay et al., 2021). Lucio, et al.
(2020) research also states that the menus available
in fast food restaurants contain energy that exceeds
the recommended daily intake for school children
(Lucio et al., 2020). In addition to food, some drinks
have a fairly high energy contribution to a person's
needs, namely sugar-sweetened beverages (SSBs).
The growing development of the sweet drink
82
Amalia, I., Arumsari, I. and Badzlina, F.
The Relationship between Environmental Factors and Other Factors with Energy Intake in Students of SMA Muhammadiyah 11 Jakarta in 2022.
DOI: 10.5220/0011650000003608
In Proceedings of the 4th International Conference on Social Determinants of Health (ICSDH 2022), pages 82-88
ISBN: 978-989-758-621-7; ISSN: 2975-8297
Copyright
c
2023 by SCITEPRESS – Science and Technology Publications, Lda. Under CC license (CC BY-NC-ND 4.0)

industry today indicates that this drink is accepted
by the community, including adolescents. Based on
research on students in Jordan, sugar-sweetened
beverages (SSBs) contribute up to 481 kcal in one
day, hot drinks are the most frequently consumed by
these students (Bawadi et al., 2019). There is also a
study conducted on adolescents in Bandung, stating
that the average energy intake contributed by
sweetened drinks is 327.29 kcal, or 19.4% of the
total average daily energy intake (Akhriani et al.,
2016).
In addition to the selection of food types that can
affect food intake, the obesogenic environment can
also be an enabling factor that causes a person to
consume excess food. An obesogenic environment is
an environment that can support a person to
experience obesity or being overweight. Being in
that environment can be an easy way to get food and
fulfill one's food intake needs. A study in the UK
States that someone who is in an environment with
access to a lot of food has almost twice the risk of
being obese (Townshend & Lake, 2016). There is
also a study in China that states that the existence of
a wet market in urban areas contributes to a large
enough nutritional intake for children (Wang & Shi,
2012). Currently, there is also a food delivery
service facility, which of course also makes it easier
for everyone to get the food they want without the
need to leave the house. Food delivery services can
be accepted by many people around the world, even
in 2020, the use of food delivery services has
become a trend in China (Li et al., 2020). The covid-
19 pandemic that has occurred throughout the world
has also revived food delivery services. This is
evidenced by a survey conducted by the Katadata
Insight Center that there are 44% of Gen Z have just
started using food delivery services during the
pandemic (Nurcahyani, 2021).
Based on nutritional problem data that occur in
adolescents, the authors are interested to know
whether there is a relationship between the
environmental factors and other factors on the total
energy of students at SMA Muhammadiyah 11
Jakarta.
2 METHOD
2.1 Design
This study used a cross-sectional study design,
which is primary data taken at one time. The
research is located on the SMA Muhammadiyah 11
Jakarta from February to March 2022.
2.2 Subject
The target population in this study were students of
classes X and XI of SMA Muhammadiyah 11
Jakarta for the academic year 2021/2022, totaling
323 students. By calculating the sample requirement
using the Lemeshow formula, the minimum sample
size is 152 students. Sampling was carried out
through stratified random sampling and purposive
sampling. The inclusion criteria in this study were
students of classes X and XI who were active as
students of SMA Muhammadiyah 11 Jakarta in the
academic year 2021/2022, were willing to become
respondents, and users of food delivery services,
while the exclusion criteria in this study were
respondents who did not follow the research data
process until completion.
2.3 Dietary Intake
Dietary intake data was obtained from the result of
food recall 2 x 24 hours. The result was categorized
based on WNPG 2004 into deficit (intake < 80%
RDA), normal (intake 80 – 110% RDA), and more
(intake >110% RDA).
2.4 Environmental Factors
Environmental factors in this study are home
distance with western fast-food restaurants, home
distance with minimarket/supermarket/drink stalls,
and frequency of food delivery service used.
Environmental data were obtained from the
questionnaire. Google maps applications were used
for validating the distance data. The result of
distance data was categorized into near (≤ median)
and far (> median), while the result of frequency of
food delivery service used was categorized into
often (≥ 3 times a week) and rarely (< 3 times a
week) (Harahap, 2019).
2.5 Consumption of Western Fast Food
and Sugar-Sweetened Beverages
(SSBs)
Consumption of western fast food and sugar-
sweetened beverages (SSBs) data was obtained from
the results of the semiquantitative – food frequency
questionnaire (SQ-FFQ). The measurement results
are the average energy contribution from the
consumption of western fast food and sugar-
sweetened beverages (SSBs) to the daily energy
needs based on the Rate of dietary adequacy (RDA).
The Relationship between Environmental Factors and Other Factors with Energy Intake in Students of SMA Muhammadiyah 11 Jakarta in
2022
83

2.6 Data Analysis
Data were analyzed using chi-square (x²) for
independent variables that have measurement results
categorized and use an independent t-test on
independent variables that have numerical
measurement results. Independent t-test analyses
were used because the data were distributed
normally.
3 RESULTS
3.1 Description of Characteristics,
Dietary Intake, Environmental, and
Consumption of Western Fast Food
and Sugar-Sweetened Beverages
(SSBs)
Respondents were 159 students of class X and XI
SMA Muhammadiyah 11 Jakarta in the academic
year 2021/2022. Table 1 shows a description of the
respondents’ characteristics.
Table 1: Respondent Characteristics.
Characteristics n %
Sex
Male 86 54.10
Female 73 45.90
Total 159 100.00
Age (years)
15 44 27.70
16 78 49.10
17 36 22.60
18 1 0.60
Total 159 100.00
Pocket Money (Rp)
10,000 16 10.10
15,000 14 8.80
20,000 24 15.10
25,000 17 10.70
30,000 36 22.60
35,000 10 6.30
40,000 15 9.40
50,000 27 17.00
Total 159 100.00
Dietary intake is divided into three categories,
namely deficit, normal, and excessive to the WNPG
2004. Table 2 shows a description of the
respondent’s dietary intake.
Environmental Factors are divided into two
categories for each variable. For distance, the
variable is divided into near and far, while for
frequency of food delivery service used variable is
often and rarely. Table 3 shows a description of the
respondent environmental factors.
Table 2: Dietary Intake Data of Respondent.
Intake n % Mean ± SD
Energ
y
Deficit 6 3.80 2291.53 ±
381.69
Normal 124 78.00
Excessive 29 18.20
Total 159 100.00
Protein
Deficit 6 3.80 68.17 ± 9.34
Normal 124 78.00
Excessive 29 18.20
Total 159 100.00
Fat
Deficit 5 3.10 73.93 ± 13.38
Normal 122 76.70
Excessive 32 20.10
Total 159 100
Carboh
y
drate
Deficit 6 3.80 338.38 ± 60.78
Normal 123 77.40
Excessive 30 18.90
Total 159 100.00
Table 3: Environmental Factors Data of Respondent.
Environmental Factors n %
Home distance from a western fast-foo
d
restaurant
Fa
r
75 47.20
Nea
r
84 52.80
Total 159 100.00
Home distance with minimarket
/
supermarket
/
drink stall:
Fa
r
60 37.70
Nea
r
99 62.30
Total 159 100.00
Fre
q
uenc
y
of food deliver
y
service use
d
:
Often 110 69.20
Rarel
y
49 30.80
Total 159 100.00
The average energy contribution from consumption
of western fast food is 1.22% of RDA and sugar-
sweetened beverages (SSBs) are 1.51% of RDA.
Table 4 shows a description of the respondents’
western fast food and sugar-sweetened beverages
(SSBs) consumption.
Table 4: Western Fast Food and Sugar-Sweetened
Beverages (SSBs) Consumption of Respondent.
Energy Contribution
Mean
(%RDA)
Min –
Max
95% CI
Western Fast Food
1.22 0
–
3.93 1.07
–
1.37
Sugar-Sweetened
Bevera
g
es
(
SSBs
)
1.51 0 – 5.81 1.34 – 1.69
ICSDH 2022 - The International Conference on Social Determinants of Health
84
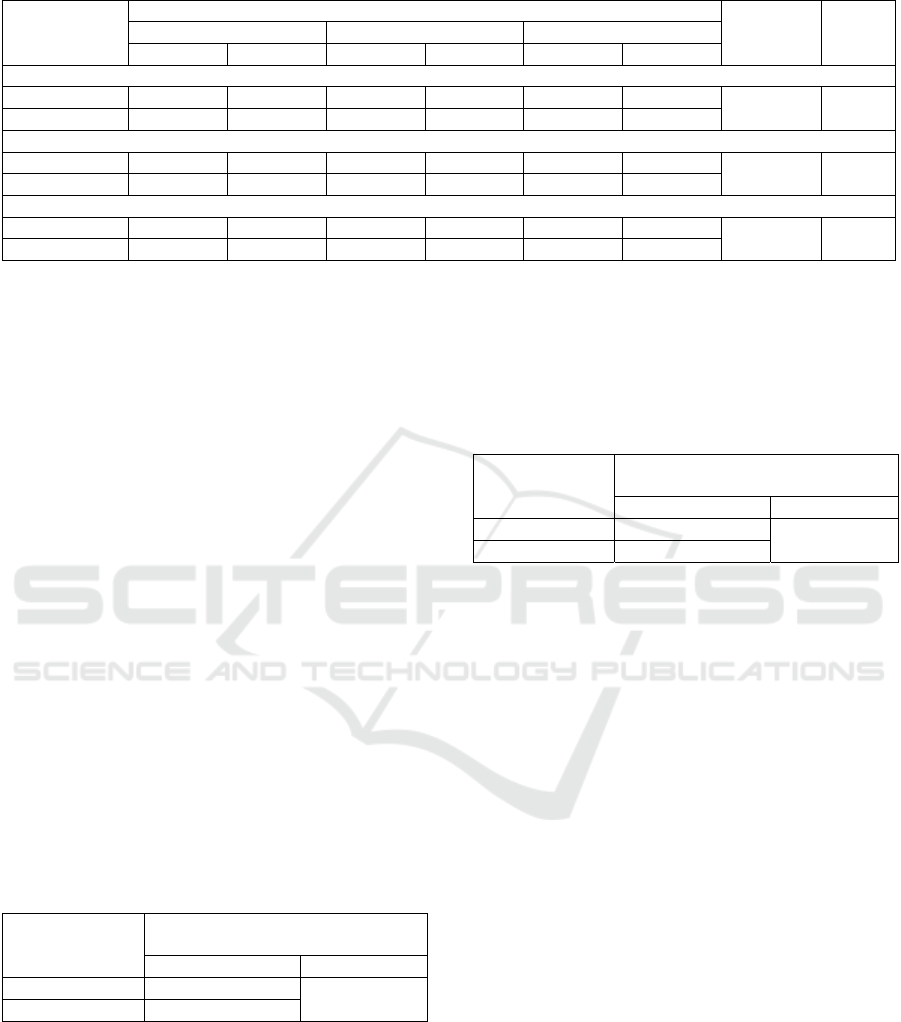
Table 5: Relationship between Environment Factors and Energy Intake.
Environment
Factors
Energy Intake
p-value PR
Excessive Normal - Deficit Total
n % n % n %
Home distance from a western fast-foo
d
restaurant
Nea
r
15 17.90 69 82.10 84 100.00 1.000 0.990
Fa
r
14 18.70 61 81.30 75 100.00
Home distance with minimarket/ supermarket/ drink stall
Nea
r
19 19.20 80 80.80 99 100.00 0.851 1.031
Fa
r
10 16.70 50 83.30 60 100.00
Fre
q
uenc
y
of food deliver
y
service use
d
Often 6 12.20 43 87.80 49 100.00 0.278 0.901
Rarel
y
23 20.90 87 79.10 110 100.00
3.2 Relationship Between Environment
Factors and Energy Intake
The difference in proportion test was carried out by
compositing the categories of energy intake into two
categories, namely normal - deficit and excessive.
Table 5 shows the result of the bivariate analysis of
the environmental factors with total energy intake.
Based on the analysis result using the chi-square
test, the three environmental factors variables were
not significantly related to energy intake (p-value >
0.005).
3.3 Relationship Between Consumption
of Western Fast Food and Energy
Intake
Table 6 shows the result of the bivariate analysis of
the consumption of western fast food with total
energy intake. Based on the analysis result using the
independent t-test, there is a significant relationship
between consumption of western fast food and
energy intake (p-value < 0.005).
Table 6: Relationship between Consumption of Western
Fast Food and Energy Intake.
Energy Intake
Energy Contribution of Western
Fast Food
(
% RDA
)
Mean
(
% RDA
)
p
-value
Excessive 1.98 0.042
Normal - Deficit 1.41
3.4 Relationship Between Consumption
of Sugar-Sweetened Beverages
(SSBs) and Energy Intake
Table 7 shows the result of the bivariate analysis of
the consumption of sugar-sweetened beverages
(SSBs) with total energy intake. Based on the
analysis result using the independent t-test, there is a
significant relationship between consumption of
sugar-sweetened beverages (SSBs) and energy
intake (p-value < 0.005).
Table 7: Relationship between Consumption of Sugar-
Sweetened Beverages (SSBs) and Energy Intake.
Energy Intake Energy Contribution of Sugar-
Sweetene
d
Beverages (% RDA)
Mean
(
% RDA
)
p
-value
Excessive 1.54 0.009
Normal - Deficit 1.13
4 DISCUSSIONS
Being in environmental factors like that can increase
the intake of energy contributed from snack foods
generally causing excess fat intake and sugar intake
in adolescents (Arundhana & Masnar, 2021). As
many as 52.80% of students are in the near category
on the variable distance from home and western fast-
food restaurants. In addition, from the total fat intake
of students in a day, there are 20.10% of students
have more fat intake. The fat intake can come from
western fast food, so it contributes to students’
energy intake being excessive. However, the results
of this study indicate that there is no significant
relationship between distance from home and
western fast-food restaurants with total energy
intake (p-value > 0.05). This can be caused because
students do not always buy food from the nearest
fast food western restaurant. In Pranata and
Gunawan's research (2018), it is stated that the most
dominant factor in choosing a place to eat is the
price of the food and distance is the last factor in
determining the choice of where to eat (Pranata &
Gunawan, 2018). Some students stated that the
reason for buying food from the nearest western
fast-food restaurant was because there was no other
The Relationship between Environmental Factors and Other Factors with Energy Intake in Students of SMA Muhammadiyah 11 Jakarta in
2022
85

choice. This means that students have a high
probability of not choosing the nearest western fast-
food restaurant to get food. In addition, the results of
the recall of the total energy intake of most students
did not eat the food sold by the western fast-food
restaurant.
In the variable distance, home distance with
minimarket/supermarket/drink stall, 62.30% of
students have a near distance between their house
and minimarket/supermarket/drink stall. This
number is a larger number than the number of
students near distance of their homes and western
fast-food restaurants. In addition, 18.90% of students
have excessive carbohydrate intake which can cause
students to have excessive energy intake.
Carbohydrate intake probably comes from the
contribution of sugar in the composition of sweet
drinks consumed by students. However, the results
of this study also show that there is no significant
relationship between the distance from home and the
minimarket/supermarket/drink stall with total energy
intake (p-value > 0.05). This could be because some
respondents stated that they did not often purchase
food or drinks from the nearest
minimarket/supermarket/drink stall. In addition,
some students have a stock of food or drinks at
home, so students no longer need to buy food or
drinks from the nearest
minimarket/supermarket/drink stall. From the
variable distance, the average distance from home
and minimarket/supermarket/food stall is 1.13 km
compared to the distance between home and western
fast-food restaurant, which is 3.16 km. This distance
is a longer distance when compared to Erdianti's
(2021) study, which is that there are fast food
restaurants within a distance of < 200 m around the
research site which can lead to high consumption of
fast food in research subjects (Erdianti, 2021).
Activity that uses food delivery services as
intermediaries to get food is called the frequency of
food delivery service used. As many as 69.20% of
students have a frequency of using food delivery
services in the rare category. The results of this
study indicate that there is no significant relationship
between the frequency of using food delivery
services and total energy intake (p-value > 0.05).
The results of the study by Maretha, et al (2020) also
have the result that there is no relationship between
the use of online food delivery applications with
eating frequency and diet quality (Maretha et al.,
2020). Based on the reasons students when using
food delivery services, because by using food
delivery services students do not need to leave the
house to get food and the attractive promos offered
on food delivery service applications are also the
reasons students use food delivery services. In
Purba, et al research (2022) as many as 45.2% of
students also stated the reason for purchasing
food/beverages through online applications was
because there was a promo (Purba et al., 2022).
The contribution of western fast-food intake is
the percentage contribution of energy intake from
western fast-food to the needs of students based on
the rate of dietary adequacy (RDA). The average
contribution of energy intake from western fast-food
respondents is 1.22% of the student’s energy needs
based on the rate of dietary adequacy (RDA). This
study shows that there is a significant relationship
between the contribution of western fast-food intake
and total energy intake (p-value < 0.05). The study
by Lucio, et al (2020), stated that the main dish
contained in the package menu provided by western
fast-food restaurants such as McDonald's, Burger
King, and Carls Jr. had a 49% energy contribution.
The large energy contribution of western fast-food is
caused by the high-fat content in these foods (Lucio
et al., 2020). In the study by Bonita and Fitranti
(2017), it was stated that there was a significant
relationship between total energy from western fast-
food and the incidence of overweight in stunting
adolescents (Bonita & Fitranti, 2017).
Contribution of sugar-sweetened beverages
(SSBs) intake, which is the percentage of it to the
needs of respondents based on the rate of dietary
adequacy (RDA). The average contribution of
energy intake from sugar-sweetened beverages
(SSBs) of respondents is 1.51% of respondents’
energy needs based on the rate of dietary adequacy
(RDA). This study shows that there is a significant
relationship between the contribution of sugar-
sweetened beverages (SSBs) intake and total energy
intake (p-value < 0.05). This is related to the
research of Dewi, et al (2012) which also has
research results that there is a relationship between
calorie intake of energy and total energy
consumption (Dewi et al., 2012). Energy from the
intake of sugar-sweetened beverages (SSBs) cannot
maintain a feeling of fullness for a long time so that
it will make repeated consumption of sugar-
sweetened beverages (SSBs) results in excess energy
intake (Annisa et al., 2020). Some respondents
consume sugar-sweetened beverages (SSBs)
purchased from contemporary drink stalls which are
widely spread among students. In addition, students
also consume packaged tea drinks that are easy to
find, some students even state that they have a stock
of packaged tea drinks at home.
ICSDH 2022 - The International Conference on Social Determinants of Health
86

5 CONCLUSIONS
In this study, there is no significant relationship
between distance from home to fast food restaurant,
distance from home to minimarket/supermarket/
drink stall, and frequency of use food delivery
service with total energy in students of SMA
Muhammadiyah 11 Jakarta and there is a significant
relationship between the contribution of western
fast-food intake to RDA and sugar-sweetened
beverages (SSBs) intake to RDA with total energy in
students of SMA Muhammadiyah 11 Jakarta. Future
researchers are expected to conduct further research
related to nutritional status as an impact that can
arise if there are problems with total energy intake.
REFERENCES
Adiyanti, M. M., Kurdanti, W., Mustikaningsih, D.,
Sholihah, K. I., Siwi, L. P., Suryani, I., & Syamsiatun,
N. H. (2015). Faktor-Faktor yang Mempengaruhi
Kejadian Obesitas pada Remaja. Jurnal Gizi Klinik
Indonesia, 11(4), 179–190. https://doi.org/10.1016/j
.gendis.2020.11.005
Akhriani, M., Fadhilah, E., & Kurniasari, F. N. (2016).
Hubungan Konsumsi Minuman Berpemanis dengan
Kejadian Kegemukan pada Remaja di SMP Negeri 1
Bandung. Indonesian Journal of Human Nutrition,
3(1), 29–40. https://www.researchgate.net/profile/Du
dung-Angkasa/publication/318360263_Konsumsi_Fas
t_Food_Soft_Drink_Aktivitas_Fisik_dan_Kejadian_O
verweight_Siswa_Sekolah_Dasar_di_Jakarta/links/59
6597a80f7e9b2a367ce8cf/Konsumsi-Fast-Food-Soft-
Drink-Aktivitas-Fisik-dan
Annisa, N. R., Dieny, F. F., Nissa, C., & Tsani, A. F. A.
(2020). Sugar-Sweetened Beverages as Risk Factor of
Central Obesity Among Women in Reproductive Age.
Jurnal Gizi Indonesia (The Indonesian Journal of
Nutrition), 8(2), 126–133. https://doi.org/10.14710/j
gi.8.2.126-133
Ardiani, F., Lubis, Z., & Sagala, N. F. A. (2017).
Gambaran Kebiasaan Konsumsi Makanan Cepat Saji
(Fast Food), Aktivitas Fisik, dan Status Gizi pada
Remaja di SMA Negeri 1 Padangsidimpuan. Jurnal
USU, 1(1).
Arundhana, A. I., & Masnar, A. (2021). Obesitas Anak
dan Remaja (Cetakan Pe). CV. Edugizi Pratama
Indonesia.
Bawadi, H., Khataybeh, T., Obeidat, B., Kerkadi, A.,
Tayyem, R., Banks, A. D., & Subih, H. (2019). Sugar-
Sweetened Beverages Contribute Significantly to
College Students’ Daily Caloric Intake in jordan: Soft
Drinks are Not the Major Contributor. Nutrients,
11(1058), 1–10. https://doi.org/10.3390/nu11051058
Bibiloni, M. del M., Pons, A., & Tur, J. A. (2013).
Prevalence of Overweight and Obesity in Adolescents -
A systematic review. Hindawi Publishing Corporation,
6, 43–47. https://doi.org/10.2147/dmso.s38626
Bonita, I. A., & Fitranti, D. Y. (2017). Konsumsi Fast Food
dan Aktivitas Fisik sebagai Faktor Risiko Kejadian
Overweight pada Remaja Stunting SMP. Journal of
Nutrition College, 6(1), 52–60.
Chikamah, A. M., & Nisa, J. (2020). Perilaku jajan
Sembarangan pada Remaja Putri yang Aktif
Menggunakan Gadget. Jurnal Kesehatan Al-Irsyad,
XIII(2), 152–157.
Dewi, P. C., Adi, A. C., & Andrias, D. R. (2012). Hubungan
antara Konsumsi Minuman Berkalori dalam Kemasan
dengan Asupan Energi dan BMI pada Remaja. Media
Gizi Indonesia, 2(Ix), 1467–1475.
Erdianti, N. P. (2021). Hubungan Pengaruh Teman Dengan
Frekuensi Konsumsi Fast Food Modern Pada
Mahasiswa Universitas Xyz Di Kota Depok. Edu
Dharma Journal: Jurnal Penelitian Dan Pengabdian
Masyarakat, 5(2), 8. https://doi.org/10.52031/edj.v5i2.
172
Harahap, L. A. H. (2019). Hubungan Kecukupan Gizi,
Pemesanan Makanan Online dan Aktivitas Fisik dengan
Obesitas pada Mahasiswa Universitas Medan Area
Tahun 2018. Universitas Sumatera Utara.
Kemenkes RI. (2018). RISKESDAS. Badan Penelitian Dan
Pengembangan Kesehatan Kementerian Kesehatan RI.
Kuswari, M., Melani, V., & Rachmayani, S. A. (2018).
Hubungan Asupan Zat Gizi dan Status Gizi Remaja
Putri di SMK Ciawi Bogor. Indonesian Journal of
Human Nutrition, 5(2). https://www.researchgate.net/
profile/Dudung-Angkasa/publication/318360263_Kons
umsi_Fast_Food_Soft_Drink_Aktivitas_Fisik_dan_Kej
adian_Overweight_Siswa_Sekolah_Dasar_di_Jakarta/li
nks/596597a80f7e9b2a367ce8cf/Konsumsi-Fast-Food-
Soft-Drink-Aktivitas-Fisik-dan
Li, C., Mirosa, M., & Bremer, P. (2020). Review of Online
Food Delivery Platforms and their Impacts on Sus-
tainability. Sustainability (Switzerland), 12(14), 1–17.
https://doi.org/10.3390/su12145528
Lucio, A. G. P., Martínez, D. N. H. S., Miranda, C. O.,
Méndez, L. Q., & Tolentino-Mayo, L. (2020).
Nutritional Quality of Fast Food Kids Meals and Their
Contribution to the Diets of School-Aged Children.
Nutrients, 12(3), 1–10. https://doi.org/10.3390/nu12030
612
Mackay, S., Castro, T. G. De, Young, L., Shaw, G.,
Mhurchu, C. N., & Eyles, H. (2021). Energy , Sodium ,
Sugar and Saturated Fat Content of New Zealand Fast-
Food Products and Meal Combos in 2020. Nutrients,
13(4010), 1–14.
Maretha, F. Y., Margawati, A., Wijayanti, H. S., & Dieny,
F. F. (2020). Hubungan antara Penggunaan Aplikasi
Pesan antar Makanan Online dengan Frekuensi Makan
dan Kualitas Diet. Journal of Nutrition College, 9(3),
161–168.
Nurcahyani, G. (2021). Pandemi Pacu Peningkatan
Layanan Digital di Kalangan Generasi Z. Media
Indonesia.
Palupi, M. (2014). Pengaruh Pemberian Mikronutrien
(Taburia) Terhadap Asupan makan balita yang
The Relationship between Environmental Factors and Other Factors with Energy Intake in Students of SMA Muhammadiyah 11 Jakarta in
2022
87

Menjalani Rawat Inap Di Rumah Sakit. In Program
Pascasarjana Undip. http://eprints.undip.ac.id/43151/
1/2._KATA_PENGANTAR_10032014.pdf
Pranata, E., & Gunawan, T. P. (2018). Penggunaan Nilai
dan Vektor Eigen Untuk Menentukan Prioritas Faktor-
Faktor Penentu Pemilihan Tempat Makan (Restoran).
Teknika, 7(2), 148–151. https://doi.org/10.34148/
teknika.v7i2.119
Purba, M. L., Rahmat, M., & Suprihartono, F. A. (2022).
Faktor - Faktor yang Mempengaruhi Perilaku terhadap
Pemilihan Makanan / Minuman Melalui Aplikasi
Online. 2(3).
Townshend, T., & Lake, A. A. (2016). Obesogenic
Environments: The Built and Food Environments
Current Evidence. Durham University, 137(1), 38–44.
Wang, R., & Shi, L. (2012). Access to Food Outlets and
Children’s Nutritional Intake in Urban China: A
Difference-in-Difference Analysis. Italian Journal of
Pediatrics, 38(1), 1. https://doi.org/10.1186/1824-7288-
38-30
ICSDH 2022 - The International Conference on Social Determinants of Health
88
