
Financial Stress Evaluation of Listed Companies Based on Factor
Analysis
Shengdao Gan and Yuan Fang
Sichuan University, Chengdu, Sichuan, China
Keywords: Financial Stress, Actor Analysis, Asurement System.
Abstract: Rom the perspective of profit pressure and payment pressure, combined with the theory of corporate
stakeholders, 16 financial pressure indicators were proposed, and a set of comprehensive evaluation of
corporate financial pressure measurement system was constructed by factor analysis. Further, comparative
analysis was conducted on enterprises with different pressure levels, and it was found that the financial
pressure of ST enterprises was significantly higher than that of normal operating enterprises. The future
performance of enterprises with abnormal financial pressure is significantly lower than that of enterprises
with moderate financial pressure. The conclusion shows that the debt repayment pressure still plays a
dominant role in the financial pressure. Managers should be alert to the financial pressure that is too high
and fall into financial difficulties. At the same time, they should also prevent the financial pressure from
being too small and reduce the efficiency of resource use.
1 INTRODUCTION
Financial stress is formed by the external and
internal environment of an enterprise acting on its
financial activities. (Duan, 2014) Enterprises will
face varying degrees of financial pressure in the
course of operation. Moderate financial pressure is
conducive to the enterprise to improve the utilization
efficiency of resources, too much or too little
financial pressure is not conducive to the
development of the enterprise. (Gan, 2016) When
the financial pressure is too high, an enterprise may
go through the process of normal financial
condition, deterioration and bankruptcy, and
eventually evolve into financial risk. (Zheng, 2014)
When the financial pressure is too small, such as the
appearance of financial affluence and other
phenomena, it will reduce the capital utilization
efficiency of enterprises (Gan, 2020).
The existing literature mainly focuses on the
study of the consequences of excessive financial
stress and the prediction of financial risks. In the
aspect of consequence research, the fraud triangle
theory believes that three factors, pressure,
opportunity and self-rationalization, act together to
lead to the fraud behavior. Among them, financial
pressure is the direct inducement that leads Chinese
listed companies to take frauds, and financial
pressure can be subdivided into debt repayment
pressure and backdoor financing pressure. (Wu,
2010) On the other hand, in the face of financial
pressure, enterprises are more inclined to adopt such
measures as whitewashing the report and earnings
management to alleviate short-term pressure, which
will also lead to further increase of financial
pressure and lead to financial risks in the future.
(Wang, 2019) Moreover, in the empirical research,
the research focus is mostly on the sample of
enterprises with excessive financial pressure.
Domestic scholars often select enterprises marked as
special treatment (ST) as samples of financial risks.
Foreign scholars often choose bankrupt enterprises
as the sample to study financial risks.
In terms of financial risk prediction, the main
quantitative research methods include discriminant
model, probabilistic model and non-parametric
model. In the discriminant model, Beaver proposes
to use debt guarantee ratio, return on assets (ROA),
asset-liability ratio (ALR) and asset-safety ratio
(ASR) to determine whether an enterprise fails.
(Beaver, 1966) Altman proposed Zeta model, and
judged enterprise failure by five financial indexes.
(Altman, 1977) The comparison shows that the
selected indicators are mainly financial indicators of
solvency, shell protection pressure and enterprise
liquidity. The probability model is based on Logistic
Gan, S. and Fang, Y.
Financial Stress Evaluation of Listed Companies Based on Factor Analysis.
DOI: 10.5220/0011721300003607
In Proceedings of the 1st International Conference on Public Management, Digital Economy and Internet Technology (ICPDI 2022), pages 37-44
ISBN: 978-989-758-620-0
Copyright
c
2023 by SCITEPRESS – Science and Technology Publications, Lda. Under CC license (CC BY-NC-ND 4.0)
37

model and Probit model. The basic idea is to study
the financial indicators of enterprises that have fallen
into financial difficulties, and then propose a
comprehensive measurement standard (Ohlson,
1980; Zmijewsk, 1984). The non-parametric model
is based on survival analysis, and the purpose of this
method is to predict the bankruptcy time of
enterprises. To sum up, existing studies, on the one
hand, only focus on the study of excessive pressure,
even if the starting point of the prediction model is
the enterprise already in financial risk; on the other
hand, the measured financial indicators are limited
to three aspects: solvency, cash flow and
profitability.
In real life, enterprises also face profit pressure
from shareholders and pressure from external
stakeholders, so it is necessary to expand the scope
of measurement. In addition, little attention has been
paid to the consequences of too little financial stress.
In fact, the serious consequences caused by
excessive financial pressure of enterprises are not
caused by overnight financial decisions and business
activities, but the inevitable trend caused by the
gradual accumulation of risk factors within
enterprises. Therefore, enterprises should take
preventive measures in the operation process, pay
due attention to the financial pressure faced by
enterprises, and keep it at a reasonable level, so as to
promote the better development of enterprises.
Based on the existing literature, this paper adds other
indicators related to the financial stress of
enterprises, uses factor analysis method to build a
measurement system of the financial stress of
enterprises, and finally uses actual samples for
analysis.
2 INDEX SYSTEM
CONSTRUCTION AND
SAMPLE SELECTION
2.1 Construction of Indicator System
The goal of factor analysis is dimensionality
reduction. Based on the correlation between various
indexes, common factors can be extracted by linear
combination, and most of the information of original
indexes can be represented by a few factors. As
mentioned above, financial ratio is the main index to
measure financial stress in the previous literature,
and there is coincidence and similarity among the
indexes. Factor analysis method can retain most of
the effective information, and eliminate the repeated
information among the indexes. Therefore, this
paper chooses factor analysis method to establish a
corporate financial stress measurement system.
In order to cover as much as possible influence
of enterprise financial pressure index, based on the
Beaver (1966), Altman (1987), guo-ping wu (2010),
and Wang Hong (2019) scholars such as the
selection of measuring financial pressure, on the
basis of facing the profit from the enterprise pressure
and pay two financial pressure Angle, combining the
theory of enterprise stakeholders added 10
indicators, received 16 indicators, as shown in table:
Table 1: Indicator description
1
.
Target
classification
Basic indicators calculation
The serial
numbe
r
Profit pressure
Operating margin Gross profit/operating income X1
Operating net interest rate Net profit/operating income X2
Equity incentive goal Growth rate of net profit in 2018 relative to 2017 X3
Analysts Focus on Stress Analysts watched the numbers that year X4
Annual profit
0= the profit before the year is negative,
1= the profit before the year is positive
X5
Enterprise growth Revenue growth rate X6
Pay pressure
Net cash flow from operating
activities/current liabilities
X7
Total net cash flow/liabilities
from operating activities
X8
Current ratio Current assets/current liabilities X9
Asset-liability ratio Total liabilities/total assets X10
Equity/Claims Year-end share price * Number of shares issued/claims X11
ICPDI 2022 - International Conference on Public Management, Digital Economy and Internet Technology
38

Operating/Total assets Current assets - Current liabilities/total assets X12
Dividend distribution rate Dividends payable/net profit X13
Effective tax rate X14
Pay the pressure Employee compensation/operating costs X15
R&d spending R&d investment/revenue X16
2.1.1 Indicators of Profit Pressure
The requirement of maintaining profitability runs
through the whole process from listing to delisting.
Therefore, enterprises will first face profit pressure,
which comes from the difficulties in the operation
process on the one hand, and from the capital market
to evaluate the advantages and disadvantages of
enterprises through earnings on the other hand.
Operating gross margin and operating net margin
are commonly used as indicators to measure the
profitability of enterprises. In terms of profit
pressure indicators, this paper first considers adding
these two indicators to measure the profitability
pressure faced by enterprises in operation.
The shell-holding pressure is a dummy variable.
The value of 0 represents the enterprise loss in the
previous year, while 1 represents the enterprise
profit in the previous year. The enterprise growth is
used to measure the pressure of profit keeping, and
the index is the growth rate of the enterprise's net
profit in the current year compared with that of the
previous year. When an enterprise has losses or other
abnormal operating conditions for two consecutive
years, it will be labeled as ST enterprise and face
delisting risk, thus affecting the financing and
enterprise value of listed enterprises. Therefore, the
enterprise will try its best to maintain the profit state,
and considering that the stock price will fluctuate
with the profit situation, it will also try its best to
increase the revenue growth rate of the enterprise.
Therefore, these two indicators are used to measure
the profit pressure of enterprises.
Secondly, the capital market can be scrutinized
from the perspective of shareholders and other
investors. The pressure of shareholders on the
enterprise can be transmitted from the two paths of
demanding profits and demanding dividends. The
profit target put forward by shareholders is not
disclosed publicly in the document. Considering the
accessibility of data, this paper considers to select
the profit target put forward by shareholders in the
public document as a measurement index. The
equity incentive plan is put forward by the enterprise
to solve the agency problem, which conveys the
profit level that the shareholders hope the enterprise
can achieve in the future. Therefore, this paper
chooses equity incentive target to measure the profit
expectation of shareholders.
Analysts focus on Pressure Measured by the
number of analysts who followed the same year,
financial analysts, as an external force, on the one
hand, will exert pressure on companies to push
management to meet analysts' profit forecasts,
resulting in "short-sighted" behavior. (Dai, 2015)
For example, the more analysts pay attention, the
more likely management is to spend less on research
and development to improve a company's short-term
performance. (Jie, 2013) And as the attention of
corporate analysts rises, so does the level of earnings
management. (Xie, 2014) On the other hand, the
higher the analysts' attention is, the more accurate
the forecast will be, which can relieve the financing
pressure of enterprises. (Fan, 2019) Therefore, this
paper chooses analysts' attention to measure the
pressure exerted on enterprises by other investors in
the capital market.
2.1.2 Payment Pressure
The income of an enterprise will eventually flow to
creditors, other stakeholders (government,
employees, etc.) and equity holders in turn, and the
final balance will be retained earnings. In the past,
more attention was paid to the financial pressure
brought by creditors. In fact, other beneficiaries
would also bring financial pressure on enterprises.
First of all, from the perspective of the creditors,
combining with the existing literature current ratio,
asset-liability ratio, market capitalization/liabilities,
working capital, liabilities, net business activities
generated cash flow/current liabilities, net business
activities generated cash flow/total liabilities six
indicators to measure the enterprise's solvency and
capital structure is reasonable.
Secondly, in practice, enterprises will respond to
financial pressure by avoiding tax, cutting r&d
expenditure and reducing employee compensation.
(Wei, 2020) Therefore, in this paper, the effective tax
rate, employee compensation and R&D expenditure
of other profit distribution items are selected to
measure the financial pressure brought by other
stakeholders.
Financial Stress Evaluation of Listed Companies Based on Factor Analysis
39

The effective tax rate is the ratio between the
amount of taxes paid and the actual income of the
enterprise. Different from the nominal interest rate,
the effective tax rate can relate the tax burden to the
enterprise's earnings. Therefore, the effective tax rate
is selected to measure the financial pressure of the
enterprise.
Employee compensation is often rigid. (Fehr,
1999) In other words, when the profit status of the
enterprise is good, the salary of employees will rise
or remain unchanged, but when the profit status of
the enterprise is bad, the salary of employees will
not necessarily decrease, bringing the payment
pressure to the enterprise. Employee compensation
is often regarded as labor cost. Therefore, the ratio
of employee compensation to operating cost is used
in this paper. The bigger the index is, the greater the
financial pressure will be.
R&d spending is non-mandatory and tends to
fluctuate with a company's financial position. There
is a significant positive correlation between
enterprise performance and R & D expenditure.
(Sun, 2013) Therefore, the ratio of R & D
expenditure to operating income is used in this
paper. The larger the index is, the smaller the
financial pressure is.
Finally, from the perspective of shareholders. As
mentioned above, the pressure exerted by
shareholders can be divided into the pressure of
profit target and the pressure of demanding
dividends. For enterprises, dividends will reduce
their cash flow and affect their solvency and future
business activities. Therefore, dividend payout ratio
is selected to measure the payment pressure
demanded by shareholders.
2.2 Data Selection and Preprocessing
The financial stress indicators of listed companies
involved in this paper are all derived from CSMAR
database, and the time span is from the first quarter
of 2014 to the second quarter of 2020.Before the
study, the data were preprocessed in this paper.
First of all, the target growth rate selected in this
paper must meet the following conditions: (1) In
order to prevent the time span is too large, and the
target growth rate is too high or too low under the
influence of uncontrollable factors, the selection of
equity incentive plan should be proposed at least in
the first three years of the study year.(2) It is found
in the collection and arrangement that the incentive
target measure caliber of most enterprises is the net
profit growth rate. In order to make the target
comparable, this paper excludes a small number of
enterprises that take the operating income growth
rate, EVA added value and other indicators as the
standard, and only keeps the enterprises that take the
net profit growth rate as the measurement index. In
order to eliminate the large difference between
industries, the manufacturing industry was selected
as the research object.
Secondly, in order to ensure the reliability of the
results, this paper preprocesses the data according to
the following standards: Eliminate enterprises with
missing key indicators. (2) Continuous variables in
1% and 99% of the level of Winsorize processing,
the software used for Stata16.0.Finally, 250
enterprises were collected and sorted in 2017, 297
enterprises in 2018, and 267 enterprises in 2019.A
total of 814 enterprises.
Finally, before exploratory factor analysis, KMO
and Bartlett sphericity tests were carried out for the
18 selected indicators. The results showed that
KMO=0.767, the test result was greater than 0.5, and
the Bartlett spherical test result was significant,
indicating that the selected indicators were suitable
for factor analysis.
Table 2: KMO and Bartlett tests
2
.
Number of KMO sampling appropriateness. 0.767
Bartlett
sphericity test
The approximate chi-square 3095.24
Degrees of freedom 120
si
g
nificant 0.000
3 EMPIRICAL TEST
3.1 Exploratory Factor Analysis
Since factor analysis is applicable to sectional data
analysis, this paper first uses SPSS26.0 to make
exploratory factor analysis of the financial pressure
indicators collected by enterprises in 2018, and uses
principal component analysis to extract common
factors. A total of 6 common factors with the
characteristic value greater than 1 are retained. As
shown in the table, the total interpretation rate of the
six common factors reaches 76.548%, which can
contain most of the information of the selected
indicators. Secondly, in order to better explain the
meaning of each common factor, this paper adopts
the maximum variance method to carry out factor
rotation and construct factor loading matrix. The
rotation converges after the 14th iteration. The
following table shows the load coefficient of each
index on the common factor after rotation.
ICPDI 2022 - International Conference on Public Management, Digital Economy and Internet Technology
40
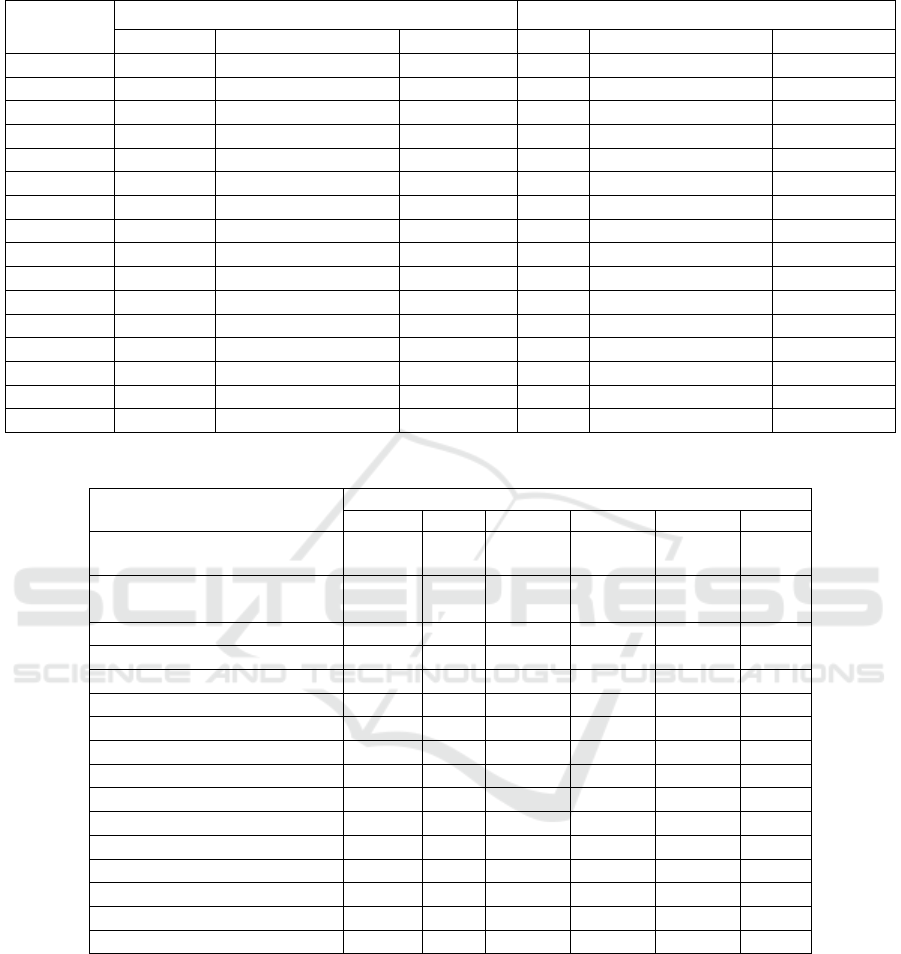
Table 3: Total variance interpretation
3
.
composition
Initial eigenvalue Sum of squares of rotating loads
A total of Percentage of variance Cumulative % total of Percentage of variance Cumulative %
1 5.368 33.548 33.548 3.926 24.535 24.535
2 1.981 12.384 45.932 2.435 15.220 39.755
3 1.621 10.134 56.066 1.577 9.855 49.609
4 1.208 7.551 63.617 1.466 9.164 58.774
5 1.067 6.671 70.288 1.429 8.934 67.708
6 1.002 6.260 76.548 1.414 8.841 76.548
7 0.776 4.848 81.396
8 0.714 4.464 85.860
9 0.642 4.014 89.875
10 0.550 3.438 93.312
11 0.306 1.915 95.227
12 0.280 1.750 96.977
13 0.217 1.355 98.332
14 0.150 0.941 99.272
15 0.097 0.606 99.878
16 0.019 0.122 100.000
Table 4: Component matrix after rotation
4
.
composition
1 2 3 4 5 6
Total net cash flow/liabilities from
operating activities
0.956 0.010 0.082 0.082 0.062 0.002
Net cash flow from operating
activities/current liabilities
0.953 0.008 0.079 0.087 0.058 0.019
Equity/Claims 0.759 0.352 0.261 0.032 0.059 0.123
Current ratio 0.718 0.313 0.512 0.053 0.004 0.004
Asset-liability ratio 0.619 0.293 0.552 0.070 0.187 0.079
Pay the pressure 0.135 0.883 0.016 0.124 0.028 0.103
Operating margin 0.358 0.776 0.121 0.038 0.184 0.175
R&d spending 0.010 0.722 0.152 0.190 0.234 0.025
Analysts Focus on Stress 0.085 0.207 0.659 0.273 0.041 0.149
Operations/Liabilities 0.498 0.374 0.591 0.163 0.041 0.083
Equity incentive goal 0.112 0.045 0.156 0.826 0.075 0.053
Annual profit 0.099 0.027 0.075 0.572 0.373 0.516
Effective tax rate 0.045 0.040 0.109 0.136 0.844 0.026
Dividend distribution rate 0.041 0.003 0.239 0.364 0.570 0.091
Enterprise growth 0.048 0.051 0.078 0.098 0.138 0.864
Operating net interest rate 0.448 0.189 0.021 0.347 0.301 0.546
3.2 Common Factor Naming
Common factor F1 includes five indicators,
including net cash flow generated from operating
activities/total liabilities, net cash flow generated
from operating activities/current liabilities,
equity/creditor's rights, current ratio and
asset-liability ratio, in order of factor load. The first
two indicators reflect the correlation between cash
flow and liabilities of an enterprise, while the last
three indicators reflect the capital structure of an
enterprise. Therefore, the common factor F1 is
named as the solvency pressure factor.
The common factor F2 is ranked according to the
factor load, including salary pressure, operating
gross margin, and R&D expenditure. It mainly
reflects the operating income status of the enterprise
and the pressure of other payment items, so it is
named profit quality factor.
Financial Stress Evaluation of Listed Companies Based on Factor Analysis
41

Common factor F3 is based on both analyst focus
stress and working capital/total assets. Among them,
analysts' attention is negatively correlated with
corporate financing constraints, and corporate
financing constraints are also negatively correlated
with corporate debt capacity. (Li, 2011) At the same
time, it is found that corporate liquidity ratio and
asset-liability ratio are also highly correlated with
the common factor F3, which mainly represents the
ratio of corporate liabilities and assets. Therefore,
the common factor F3 is named as the financing
pressure factor.
The common factor F4 is composed of
shareholder pressure and shell retaining pressure.
Shareholders' expectation of earnings is proposed
based on the earnings status over the years. Its
essence is to expect the enterprise to maintain profits
and improve its value. Therefore, the common factor
F4 is named as the growth pressure factor
Common factor F5 is based on two items
including effective tax rate and dividend payout
ratio. These two items are the distribution items of
corporate profits, and their size is related to the
status of corporate profits. When an enterprise loses
money, its tax rate and dividend payout ratio are
generally 0, that is, it is not paid. Therefore, the
common factor F5 is named as other payment
pressure factors.
Common factor F6 represents the net profit
quality of the enterprise in the current year
according to two indicators including operating net
interest rate and enterprise growth, so it is named as
net profit quality factor.
4 FINANCIAL STRESS
EVALUATION AND ANALYSIS
OF DIFFERENT COMPANIES:
4.1 Enterprise Index Score
The formula of six common factors and total score is
as follows:
𝐹
=
∑
𝑊
𝑋
(1)
𝑆
=
∑
𝑊
𝑋
(2)
Where, is the value of the ith index, is the load
coefficient of this index on the JTH common factor,
and n is the number of indexes. Where, is the value
of the ith index, is the load coefficient of this index
on the JTH common factor, and n is the number of
indexes. According to the formula, the lower the
score, the greater the stress, and vice versa.
Based on the above scoring formula, this paper
calculates the scores of 814 listed companies from
2017 to 2019.The comparison is made in the
following two situations :(1) for the enterprises that
are specially treated in the current year or the year
after that, the financial pressure of the enterprises
that are normally operated is compared horizontally
according to the year and scale of 1:1.(2) The
samples were divided into two categories:
enterprises with normal pressure and enterprises
with abnormal pressure, and their earnings
performance in the following year were compared
respectively.
Through the analysis, it is found that the
financial pressure of the specially treated enterprises
in the current year or the year after is significantly
higher than that of the paired normal operating
enterprises. The profit performance of enterprises
with abnormal pressure in the following year is
significantly lower than that of enterprises with
normal pressure;
4.2 Comparison Between ST
Enterprises and Normal Operating
Enterprises
In this paper, a total of 21 enterprises changed from
normal operation to special treatment from 2017 to
2019 in the same year or the year after, and then 21
similar enterprises were matched according to year
and enterprise size. The financial stress scores of the
two types of enterprises in the current year were
investigated respectively, and the mean test results
were as follows:
Table 5: Mean test of pressure scores of ST and non-ST enterprises5.0
No. of ST Mean No. of Non-ST Mean MeanDiff t-value
Score 21 0.56 21 0.068 0.492 * * * 3.320 * * *
Table 6: Mean test of abnormal pressure and normal pressure corporate earnings6.
No. of Normal Mean No. of Abnormal Mean MeanDiff t-value
Inc1 677 0.386 136 0.041 0.056 * * 2.222 * *
Inc2 675 0.178 137 0.033 0.019 * 1.894 *
ICPDI 2022 - International Conference on Public Management, Digital Economy and Internet Technology
42

It can be seen from the table that the financial
pressure score of ST enterprises in that year is lower
than that of normal operating enterprises, and the
difference is significant at 1%. The results show that,
on the one hand, excessive financial pressure will
bring difficulties to the enterprise's future operation.
On the other hand, it is a gradual development
process for an enterprise to get into financial
difficulties, so the management should pay attention
to the financial indicator information of the
enterprise and keep alert to the financial pressure of
the enterprise.
4.3 Comparison between Enterprises
with Moderate Pressure and
Enterprises with Abnormal
Pressure
According to section B, pecial processing enterprise
financial pressure to the geometric average of 0.56,
the pressure will score less than 0.56 and is greater
than 0.56 respective defined as financial stress and
financial pressure too small enterprises, companies
are collectively referred to as abnormal pressure, the
rest of the enterprise is defined as the pressure
moderate, respectively to investigate two kinds of
enterprise after a year of profit growth.
It can be seen from the table that no matter what
profit performance indicators are used, enterprises
under normal pressure will perform better than those
under abnormal pressure in the future, with growth
rates 9.67% and 12.4% higher respectively, and the
two mean tests are significant at the level of 10%
and 5% respectively. The results show that moderate
financial pressure can promote enterprises to achieve
better earnings performance.
5 RESEARCH CONCLUSIONS
AND SUGGESTIONS
Paying attention to the financial pressure of
enterprises helps managers to make better financial
decisions and maintain the healthy development of
enterprises. This paper first takes listed
manufacturing enterprises in 2018 as research
samples and uses factor analysis to construct a set of
measurement system to comprehensively evaluate
the financial stress of enterprises. Secondly, the
listed manufacturing enterprises from 2017 to 2019
are taken as research samples to analyze from two
perspectives, namely, the comparison between
special treatment enterprises and normal operating
enterprises, and the comparison between abnormal
financial pressure and normal enterprises. The
results showed that the financial pressure of the
enterprises that were subjected to special treatment
in the same year or the year after was significantly
higher than that of the normal enterprises of the
same size. The profits of enterprises under normal
financial pressure in the next year are significantly
better than those under abnormal financial pressure.
It shows that moderate financial pressure is
beneficial to the growth of enterprises, while too
much or too little financial pressure will restrain the
development of enterprises.
According to the research conclusions, the
following suggestions are proposed for the financial
pressure generally faced by enterprises: First, pay
close attention to the pressure of debt repayment. In
this paper, it is found that the interpretation rate of
debt repayment pressure factor to the overall
information reaches 24.545%, accounting for
32.052% of the retained information, indicating that
debt repayment pressure is still the biggest pressure
faced by enterprises. Different from the pressure
exerted by shareholders, the repayment pressure has
strict requirements on the repayment time, so it is
more urgent. Enterprises should take on appropriate
debts and choose a reasonable capital structure.
Second, we should be alert to the situation of too
little financial pressure. Article inspection found that
financial pressure too small enterprise's performance
is still under normal pressure in the future, there may
be the reason: the pressure is too small too small
businesses generally solvency, explain enterprise
debt relative to its assets, cash flow situation is less,
but relatively high pressure appropriate corporate
debt, financial leverage effect, to choose better
decision prompted anagers to meet the requirements
of creditors and equity. Therefore, enterprises should
keep financial pressure at an appropriate level.
REFERENCES
Altman E. (1977) ZETATM analysis A new model to
identify bankruptcy risk of corporations [J]. Journal of
Banking & Finance,29-54,
Beaver W. (1966) Financial Ratios As Predictors of
Failure[J]. Journal of Accounting Research,71-111
Dai Yunhao. (2015) Research on analyst Tracking,
Supervision effect and Enterprise Behavior [D].
Huazhong University of Science and Technology
Duan Huyou, Wang Rui, Gan Shengdao. (2014)
Mechanism Analysis and Countermeasures for
Financial stress of Small and Medium-sized
Enterprises [J]. Enterprise Economics, (01):99-102.
Financial Stress Evaluation of Listed Companies Based on Factor Analysis
43

Fan Yunrui, Li Chenying.(2019) Analysts' Concerns,
Internal control and Corporate Debt Financing
constraints [J]. Finance and Economics, (10):25-30.
Fehr E, A, Falk. (1999) Wage Rigidity in A Competitive
Incomplete Contract Market [J]. The Journal of
Political Economy,106-107
Gan Shengdao. (2016) Corporate Financial Pressure:
Source and Control [J]. Friends of Accounting, (09):
20-22.
Gan Shengdao, Chen Ran, Xianchang Hu Dan. (2020)
Financial Affluence: Concept creation and Research
topic [J]. Friends of Accounting, (01):10-13.
Jie (Jack) He, Xuan Tian. (2013) The dark side of analyst
coverage: The case of innovation[J]. Journal of
Financial Economics,109(3).
Li Ke, Xu Longbing. (2011) Financing constraints, debt
capacity and corporate performance [J]. Economic
research, 46(05):61-73.
Ohlson J A.(1980) Financial ratios and the probabilistic
prediction of bankruptcy[J].Journal of Accounting
Research,109-131
Sun Weifeng, Huang Zuhui. (2013) Advertising
expenditure, R&D expenditure and corporate
performance [J]. Scientific research management,34
(02):44-51.
Wu Guoping, Ma Shi.(2010) Empirical study on financial
stress and information disclosure violation of listed
companies [J]. Financial theory and
practice,31(02):59-63.
Wang Hong, Liao Chunyan, Liu Yutong. (2019) Financial
Stress, Corporate Governance Efficiency and Earnings
Management [J]. Journal of Finance and Accounting,
(09):9-16.
Wei Zhihua, Xia Taibiao. (2020) Social Insurance
Payment burden, Financial pressure and Corporate Tax
Avoidance [J]. China Industrial Economy, (07):
136-154.
Xie Zhen, Xiong Jinwu. (2014) Analyst focus and earnings
management: an analysis of China's listed companies
[J]. Finance and trade research,25(02):139-149.
Zheng Heming. (2014) Research on financial Risk
Formation and Diffusion Mechanism of Private
Enterprises [D]. Zhejiang University
Zmijewsk, ME. (1984) Mehtodologieal Issues Related to
the Estimation of Financial Distress Prediction Models
[J]. Journal of Accounting Research.59-82
ICPDI 2022 - International Conference on Public Management, Digital Economy and Internet Technology
44
