
Mapping Area Analysis Using ArcGIS and AutoCad: Cast in Border
Area
Andrial Imran
1
, Syarifudin
1
and Arkas Viddy
2
1
Civil Enggineering, Politekinik Negeri Nunukan, Jl. Limau Sedadap, Nunukan, Indonesia
2
Department of Administration Business, Politeknik Negeri Nunukan, Jl. Limau Sedadap, Nunukan, Indonesia
Keywords: Area, Mapping, PT. Inhutani.
Abstract: The purpose of this study is to analyze land changes within the PT Inhutani Nunukan area. Direct
measurement is using Garmin 76 CSx and 62 CS type GPS devices with data processing using AutoCAD and
ArcGIS applications. The results of the measuring and mapping showed that the area of the settlement area is
19.393 Ha, the area of green open space is 0.540 Ha or equal 5394.313 m2. It is mesuared that hotel area is
0.145 Ha or equal 454.431 m2, and the office area is 1.435 Ha or equal 14358,398 m2. It is also mapped that
the area of public and social facilities is 1,375 Ha or equal 13738,705 m2, mess area 1,830 Ha or equal
18292,675 m2, and education facilities area 0.465 Ha or equal 4653.861 m2. It is identified that market area
0.832 Ha or equal 8321.291 m2, terminal area 0.499 Ha or equal 4990, 441 m2, while vacant land area 0.214
Ha or equal 2142.659 m2. Lastly it is also identified that BNI housing area 0.190 Haor equal 1896,766 m2.
Then the total area = 26,929 Ha or equal 269259,159 m2.
1 INTRODUCTION
Nunukan Regency is a district in the North
Kalimantan Province which is located on the border
of Indonesia-Malaysia. Based on the Regional Spatial
Planning, Nunukan Regency is designated as a green
open space area, residential area, as well as a trade
and service area (Peraturan Daerah Nomor 19, 2013).
However, in reality there is a building permit area in
the urban center which is the property of one of the
State-Owned Enterprises, namely PT. Inhutani
Persero I (Vini Indriasari, 2021).
PT. Inhutani Persero I Nunukan is a state-owned
company engaged in the forestry sector with a land
area of 271,000m2. After a long time running the
business on the land, the activities of PT. Inhutani
began to decrease so that problems arise related to
land use where the land is used by the community for
housing. As a result of this land use, the community
and PT. Inhutani conflict occurs because residents
want legal certainty of the land they use. Besides
being used by residents, the land of PT. Inhutani is
also used for public facilities, government offices,
private, markets, green open spaces (Basuki, 2020).
The following areas use the land of PT. Inhutani
• Settlements.
• Public Facilities.
• Office.
• Mess
• Market.
• Educational Facilities.
• Green Open Space.
• Vacant Land.
• eta Hotel Area.
• Terminals.
• BNI Housing.
• Buildings within the PT. Inhutani.
To find out clearly what are the uses and land area
of PT. Inhutani used by residents and other purposes,
it is necessary to measure and map to find out the
boundaries, area and percentage of land use.
2 RESEARCH METHODOLOGY
2.1 Preparing Data
2.1.1 Primary Data
• Coordinates of land area boundaries
• Land boundary location tracking
• Base mark coordinates
132
Imran, A., Syarifudin, . and Viddy, A.
Mapping Area Analysis Using ArcGIS and AutoCad: Cast in Border Area.
DOI: 10.5220/0011724400003575
In Proceedings of the 5th International Conference on Applied Science and Technology on Engineering Science (iCAST-ES 2022), pages 132-136
ISBN: 978-989-758-619-4; ISSN: 2975-8246
Copyright © 2023 by SCITEPRESS – Science and Technology Publications, Lda. Under CC license (CC BY-NC-ND 4.0)
2.1.2 Secondary Data
• Satellite Image Map
• Spatial Map
• Situation Map of PT. Inhutani
• Map of HGB PT. Inhutani
2.2 Preliminary Survey
Preliminary survey is a survey to find out the
condition of the area, the environment, where the
coordinate points are taken and the area tracking path.
2.3 Traking
Tracing is done using GPS by circling the entire land
used to form a closed polygon. The survey results will
be processed using Autocad and then analyzed for the
suitability of the measurement results using Google
Earth and Satellite Imagery. After the field data is in
accordance with the satellite image, the land will be
mapped using ArcGIS (Sudarsono, 2020); (Omura,
2017); (Wahana, 2015).
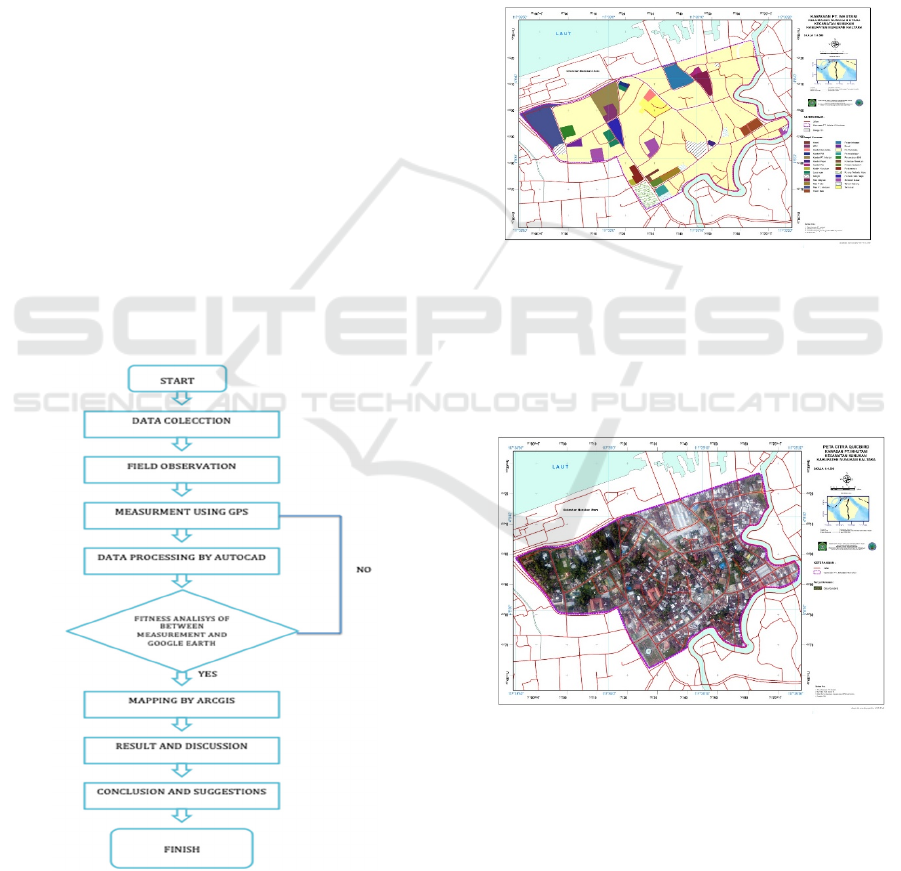
2.4 Research Diagram
This study aims to map the land of PT. Inhutani. The
stages in mapping can be seen in the image below.
Figure 1: Research Diagram.
3 RESULTS AND DISCUSSION
3.1 Map of PT. Inhutani
Total area of PT. After conducting survey analysis
and field measurements, Inhutani has an area of
29,784 ha, which consists of residential areas, green
open space areas, hotel areas, public and social
facilities areas, BNI housing areas, market areas,
residential areas, educational facilities areas, land
areas. empty, office areas, terminal areas, as well as
road facilities and infrastructure.
Figure 2: Map of PT. Inhutani.
3.2 Map of Quickbird Image
From the Quickbird image map above, we can see
that the area of PT. Inhutani is already crowded with
buildings and other infrastructure facilities.
Figure 3: Map of Quickbird Image.
3.3 Map of Residential
The residential area included in the PT. Inhutani has
an area of 19.393 Ha/193901,218 m2, with a
percentage of 72.02%.
Mapping Area Analysis Using ArcGIS and AutoCad: Cast in Border Area
133

Figure 4: Map of Residential.
3.4 Map of Public Facilities
Figure 5: Map f Public Facilities.
The area of public facilities consists of libraries,
health centers, mosques, sports facilities, and fields
which have a total area of 1,375 ha/ 13738,655 m2,
with a percentage of 5.11%.
3.5 Map of Office
The office area consists of the Tax office, PT.
Inhutani, North Nunukan sub-district office, Post
office, PMI office, KPU office, Kodim office,
Nunukan Polsek office and Nunukan Polantas office
with a total area of 1,435 Ha / 14358,398 m2, with a
percentage of 5.33%.
Figure 6: Map of Office.
3.6 Map of the Mess
Mes area consists of PT. Inhutani, Immigration and
Police with a total area of 1,830 Ha/ 18292,675 m2,
with a percentage of 6.796%.
Figure 7: Map of the Mess.
3.7 Map of the Market
Figure 8: Map of the Market.
iCAST-ES 2022 - International Conference on Applied Science and Technology on Engineering Science
134
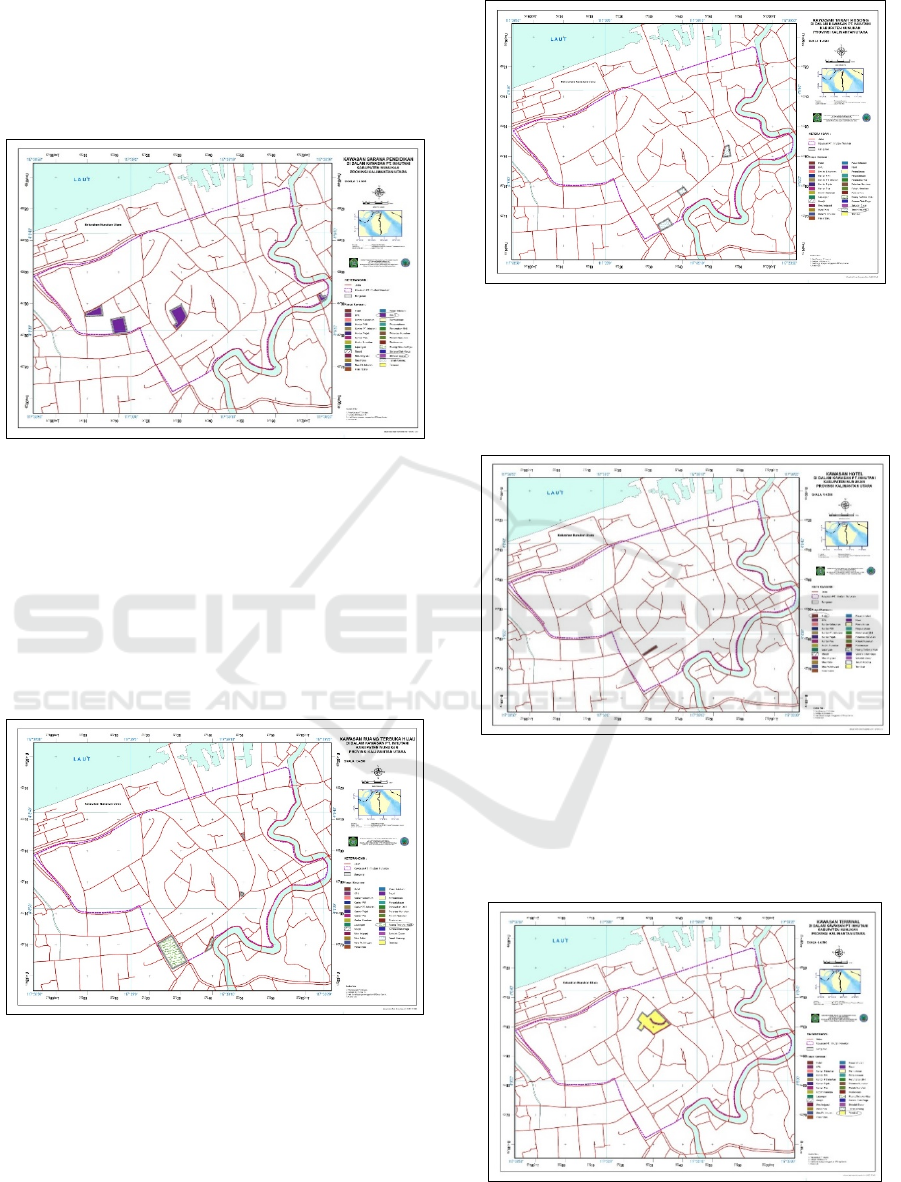
The market area consists of the Inhutani market and
the new market, with a total area of 0.832 Ha/
8321.291 m2, with a percentage of 3.090%.
3.8 Map of Educational Facilities
Figure 9: Map of Educational Facilities.
The area of educational facilities consists of
elementary schools and early childhood education
with a total area of 0.576 ha/ 5768.262 m2, with a
percentage of 2.139%.
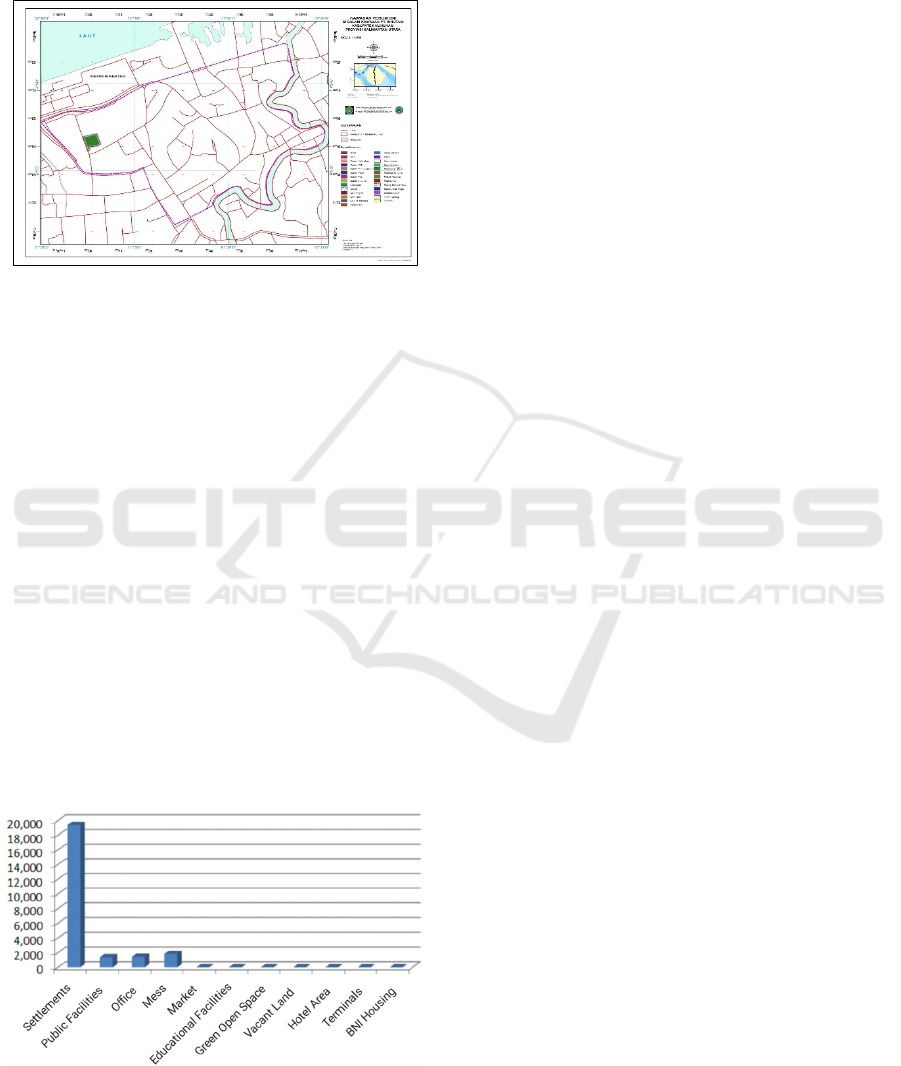
3.9 Map of Green Open Space Area
Green open space area with a total area of 0.540 Ha /
5394.313 m2, with a percentage of 2.005%.
Figure 10: Map of Green Open Space Area.
3.10 Vacant Land Map
Empty land with a total area of 0.214 Ha/2142.659
m2, with a percentage of 0.008%.
Figure 11: Vacant Land Map.
3.11 Hotel Area Map
Hotel area land with a total area of 0.045 Ha/ 454.431
m2, with a percentage of 0.167%.
Figure 12: Hotel area map.
3.12 Terminal Map
Terminal area land with a total area of 0.499 Ha /
4990,441 m2, with a percentage of 1.85%.
Figure 13: Terminal Map.
Mapping Area Analysis Using ArcGIS and AutoCad: Cast in Border Area
135
3.13 BNI Residential Area Map
BNI's public housing area has a total area of 0.190
Ha/ 1896,766 m2, with a percentage of 0.71%.
Figure 14: BNI Residential Area map.
4 CONCLUSIONS
The results of the measuring and mapping showed
that the area of the settlement area is 19.393 Ha, the
area of green open space is 0.540 Ha or equal
5394.313 m2.
It is mesuared that hotel area is 0.145 Ha or equal
454.431 m2, and the office area is 1.435 Ha or equal
14358,398 m2. It is also mapped that the area of
public and social facilities is 1,375 Ha or equal
13738,705 m2, mess area 1,830 Ha or equal
18292,675 m2, and education facilities area 0.465 Ha
or equal 4653.861 m2. It is identified that market area
0.832 Ha or equal 8321.291 m2, terminal area 0.499
Ha or equal 4990, 441 m2, while vacant land area
0.214 Ha or equal 2142.659 m2.
Lastly it is also identified that BNI housing area
0.190 Haor equal 1896,766 m2. Then the total area =
26,929 Ha or equal 269259,159 m2.
Figure 15: Land Area Diagram.
When compared with North Nunukan Village
which covers an area of 48.72 Ha, then 55.27%, the
area of when compared with North Nunukan Village
which covers an area of 48.72 Ha, then 55.27%, the
area of North Nunukan Village which is controlled by
PT. Inhutani Nunukan.
ACKNOWLEDGEMENTS
In completing this research, many obstacles were
encountered, but the support of many parties who
have provided assistance in this research so that we
can finish it well.
Therefore, we would like to thank all parties who
have been willing to cooperate during this research.
In particular, we would like to thank the Director of
the Nunukan State Polytechnic who has always
supported us in completing this research.
We would also like to thank our family and
friends who have always supported us in completing
this research.
REFERENCES
Vini Indriasari, S. T. (2021). Scripting untuk ArcGIS
dengan Python dan ArcPy. Deepublish.
Sudarsono, D. Bambang (2020) Menggambar 3 Dimensi
secara mudah dan cepat dengan Autocad Land
Development: Yogyakarta
Basuki, Slamet (2020) Ilmu Ukur Tanah. UGM Pers.
Yogyakarta
Omura, george: Brian C. Benton (2017) Mastering Autocad
2019 and AutoCad LT 2019 (2017). Sybex.
Wahana, Komputr (2015) Menguasai ArcGIS 10 untuk
Pemula.Penerbit Andi: Yogyakarta
Abdi, M Zainal (2014) Autocad Untuk Teknik, Modula:
Bandung
Peraturan Daerah Nomor 19 (2013) Tentang Rencana Tata
Ruang Wilayah Kabupaten Nunukan. (DPUPRPKP):
Nunukan.
Prasetyo, Arif (2011) Modul Dasar ArcGIS 10 Aplikasi
Pengelolaan Sumberdaya Alam: Bogor.
Sastra M, Suparno (2006) Desain Profesional dengan
Autocad 2006 2D dan 3D: Yogyakarta.
Darmadji, Agus (2005) Pemetaan Digital dan Rekayasa
Teknik Sipil. ITB: Bandung.
iCAST-ES 2022 - International Conference on Applied Science and Technology on Engineering Science
136
