
The Export Patterns of the Chinese Office Equipment Manufacturing
Industry Using Trade Data of 1984-2019
Yu Hong
1
, Na Li
1
, Lin Zhang
1
and Ting Liu
2
1
College of International Economics and Trade, Jilin University of Economy and Finance, Changchun, China
2
Changchun Humanities and Sciences College, Changchun, China
Keywords: China, Office Equipment Product, Export Patterns.
Abstract: This paper used annual trade data of China's office equipment from 1984 to 2019, and analyzed the export
pattern of office equipment. RSCAX index is used to analyze the comparative advantage of China's office
equipment export, NX index is used to judge the net export ratio of office equipment, and HX index is used
to judge the government intervention of China's office equipment industry. The study found that the
comparative advantage of China's office equipment remained roughly balanced during the sample period,
while the government imposed import restrictions. Although it maintains a trade surplus, its international
competitiveness is still weak.
1 INTRODUCTION
High-tech products as the government's key support
industry more and more attention, office equipment
as one of the gradually into people's life, its trade
status is also gradually improved. The proportion of
China's office equipment in the world's exports has
amounted to 35% of the world's total exports in the
product with large trade surplus.
China has claimed that the Chinese trade policies
are against trade protectionism. The trade surplus,
however, may indicate that China has adopted trade
promotion or import restriction policies in the office
equipment products which are opposite to the free
trade. This paper analyzes the trade pattern of office
equipment in China during the 1984-2019 to explore
the Chinese trade policy in the product. The marginal
contribution this study attempts to make is to reassess
the protectionist supporting trade policy in the
Chinese office equipment manufacturing industry.
2 METHODS AND MATERIALS
2.1 Revealed Comparative Advantage
Balassa (1965) proposed the index of revealed
comparative advantage to measure the comparative
advantage of import and export products (Balassa,
1965):
RCAX
co
=(X
co
/X
c
)/(X
wo
/X
w
) (1)
where X represents exports, the subscript of C
indicates China and that of O is for the office
equipment, X
wo
means the global office equipment
exports. RCAX
co
>1 means that China has
comparative advantage in specializing in the office
equipment than the world average; RCA
co
<1mens
the opposite. The value range of RCA
co
is [0, ∞] with
uncertain mean and the distribution is asymmetric
(Hinloopen, 2001).
This study used the logarithmic transformation as
proposed by Dalum, Laursen and Villumsen (1998)
(Dalum, 1998) to obtain the indicator of revealed
symmetric comparative advantage
RX
co
=RSCAX
co
=(RCAX
co
-1)/(RCAX
co
+1) (2)
The range of RX
co
is [-1,1] and distributed around
the mean of 0. RCA
co
>1 generates RX
co
>0 and
denotes comparative advantage; RCA
co
<1
corresponds to RX
co
<0 and shows comparative
disadvantage. RCA
co
=1 exactly implies RX
co
=0,
meaning the specialization is identical to the world
average.
2.2 Net Export Ratio
This research uses the indicator of net export ratio or
126
Hong, Y., Li, N., Zhang, L. and Liu, T.
The Export Patterns of the Chinese Office Equipment Manufacturing Industry Using Trade Data of 1984-2019.
DOI: 10.5220/0011731500003607
In Proceedings of the 1st International Conference on Public Management, Digital Economy and Internet Technology (ICPDI 2022), pages 126-130
ISBN: 978-989-758-620-0
Copyright
c
2023 by SCITEPRESS – Science and Technology Publications, Lda. Under CC license (CC BY-NC-ND 4.0)
NX
co
=(X
co
-M
co
)/(X
co
+M
co
) (3)
as a benchmark. The range is [-1, 1], and its average
value is 0. NX
co
> 0 implies trade surplus and NX
co
<0
suggests trade deficit. NX
co
=0 means the import is
equal to the export.
2.3 Policy Intervention Index
Under free trade, a country should specialize in and
export the products with comparative advantage and
import those with comparative disadvantage (Lall,
2000; Boone, 2000). RSCA
co
is equal to NX
co
or
RSCA
co
=NX
co
(4)
as the sufficient condition for free trade condition
(Morrow, 2010; Pang, 2010; Hong, Guan, Su, 2012;
Hong, Chen, Yang, 2019). The difference between
NX
co
and RSCA
co
can be understood as the indicator
of policy intervention in export or
HX
co
=NX
co
-RSCAX
co
(5)
The indicator of HX
co
measures the disparity
between net export ability and comparative
advantage in export. Under perfect free trade there
must be HX
co
=0. HX
co
>0 means that the country has
adopted export promotion trade policies, while
HX
co
<0 implies the case of export restriction (Hong,
Yang, Hu, Su, 2019; Hong, Guan, Su, 2013; Hong,
Zhang, Hu, Shi, 2019; Chen, Yu, Hu, Hong, 2019).
HX
co
reflects whether China's net export capacity is
higher or lower than its comparative advantage when
it shows a certain comparative advantage in the
import of products. If the trade pattern is in
equilibrium, there should be HX
co
=0. If HX
co
> 0, then
the net export ratio is greater than the import,
indicating that China has adopted a trade policy to
increase the net export ratio of office equipment by
restricting the import. If HX
co
<0, it means that the
import trade policy adopted by China is not
restrictive, but has the feature of encouraging import
(Hong, Song, Wang, Su, 2014; Hong, Yang, Hu, Shi,
2020; Hong, Chen, Yang, Hu, Ma, 2019; Hong, Yu,
Yang, Hu, Ma, 2020; Hong, Hong, 2016).
2.4 Data Curation
We obtained the annual trade data of 1984-2019 from
UN Comtrade database under the first edition
classification of Standard International Trade (SITC
Rev.1). According to the classification of Revision
one (SITC Rev.1), we found the three-digit code of
714 is for the office equipment. SITC Rev.1 was
employed because of its long sample period (Hong,
Wang, Su, Mu, 2014; Shi, Yang, Hu, Hong, 2019;
Hong, Yu, Yang, Hu, Ma, 2020; Ma, Yang, Yu, Hu,
Hong, 2020; Hong, Zhang, Hu, Ma, 2020).
The 2020 trade data of China and the world can
be available in the later 2021, and some UN member
countries may postpone to report the data. This fact
makes the latest data this current research can obtain
is by the year of 2019.
3 RESULTS AND DISCUSSION
3.1
The Evolution of The Chinese
Trade Patterns
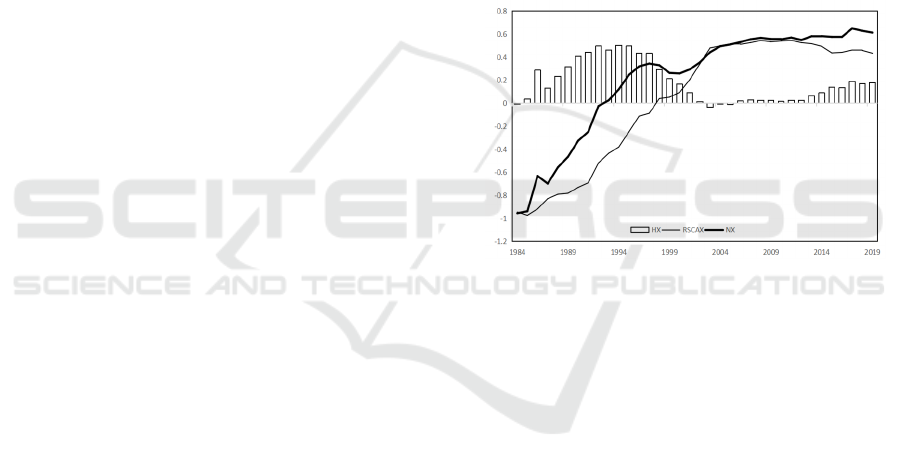
Figure 1 shows the time paths of RSCAX
co
, HX
co
and
NX
co
in China's office equipment export during the
sample period.
Figure 1: Time paths of the Chinese export patterns in the
office equipment (1984-2019).
Firstly, RSCAX
co
showed a downward trend
before 1997, and the index has always been negative.
After 1997, the index turned from negative to
positive and showed an upward trend and gradually
slowed down. After 2014, the index showed a slight
downward trend, but the overall trend was always
positive. The overall trend shows that China's export
of office equipment has turned from a comparative
disadvantage to an advantage and has been
maintained until now.
Secondly, HX
co
basically remained stable during
the sample period. In the 1990s, the value of HX
co
was at its peak. Although the current index has
always been positive, it has not exceeded the
previous value. Except for the negative values from
2003 to 2005, the value of NX
co
in the other years
were basically positive, which means that the
Chinese government's export policy for office
equipment has been mainly to promote export. But
the intensity of the policy has slowed considerably in
recent years, suggesting that China is becoming less
The Export Patterns of the Chinese Office Equipment Manufacturing Industry Using Trade Data of 1984-2019
127
dependent on exports, which may be related to its
economic transformation.
What’s more, the NX
co
index is another group of
data that changes significantly. Before 1992, the
curve was in a negative number with NX
co
<0, but it
gradually increased and approached 0. After 1992,
the NX
co
indicator became positive and kept rising.
During 1999-2000, the index showed a downward
trend, but after that, the index still tended to rise and
remained stable gradually. The change of this index
is similar to the change of RSCAX
co
above.
Table 1 further reports the descriptive statistics of
the Chinese export patterns in the office equipment
industry.
Table 1: Descriptive statistics of the Chinese export trade
patterns in the office equipment.
N=36
Minimum Maximum Mean
Standard
Deviation
RX
co
-0.974 0.544 0.020 0.553
HX
co
-0.037 0.501 0.180 0.176
NX
co
-0.957 0.648 0.200 0.480
The results show that the Chinese RSCAX
co
index
reached the minimum value of -0.974 in 1985 and a
maximum value in 2011. The average value is 0.02.
It can be seen from Figure 1 that China's office
equipment has turned from comparative disadvantage
to comparative advantage, with the highest
comparative advantage in 2011 and then gradually
leveling off.
Secondly, HX
co
index reached the lowest in 2003
and the highest in 1994, with an average value of
0.18. This shows that in 1994 China limits the import
of office equipment at the most, while in 2003,
encourages the import of office equipment, but
according to figure 1 we can see that in addition to
special before and after 2003, the rest of the year
China's imports are more restricted for office
equipment, but, in recent years, the limit of strength
is a little reduce than normal.
Finally, the NX
co
index reached its lowest value in
1984 and its highest value in 2017. This indicator
suggests that China is gradually narrowing its trade
deficit in office equipment and encouraging exports
to a trade surplus. The mean value of this indicator
over the sample period was 0.2.
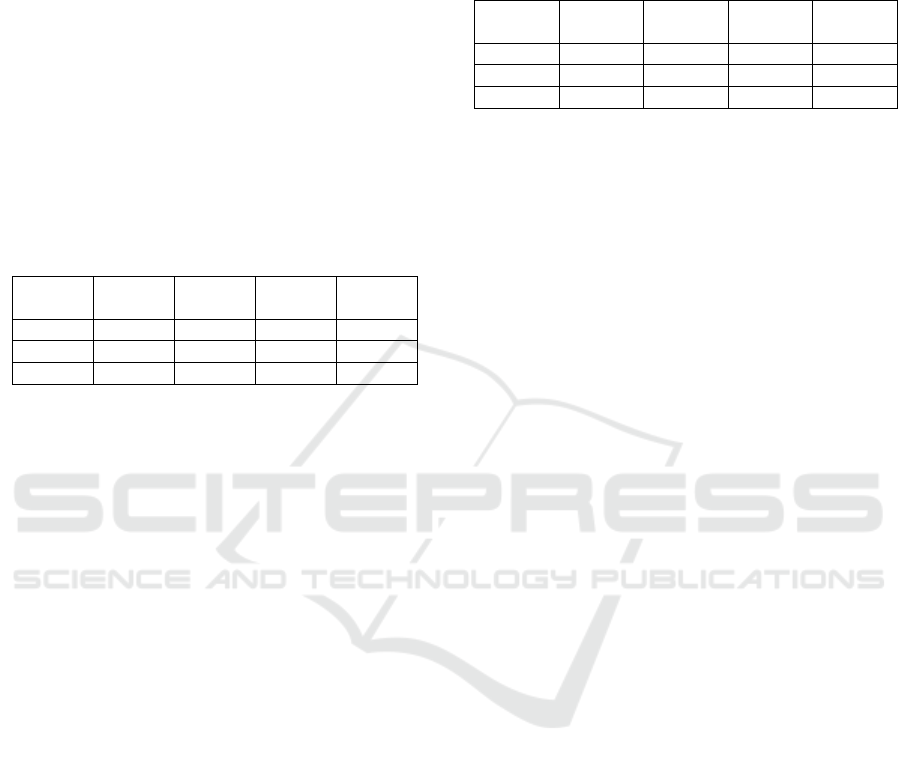
3.2 One Sample T-Test of The Chinese
Export Statistics
Table 2 reports the one-sample t-test results of RX
co
,
NX
co
and HX
co
. The test value is set to zero to test
whether the sample mean is statistically significant
different from 0.
Table 2: One-sample t-test results for the indicators of
RXco, NXco and HXco.
Test
value=0
T-stat
Degree of
freedo
m
Sig.
(2-tailed)
Mean
difference
RX
co
0.216 35 0.830 0.017
NX
co
2.503 35 0.017 0.200
HX
co
6.153 35 0.000 0.180
The t-test results show that the mean of three
indicators are all greater than zero. The significance
of RSCAX
co
is 0.830, being statistically
insignificantly different from 0. This fact shows that
China has no comparative advantage in the export of
office equipment. On the other hand, the indicators of
NX
co
and HX
co
are both positive and significant at
0.05 level, implying that China has gained trade
surplus in the trade of the office equipment by t
export promotion. Note that China has no significant
comparative advantage in this product, our findings
indicate that China has adopted protectionist
industrial policies as other countries have done
(Farzin, 1998; Pierce, 1974; Arita, 2017; Costinot,
2012).
3.3 Discussion
The results that China has been export promoting is
not confined to the office equipment manufacturing
industry. Previous studies found plenty evidence that
the Chinese government has deliberately promoted
the export in most products in the trade of goods such
as the primary products (Hong, Dong, Mu, 2018),
agricultural products (Hong, Su, 2010; Hong, Yin,
Yang, Mu, 2018; Hong, Yin, Ren, Mu, 2018), energy
products (Hong, Su, 2011; Hong, Chen, Yang, Liu),
low-technology products (Hong, Ren, Shao, Mu,
2018; Hong, Ren, Yin, Mu, 2018), as well as the
high-technology products (Hong, Qu, Wang, Liu,
2021; Hong, Zhang, Li, Liu, 2021). The puzzle is that
there are both comparative advantaged and
comparative disadvantaged products or industries.
For the office equipment manufacturing industry,
China has rather been comparative advantaged
although the comparative advantage is insignificant.
Our findings are consistent to the previous
studies. The above mentioned studies imply that the
Chinese trade promotion policy intervention has not
mainly target at improving the comparative
advantage of the products or the industries.
Comparative advantage of a product or an industry
can largely reveal the technology besides the factor
ICPDI 2022 - International Conference on Public Management, Digital Economy and Internet Technology
128

endowment of labor and capital. The evolution of the
degree of the comparative advantage can be also
understood as the changes in a country’s independent
R&D ability, which may be crucial to the long-term
development of the office equipment manufacturing
industry.
The Chinese government may promote the export
in the office equipment products to support the
industry in afraid of losing its tiny comparative
advantage, or the main purpose has been the trade
surplus which can facilitate the Chinese employment
and help to improve the Chinese economic growth.
This does not necessarily mean that the Chinese
export promotion has not been interactively
connected to the comparative advantage in the office
equipment industry. The nexus, however, need to be
explored by further econometric analysis instead of
mere observation and guess.
4 CONCLUSIONS
This paper analyzed the revealed symmetric
comparative advantage (RX), the net export ratio
(NX) as well as the indicator of policy intervention
index (HX) of the Chinese trade in the office
equipment products by using the annual trade data
from the year of 1984 to 2019.
We documented that China has not been
significantly comparative advantaged in the export of
the office equipment but the trade surplus is
significant (p=0.017), which reflects that China has
deliberately promote the export of the product. This
can be explained by the Chinese relatively poor
independent R&D ability, which has made the
country to be specialized in the low-end of the
industrial chain. This study argues that China has
adopted protectionist export promotion policies in the
export of office equipment.
The effects of the trade (export) policy
intervention upon the Chinese comparative
advantage in the product, however, requires further
econometric analysis in order to provide the
empirical evidence. What is more, this study focused
on the export patterns of the Chinese office
equipment products. The policy intervention that
revealed in the Chinese import patterns requires
another independent study instead of the simple
assumption.
ACKNOWLEDGEMENTS
This work was financially supported by Jilin
Provincial Social Science Fund (2020J58, 2020J60)
and Changchun Social Science Fund (CSK2020ZYJ-
001) and the College Poverty Stricken Students
Supporting Programme funded by Jilin Provincial
Ecological Industry Company Limited.
REFERENCES
A. Costinot, D. Donaldson, I. Komunjer, “What goods do
countries trade? a quantitative exploration of ricardo's
ideas,” Rev. Econ. Stud., vol. 79 (2), 2012, pp. 581-
608.
B. Balassa, “Trade liberalisation and "revealed"
comparative advantage 1,” Manchester Sch., vol. 33
(2), 1965, pp. 99-123.
B. Dalum, K. Laursen, G. Villumsen, “Structural change
in OECD export specialisation patterns: de-
specialisation and 'stickiness',” Int. Rev. Appl. Econ.,
vol. 12 (3), 1998, pp. 423-443.
C. J. Chen, K. X. Yu, A. J. Hu, Y. Hong, “How does the
import restriction Granger cause the comparative
advantage of the USA ' s fossil energy imports?,”
Basic Clin. Pharmacol. Toxicol., vol.126 (S4), 2019,
pp. 307.
D. Pang, Y. Hong, “Measuring distortions of trade
patterns: an application to China,” IEEE International
Conference on Service Operations and Logistics and
Informatics (SOLI 2010), 2010, pp. 424-429.
G. Shi, Y. M. Yang, A. J. Hu, Y. Hong, “Assessing the
effectiveness of the import restriction on improving
the Israeli services export comparative advantage,”
Basic Clin. Pharmacol. Toxicol., vol. 126 (S4), 2019,
pp. 342-343.
J. Hinloopen, C. V. Marrewijk, “On the empirical
distribution of the balassa index,” Rev. World Econ.,
vol. 137 (1), 2001, pp. 1-35.
J. Boone, “Competitive pressure: the effects on
investments in product and process innovation,” The
Rand J. Econ., vol. 31 (3), 2000, pp. 549-569.
J. L. Pierce, J. J. Enzler, “The effects of external
inflationary shocks”, Brooking Papers Econ. Activity,
vol. 5 (1), 1974, pp. 13-61.
P. M. Morrow, “Ricardian–Heckscher–Ohlin comparative
advantage: Theory and evidence,” J Int. Econ., vol. 82,
2010, pp. 37-151.
P. Ma, Y. M. Yang, K. X. Yu, A. J. Hu, Y. Hong, “How
have the degree of import restriction impacted Japan's
revealed comparative advantage in the services
exports?,” Basic Clin. Pharmacol. Toxicol., vol. 126
(S1), 2020, pp. 121.
Q. Hong, Y. Hong, “Does Japan limit its imports for
comparative advantage reasons?-the case of
agricultural manufactures,” 2016 3rd International
Conference on Social Science, 2016, pp. 497-501.
The Export Patterns of the Chinese Office Equipment Manufacturing Industry Using Trade Data of 1984-2019
129

S. Arita, J. Beckman, L. Mitchell, “Reducing transatlantic
barriers on U.S.-EU agri-food trade: what are the
possible gains?,” Food Policy, vol. 68 (1), 2017, pp.
233-247.
S. Lall, “The technological structure and performance of
developing country manufactured exports, 1985–98,”
Oxford Development Stud., vol. 28 (3), 2000, pp. 337-
369.
Y. Hong, J. Guan, H. Su, “Can export facilitation improve
Chinese comparative advantage? panel Granger
causality tests using data of 1982-2011 trade in
services,” Adv. Inform. Sci. Serv. Sci., vol. 4 (19),
2012, pp. 296-303.
Y. Hong, C. J. Chen, Y. M. Yang, A. J. Hu, “Granger
causality between Korea's net export and the
comparative advantage in the exports of electro
medical and x- ray apparatus,” Basic Clin. Pharmacol.
Toxicol., vol. 126 (S4), 2019, pp. 52.
Y. Hong, Y. M. Yang, A. J. Hu, H. W. Su, “Exploring
Granger non-causality of the Japanese employment
rate and the trade in services,” Adv. Soc. Sci. Edu.
Hum. Res, vol. 357, 2019, pp. 140-144.
Y. Hong, J. Guan, H. Su, “How does chinese trade pattern
in goods diverge from equilibrium? an empirical
examination using data of 1987-2011,” Adv. Inform.
Sci. Serv. Sci., vol. 5 (2), 2013, pp. 352-360.
Y. Hong, X. Y. Zhang, A. J. Hu, G. Shi, “The export
promotion and the comparative advantage in Israel's
trade of the primary agricultural products,” Basic Clin.
Pharmacol. Toxicol., vol. 126 (S4), 2019, pp. 307-308.
Y. Hong, Z. Song, J. Y. Wang, H. W. Su, “Comparative
advantage of food exports, rural-urban income
disparity and agricultural employment: empirical
evidence from China,” Pharm. Res., vol. 6 (1), 2014,
pp. 439-445.
Y. Hong, M. X. Yang, A. J. Hu, G. Shi, “Examining
Granger causal relationship between the USA's export
promotion and comparative advantage of
telecommunication products using a more
sophisticated weighting,” Basic Clin. Pharmacol.
Toxicol., vol. 126 (S4), 2020, pp. 317-318.
Y. Hong, C. J. Chen, Y. M. Yang, A. J. Hu, P. Ma,
“Granger causality between Korea's net export and the
comparative advantage in the exports of electro
medical and x- ray apparatus,” Basic Clin. Pharmacol.
Toxicol., vol. 126 (S4), 2019, pp. 48.
Y. Hong, K. X. Yu, Y. M. Yang, A. J. Hu, P. Ma, “The
United States’ export promotion and comparative
advantage in the trade of medicinal and
pharmaceutical products: 1962-2018,” Basic Clin.
Pharmacol. Toxicol, vol. 126 (S4), 2020, pp. 56-56.
Y. Hong, J. Wang, H. Su, X. Mu, “Panel cointegration
analysis of export facilitation and comparative
advantages: the case of Chinese low-technology
manufactures,” Bio Technology: an Indian J., vol. 10
2014, pp. 6040-6048.
Y. Hong, K. X. Yu, Y. M. Yang, A. J. Hu, P. Ma,
“Exploring Granger causality of China's policies of
export promotion and import restriction in the
medicinal and pharmaceutical products,” Basic Clin.
Pharmacol. Toxicol., vol. 126(S4), 2020, pp. 61-62.
Y. Hong, X. Y. Zhang, A. J. Hu, P. Ma, “Econometric
znalysis of the Israeli Trade protectionism and the
export comparative advantage of the primary
agricultural products,” Basic Clin. Pharmacol.
Toxicol., vol.126 (S4), 2020, pp. 305-306.
Y. H. Farzin, K. J. M. Huisman, P. M. Kort, “Optimal
timing of technology adoption,” J. Econ. Dynamics
Control, vol. 22, 1998, pp. 779-799.
Y. Hong, W. J. Dong, X. W. Mu, “The distortion of the
trade patterns in the U.S. primary products,” DEStech
Transactions on Social Science Education and Human
Science, (March), 2018,
doi:10.12783/dtssehs/icems2018/20187.
Y. Hong, H.W. Su, “Can strategic trade policies improve
comparative advantages of exports? a heterogeneous
panel analysis of Chinese agro based manufactures,”
Proceedings of 2010 International Colloquium on
Computing, Communication, Control, and
Management (CCCM2010), 2010, pp. 652-655.
Y. Hong, Z. M. Yin, Y. M. Yang, X. W. Mu, “Assessing
the trade policy of the U.S. agro-Imports,” 2018
International Conference on Mathematics, Modeling,
Simulation and Statistics Application (MMSSA2018),
2018, pp. 155-158.
Y. Hong, Z. M. Yin, S. S. Ren, X. W. Mu, “How far are
the U.S. agro-imports distorted away from free
trade?,” 2018 5th ERMI International Conference on
Art, Education and Social Sciences (ERMI-AES
2018), 2018, pp. 470-475.
Y. Hong, H. W. Su, “Tight energy supply constraints and
technological progress,” Energy Procedia, vol.11,
2011, pp. 3151-3156.
Y. Hong, C. J. Chen, D. Yang, T. Liu. “Short-run and
long-run Granger causality analysis of the United
Kingdom’s trade patterns in the fossil energy trade,”
IOP Conference Series 702 012008, doi:10.1088/1755-
1315/702/1/012008.
Y. Hong, S.S. Ren, B. N. Shao, X.W. Mu. “A
comparative analysis on the export and import trade
patterns of the Chinese low-technology manufactures,”
2018 3rd PIL International Conference on Business,
Social Sciences and Information Science (PIL-BSI
2018), 2018, pp. 78-83.
Y. Hong, S.S. Ren, Z. M. Yin, X. W. Mu, “Exploring the
Chinese import policy on the low-technology
manufactures of garments, textiles and footwear,”
DEStech Transactions on Social Science Education
and Human Science (March) (2018),
doi:10.12783/dtssehs/ichss2017/19555.
Y. Hong, B. B. Qu, Y. Wang, T. Liu, “A comparative
analysis on the import and export trade patterns of
China's mechanical and electrical products,” IOP
Conference Series 1978 (2021) 012064,
doi:10.1088/1742-6596/1978/1/012064.
Y. Hong, L. Zhang, N. Li, T. Liu, “Empirical analysis on
the export trade patterns in the Chinese antibiotic
products,” IOP Conference Series 1978 (2021)
012046, doi:10.1088/1742-6596/1978/1/01204.
ICPDI 2022 - International Conference on Public Management, Digital Economy and Internet Technology
130
