
Does the Export Promotion Improve the Chinese Comparative
Advantage in the Energy Products?
Yu Hong
1
, Chaojie Chen
1
, Dong Yan
1
and Ting Liu
2*
1
College of International Economics and Trade, Jilin University of Economy and Finance, Changchun, China
2
Changchun Humanities and Sciences College, Changchun, China
Keywords: China, Energy Products, Trade, Granger Causality.
Abstract: This research employed the Chinese and the world trade data in energy products during the period of 1985-
2019 to obtain of the weighted index of trade competitiveness (TC) and the indicators symmetric
comparative advantage for Chinese export in the energy products (RX), and then used the differences
between TC and RX to capture China's export promotion in energy products (HX). After preliminary
analyses on the time paths of the indicators, this study made econometric modeling on RX and HX to
empirically examine the short-run and the long-run Granger causal relationship across the two time series.
We concluded that 1) China has adopted export promotion in her energy products; 2) in the short-run, there
is no Granger causal relationship of any direction between the export promotion and the comparative
advantage in Chinese energy export; 3) the long-run equilibrium relationship Granger cause both RX and
HX, while there is no evidence that export promotion Granger causes the Chinese comparative advantage in
the energy products in the long-run. This study documented that the Chinese export policy intervention has
maintained continuity, and the short-run and long-run effects have been much different from the
protectionist predictions of comparative advantage improving.
1 INTRODUCTION
The controversies between protectionist theories and
the free trade theories have lasted for centuries. Trade
protectionist theories represented by the mercantilism
have argued that government should adopt import
restriction or export promotion policies to ensure the
trade surplus and the inflow of gold and silver, which
is a nation's real wealth that can make the country
stronger. Trade policy interventions have been also
advocated by List (1841) (List, 2011), the dynamic
comparative advantage theories (Grossman, 1991)
and Keynesian economics (Keynes, 1997).
Adam Smith proposed the free trade theory of
"absolute advantage" and called for rebellion against
the mercantilist policy interventions (Smith, 1998).
David Ricardo developed the free trade theory by
elaborating the "comparative advantage" or the
"comparative cost". As long as there are differences
in the production costs, every country, even a country
with the "absolute disadvantage" in any product, may
obtain "trade benefits" in the international
specialization and trade if she defers to the principles
of comparative advantage (Ricardo, 2015). To the
free trade theorists, government interventions in both
export promotion and import restriction are
protectionism (Salvatore, 2013), which the school of
free trade has been fighting against.
There is another protectionist policy intervention
in the form of import promotion. This research also
reckons the "import promotion" as trade protectionist
policy intervention, because a government may adopt
the trade policies in this form for various reasons.
This may be true for the Chinese trade in energy
products because China has been a country with
booming domestic energy demand in her fast
economic development during the past decades,
which may have encouraged the Chinese government
to promote the energy import instead of restricting it.
2 METHODOLOGIES AND DATA
2.1 Data Acuration
This research obtained the 3-digit import and export
annual data for the world in the energy products on
168
Hong, Y., Chen, C., Yan, D. and Liu, T.
Does the Export Promotion Improve the Chinese Comparative Advantage in the Energy Products?.
DOI: 10.5220/0011732300003607
In Proceedings of the 1st International Conference on Public Management, Digital Economy and Internet Technology (ICPDI 2022), pages 168-173
ISBN: 978-989-758-620-0
Copyright
c
2023 by SCITEPRESS – Science and Technology Publications, Lda. Under CC license (CC BY-NC-ND 4.0)

September 31
st
, 2020, for the period of 1985-2019,
under the classification of SITC Rev.1 from United
Nation Comtrade database (available from:
https://comtrade.un.org/data/). There are six 3-digit
energy products involved which includes "coal, coke
and briquettes" (code 321), "petroleum, crude and
partly refined" (code 331), "petroleum products"
(code 332), "gas, natural and manufactured" (341),
"electric current" (code 351) and "mineral tar" (code
521) (Chen, 2020). Some countries’ delayed data
reporting to UN Statistics Division makes the data
for 2019 and for the recent years only partially
available. As a result, later accession may generate
slightly different data.
2.2 Indicators for the Trade Patterns
This study employed the indicators of "trade
competitiveness" (TC) and then used the indicator of
export promotion (HX) which is derived from TC
and the indicators of "revealed symmetric
comparative advantage for export" (RX), to examine
the Chinese trade patterns in energy export.
• Trade Competitiveness. The indicator is a
county's trade balance in proportion to the total
import and export value in product k:
TC
ck
= (X
ck
- M
ck
)/ (X
ck
+ M
ck
) (1)
where X stands for export value and M is for the
value of import. The subscript of c indicate that the
reporting country is China and the subscript of k
represents each specific 3-digit energy product. The
value range of TC
ck
is [-1, 1] with a mean of zero.
• Revealed comparative advantage. Balassa
(1965) designed the indicator to measure one
comparative advantage that revealed in the trade of
product k (Balassa, 1965).
RCA
ck
= (X
ck
/ X
wk
)/ (X
c
/ X
w
) (2)
where X
c
is the total trade value of country c and the
subscript of w is for the world. The indicator of
RCA
ck
compares product k's share in country c to
that in the world total export (X
w
). RCA
ck
ranges
from 0 to X
w
/X
c
without a certain upper bound and a
certain mean, preventing the comparing across
different countries, products and other indicators of
trade patterns.
• Revealed symmetric comparative advantage.
Dalum, Laursen and Villumsen (1998) proposed the
indicator of "revealed symmetric comparative
advantage" (RSCA) to address RCA's problems of
uncertain value range and definite mean (Dalum,
1998) by
RX
ck
=RSCA
ck
= (RCA
ck
- 1)/ (RCA
ck
+ 1) (3)
which has the range of [-1, 1] with a mean of zero,
being identical to that of TC
ck
(Hong, 2018; Hong,
2010; Shi, 2019). This study added X to indicate the
"revealed symmetric comparative advantage" is for
the energy export.
• Policy intervention in export. In Ricardian
comparative advantage theory, a country should
specialize in and export the products in which she has
comparative advantage, and import the products in
which the country is dis-comparative advantaged.
The higher degree of comparative advantage in
product k implies country c's more export in the
product and vice versa. Under perfect free trade
environment where there is no any government
policy intervention, the equilibrium of
TC
ck
=RX
ck
(4)
must hold. This deduction facilitates the measuring
of policy intervention in the trade by
HX
ck
=TC
ck
- RX
ck
(5)
where HX
ck
is country c's policy intervention in
product k's export with the value range of [-2, 2].
HX
ck
>0 implies that country c promotes the export
in product k, making the indicator of TC
ck
higher
than the export comparative advantage; HX
ck
<0
means export restriction (Pang, 2010).
• Weighting approaches. Because there are six
3-digit specific energy products, weighting is
necessary to obtain the indicators of the trade
patterns for the product category j. We used the
proportion of country c in the world total export
value of product k, or
w
1
=X
ck
/ X
wk
(6)
to weight RX
ck
because only export is involved here.
The weight for the HX
ck
is
w
2
=(X
ck
+ M
ck
)
/ (X
wk
+ M
wk
) (7)
because both the export and the import are necessary
to obtain the indicator of HX
cj
.
2.3 Econometric Analyses
Different approaches should be employed according
to the generating process of the time series of RX
ck
and HX
ck
in order to avoid any conjecture. This
research performed augmented Dicky-Fuller (ADF)
unit root tests to examine the stationarity of the time
series; we employed the least information criteria of
the vector auto-regression (VAR) models to select
between the linear or non-linear model assumptions
as well as the VAR lag interval; this research made
vector error correction (VEC) models select the
Does the Export Promotion Improve the Chinese Comparative Advantage in the Energy Products?
169

optimal VEC specification and therefore performed
Johansen co-integration test; this research finally
conducted short-run and long-run Granger causality
tests with specific short-run and long-run effects
reported along with the directions of Granger causal
relationship.
• Augmented Dicky-Fuller (ADF) unit root
tests. OLS using non-stationary time series may
cause the problem of spurious regression. This
research conducted ADF unit root tests to determine
the further econometric approaches. The test types of
exogenous assumptions are as follows: 1) "constant
and linear trend"; 2) "constant"; and 3) "none"
according to the principle of decreasing restriction
conditions. The maximum lags are automatically
selected by Schwarz information criterion. The test
proceeded until the ADF statistic is significant at
0.05 level. If none of the tests for the level series
satisfy this condition, the study took first differences
of the series and repeated the above mentioned
procedures. Because the relationship across the
variables may be non-linear, this study took natural
logarithms on the time series plus one to avoid taking
logarithms on negative values (Ma, 2020).
• Fundamental modelling. This research
assumed that when the relationship across the time
series is linear, the fundamental model or the co-
integrating equation is
RX
cj,t
= a
0
+ a
1
HX
cj,t
+ a
2
T + u (8)
where a
0
is the constant, a
1
and a
2
are the coefficients
to be estimated, T is a deterministic time trend, and u
is the disturbing error. When the relationship is non-
linear, the model is assumed to be
ln(RX
cj,t
+ 1)= b
0
+ b
1
ln(HX
cj,t
+ 1) + b
2
T + v (9)
where b
0
is the constant, b
1
and b
2
are the coefficients
to be estimated and v is the disturbing error. The
specific co-integrating equation was determined by
Johansen co-integration tests.
• Selection for the linear or non-linear
assumptions. This research made linear and non-
linear VAR models and selected the VAR lag
interval 1 to "L" by the information criteria of FPE
(Final prediction error), AIC (Akaike information
criterion), SC (Schwarz information criterion) and
HQ (Hannan-Quinn information criterion). The
criteria for linear and non-linear assumptions are
compared at the same time to select the optimal
model assumption.
• Specification for the vector error correction
(VEC) models and Johansen co-integration tests.
This study made VEC models and summarized
Johansen co-integration test results of all the possible
five specifications with the optimal VEC lag interval
of 1 to L-1, and selected the optimal VEC
specification by the five information criteria of FPE,
AIC, SC and HQ.
• Short-run Granger causality tests. Granger
(1963) assumed that the cause precedes the effect and
the future does not cause the past. This study
employed block exogeneity Wald tests based on the
optimal VEC models to examine the short-run
Granger causal causality between RX
cj
and HX
cj
if
the assumption is linear, and between ln(RX
cj,t
+1)
and ln(HX
cj,t
+1) if it is non-linear. The specific
values for short-run effect(s) were measured by
aggregating the coefficients of the corresponding
VAR lags.
• Long-run Granger causality tests. This study
used Wald F tests to explore long-run Granger
causality for the error correction term of VEC models
as well as the individual independent variables. The
specific value(s) of the long-run effect of the separate
independent series upon the dependent series is (are)
captured by the convergence value(s) of the
corresponding generalized impulse-response
functions if the Granger causality is statistically
significant (Hong, 2014).
3 RESULTS
3.1 ADF Unit Root Test Results
Table 1 reports the results for ADF unit root tests.
Only the time series of RX
cj
has a unit root, while the
first differences of all series are stationary. This facts
imply that we can make VEC models for further
econometric analyses.
Table 1: ADF unit test results.
Variable Test type ADF Prob. Variable Test type ADF Prob.
RX
c
j
,t
NN0 -0.383 0.539 ΔRX
c
j
,t
NN0 -5.562 0.000
HX
c
j
,
t
NN3 -4.829 0.000 ΔHX
c
j
,t
CN2 -6.427 0.000
ln (RX
c
j
,t
+1) CN7 -3.815 0.031 Δln (RX
c
j
,t
+1) NN0 -5.164 0.000
ln (HX
c
j
,t
+1) NN3 -4.423 0.000 Δln (HX
c
j
,t
+1) CN2 -6.613 0.000
a: "C, T, p" stands for "constant", "trend" and the "lag length".
b. The symbol of "N" is used when there is no a constant or a time trend.
ICPDI 2022 - International Conference on Public Management, Digital Economy and Internet Technology
170
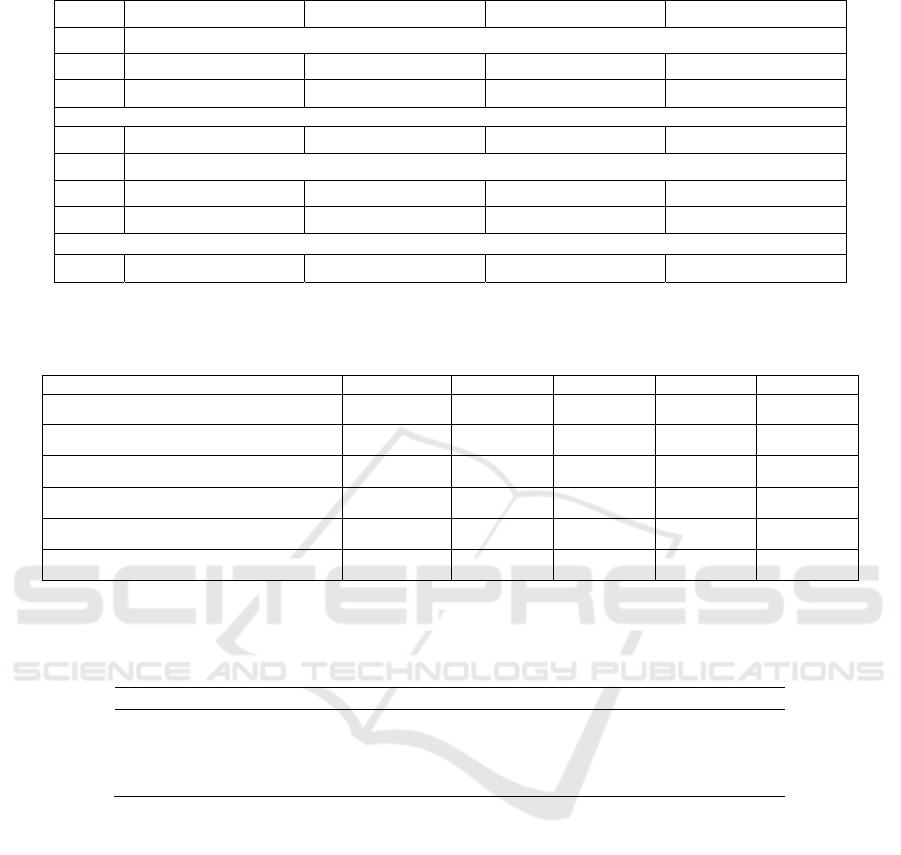
Table 2: Linear/non-linear model selection.
lag FPE AIC SC HQ
Linear Model Assumption
1 NA 0.000 -3.088 -2.993
2 56.215 0.000 -5.051 -4.766
*
……
5 22.750
*
1.49e-05
*
-5.484
*
-4.628
Non-linear Model Assumption
1 NA 0.000 -2.317 -2.222
2 59.624 0.000 -4.417 -4.131
*
……
5 22.602
*
2.89e-05
*
-4.824
*
-3.968
a. The maximum VAR lag is 7 that is about one fifth of the sample period.
b. * indicates lag order selected by the criterion.
Table 3: VEC model specification results.
Information Criteria Model 1 Model 2 Model 3 Model 4 Model 5
Determinant resid covariance (dof adj.) 0.000
*
0.000 0.000 0.000 0.000
Determinant resid covariance 0.000 0.000 0.000 0.000 0.000
*
Log likelihood 82.685
*
82.730 82.760 83.128 84.181
Akaike information criterion -4.179
*
-4.115 -4.051 -4.009 -4.012
Schwarz criterion -3.245
*
-3.135 -3.023 -2.934 -2.891
Number of coefficients 20 21 22 23 24
Model 1 assumes "no intercept or deterministic trend in CE (co-integrating equation)"; model 2 assumes "intercept (no deterministic
trend) in CE"; model 3 assumes "intercept (no deterministic trend) in CE"; model 4 assumes "intercept and trend in CE"; model 5
assumes "quadralic deterministic trend"; * indicates the model assumption selected by each individual information criterion
Table 4: Summary of The Johansen Co-Integration Test Results.
Data Trend: None None Linea
r
Linea
r
Quadratic
Test Type No Intercept Intercept Intercept Intercept Intercept
No Trend No Trend No Trend Trend Trend
Trace 1 0 0 0 0
Max-Eig 1 0 0 0 0
3.2 Linear or Non-Linear Model
Selection Results
Table 2 provides the results of the VAR lag intervals
for linear/non-linear model assumptions.
Both assumptions have the VAR lag interval of 1-
5, and the optimal linear VEC lag interval is 1-4.
3.3 VEC Model Specification Results
Table 3 reports the statistics for the information
criteria for all the five possible linear VEC models.
Both SC and AIC criterion selected "model 1".
Only "determinant resid covariance" selected "model
5" but the "determinant resid covariance (dof adj.)"
also selected "model 5". This research determined
that "model 1" is the optimal VEC model
specification, which has no exogenous variable.
3.4 Johansen Co-Integration Test
Results
Table 4 summarizes all 5 sets of assumptions a 0.05
level.
3.5 Short-Run Granger Causality Test
Results
Table 5 reports the short-run Granger causality test or
block exogeneity Wald test results. No statistically
significant Granger causal relationship of any
direction was found.
Does the Export Promotion Improve the Chinese Comparative Advantage in the Energy Products?
171

Table 5: Short-Run Granger Causality Test Results
Variable
ΔHX
c
j
ΔRXcj
Chi-sq Prob. SE Chi-sq Prob. SE
ΔHX
c
j
,t
——
——
——
3.243 0.519
——
ΔRX
c
j
,t
3.609 0.462
——
——
——
——
Note: In the brackets are the probabilities of Chi-sq statistics of short-run Granger causality tests; SE refers to short-run effect which is (are) provided only when the Chi-sq statistics are
statistically significant at 0.1 level.
Table 6: Long-Run Granger Causality Test Results.
Variable
ΔHX
c
j
,t
ΔRX
c
j
,t
F-stat df Prob. LE F-stat df Prob. LE
ECT
t
-1
6.142 (1, 21) 0.022
——
6.142 (1, 21) 0.022
——
ECT
t
-1
, ΔHX
c
j
,t
-1
, ΔHX
c
j
,t
-2
, ΔHX
c
j
,t
-3
, ΔHX
c
j
,t
-4
7.541 (5, 21) 0.000 0.011 1.036 (5, 21) 0.422
——
ECT
t
-1
, ΔRX
c
j
,t
-1
, ΔRX
c
j
,t
-2
, ΔRX
c
j
,t
-3
, ΔRX
c
j
,t
-4
2.037 (5, 21) 0.115
——
1.765 (5, 21) 0.164
——
Note: LE refers to long-run effect which is (are) provided only when the F-statistics are statistically significant at 0.1 level.
3.6 Long-Run Granger Causality Test
Results
Long-run Granger causality results are reported in
Table 6.
The error correction term (ECT
t-1
) Granger causes
ΔHX
cj
and ΔRX
cj
significantly (p=0.022). This result,
however, can not satisfy the curiosity of how the
change in an independent variable has the impact on
the dependent variables. Only the lags of ΔHX
cj,t
Granger cause ΔHX
cj
itself significantly (p=0.000)
with positive long-run effect (LE=0.011) jointly with
the long-run equilibrium relationship (ETC
t-1
),
implying that the Chinese energy export promotion
has maintained continuity. This research found no
evidence that ΔHX
cj,t
or ΔRX
cj,t
Granger causes each
other in any direction in the long-run.
4 CONCLUSIONS
1) China has had dis-comparative disadvantage in the
energy products since the year of 1990.
2) China has deliberately promoted the export in
the energy products, which is a form of trade
protectionism;
3) The Chinese export promotion effort, however,
has not significantly improved the comparative
advantage in the energy products in either short-run
or long-run;
4) Neither in short-run nor long-run, we found
evidence that the Chinese export policy intervention
has been Granger caused by her comparative
advantage in the energy exports. The trade
protectionist predictions do not hold for the Chinese
trade in energy products;
5) The Chinese energy export promotion has
maintained continuity. An increase in the degree of
the export promotion will cause more future policy
intervention in the form of export promotion.
ACKNOWLEDGEMENTS
This work was financially supported by Jilin
Provincial Social Science Fund (2020J58, 2020J60),
Changchun Social Science Fund (CSK2020ZYJ-
001) and the College Poverty Stricken Students
Supporting Programme funded by Jilin Provincial
Ecological Industry Company Limited.
REFERENCES
A. Smith, “An inquiry into the nature and causes of the
wealth of nations”, Oxford: Oxford World's Classics,
1998 (1776).
B. Balassa, “Trade liberalization and revealed comparative
advantage”, Manchester Sch. 33 (2) (1965) 99-123.
B. Dalum, K. Laursen, G. Villumsen, “Structural change
in OECD export specialisation patterns: de-
specialisation and 'stickiness'”, Int. Rev. Appl. Econ.
12 (3) (1998) 423-443.
C.J. Chen, K.X. Yu, A.J. Hu, Y. Hong, “How does the
import restriction Granger cause the comparative
advantage of the USA's energy imports”, Basic Clin.
Pharmacol. Toxicol. 126 (S4) (2020) 307.
D. Ricardo, “On the principles of political economy and
taxation”, Cambridge: Cambridge University Press,
2015 (1871).
D. Salvatore, “International Economics (11th edition)”,
Hoboken: NJ: John Wiley & Sons, Inc, 2013.
D.L. Pang, Y.Hong, “Measuring distortions of trade
patterns: an application to China”, Proc. 2010 IEEE
Int. Conf. Serv. Oper. Logi. Inform. (2010) 124-429.
F. List, “The National system of political economy”,
Hoboken, NJ: John Wiley & Sons, Inc, 2011 (1841).
G.M. Grossman and E. Helpman, “Quality ladders in the
theory of growth”, Rev. Econ. Stud. 58, (1991) 43-61.
ICPDI 2022 - International Conference on Public Management, Digital Economy and Internet Technology
172

G. Shi, Y.M. Yang, A.J. Hu, Y. Hong, “Israel's export
promotion and comparative advantage in services
export: 2005-2018”, Basic Clin. Pharmacol. Toxicol.
126 (S4) (2019) 342.
J.M. Keynes, “The general theory of employment, interest,
and money”, Amherst, NY: Prometheus Books, 1997
(1936).
P. Ma, Y.M. Yang, K.X. Yu, A.J. Hu, Y Hong, “How
have the degree of import restriction impacted Japan's
revealed comparative advantage in the services
exports?”, Basic Clin. Pharmacol. Toxicol. 126 (S1)
(2020) 121.
Y. Hong, Y.M. Yang, X.W. Mu, “The import patterns of
the Korean agro-manufactures: exploring the short-run
and long-run Granger causal relationship”, Adv. Intel.
Syst. Res. 164 (2018) 109-112.
Y. Hong, H.W. Su, “A test of dynamic comparative
advantage hypothesis using panel data of the Chinese
trade in medium-technology products”, 2010 Int. Conf.
Manage. Sci. Eng. (2010) 1600-1605.
Y. Hong, J.Y. Wang, H.W. Su, X.W. Mu, “Panel
cointegration analysis of export facilitation and
comparative advantages: the case of Chinese low-
technology manufactures”, Biotech. Ind. J. 10 (12)
(2014) 6040-6048.
Does the Export Promotion Improve the Chinese Comparative Advantage in the Energy Products?
173
