
Evaluation of Urban Development Efficiency in Fujian Province
under the Constraint of Unexpected Output Based on Super-SBM
Model and Malmquist Luenberger Index Model
Wei Zhang and Hong Lei
*
School of Business Administration, Jimei University, Xiamen, Fujian, China
Keywords: Urban Development Efficiency, Super-SBM Model, Malmquist-Luenberger Index.
Abstract: The new development concept brings regional economic concern about the urban development efficiency.
This study takes high-quality development transcendence as perspective, evaluates dynamically and statically
the urban development efficiency of nine cities in Fujian Province by using the Super-SBM model of
unexpected output and Malmquist Luenberger index model. The results indicate that the super efficiency level
of urban development in Fujian Province has a high spatial correlation: it decreases from coastal areas to
inland mountainous areas on the whole and decreases from southern Fujian, central Fujian and Fuzhou to
Western Fujian, Northern Fujian and Ningde specially. The main reason for the deterioration of urban
development efficiency is due to the deterioration of TC and the unchanging EC.
1 INTRODUCTION
In the new era, some changes have taken place in
China's regional economic development. Adhering to
improving the quality and efficiency of economic
development and promoting the strategic adjustment
of economic structure is the logic that China’s
economy and society must cross a higher stage of
development. Based on this logic, Fujian Province
unswervingly implements the new development
concept, closely adheres to the theme of high-quality
development, speeds up the construction of a new
development pattern, and makes every effort to
promote higher quality, more efficient, fairer, more
sustainable and safer development. In order to achieve
high-quality development, all cities in Fujian Province
should take the implementation path of strengthening
scientific and technological innovation, deepening
reform and opening up, promoting common
prosperity, accelerating green transformation and
establishing bottom line thinking.
In this context, it is of great practical and
theoretical significance to evaluate the urban
development efficiency of Fujian Province: the urban
development efficiency reflects the high-quality
development of cities. By comparing the urban
development efficiency of Fujian Province, we can
objectively evaluate the urban development of Fujian
Province, so as to promote the high-quality
development of various cities in Fujian in an all-round
way and promote the competition among cities, it
provides a reference for catching up and surpassing.
Fare and Grosskopf (1983) (Fare, 1983)
established a data envelopment analysis model (DEA)
to measure urban total factor productivity, urban
development efficiency and production effectiveness.
Chinese scholars F.Z. Li and H.K. Fu (2016) (Li,
2016) and Chinese Taiwanese scholar Wen et al.
(2016) (Wen, 2016) used different DEA models to
evaluate the efficiency of cities in different regions of
China based on different standards. In the new era,
domestic scholars began to integrate the concept of
high-quality development into the evaluation index
system of urban development efficiency: X.L. Yuan et
al. (2020) (Yuan, 2020) and J.Y. Zhang et al. (2021)
(Zhang, 2021) all took high-quality development as a
research perspective to calculate the urban
development efficiency of different regions in their
respective articles.
To sum up, the theoretical and empirical analysis
results of urban development efficiency have been
relatively rich, but there is no research on urban
development efficiency from the perspective of high-
quality development transcendence. By constructing
the transcendence evaluation system of urban high-
quality development, taking the relevant economic
Zhang, W. and Lei, H.
Evaluation of Urban Development Efficiency in Fujian Province under the Constraint of Unexpected Output Based on Super-SBM Model and Malmquist Luenberger Index Model.
DOI: 10.5220/0011732500003607
In Proceedings of the 1st International Conference on Public Management, Digital Economy and Internet Technology (ICPDI 2022), pages 179-184
ISBN: 978-989-758-620-0
Copyright
c
2023 by SCITEPRESS – Science and Technology Publications, Lda. Under CC license (CC BY-NC-ND 4.0)
179
data of 9 prefecture level cities in Fujian Province
from 2008 to 2019 as the empirical object, using the
Super-SBM model under unexpected output in DEA
and Malmquist-Luenberger index, this paper
calculates the high-quality development level of urban
economy in Fujian Province from static and dynamic
aspects, analyzes the evaluation results.
2 SUPER EFFICIENCY MODEL
OF URBAN DEVELOPMENT IN
FUJIAN PROVINCE
2.1 Super-SBM Model Under
Undesired Output Constraints
In the study of urban development, the traditional
DEA model has limitations. With the implementation
of the new development concept, unexpected outputs
such as pollution emissions have been included in the
efficiency evaluation system. To make up for the
deficiency, Tone proposed the SBM model in 2002
(Tone, 2001), and Tone (2003) (Tone, 2002)
introduced the super efficiency model into the SBM
model to reevaluate the DMU with efficiency value of
1.
Suppose there are n DMUs, consists of M inputs,
t
1
expected outputs and t
2
unexpected outputs. Based
on constant CRS, the expression of Super-SBM model
is as follows:
ρmin
∑
∑
∑
(1)
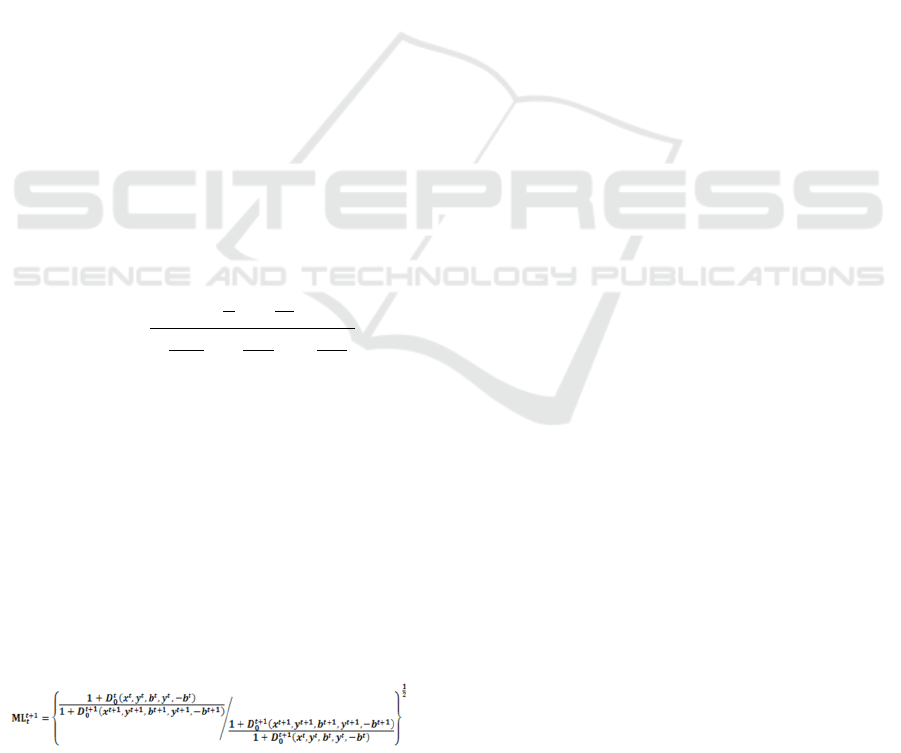
2.2 Malmquist Luenberger Index
Model
The Malmquist Luenberger index model proposed by
Chung (1997) (Chung, 1997) is used to study the
dynamic efficiency of urban development. When ML
index is greater than 1, the urban development
efficiency is improved; When it is equal to 1, the urban
development efficiency remains unchanged; When it
is less than 1, the urban development efficiency
decreases.
The ML index model from t to t + 1 is:
(2)
After decomposition, it can be decomposed into
technical efficiency change (EC)and technological
progress (TC).
𝐌𝐋
𝒕
𝒕𝟏
𝐄𝐂
𝐭
𝐭𝟏
𝐓𝐂
𝐭
𝐭𝟏
(3)
2.3 Index Selection
2.3.1 Input Index
Select urban fixed assets (10,000 yuan) as the capital
investment index. The number of urban employees at
the end of the year (10,000 people) is selected as the
manpower input index. R&D expenditure (10,000
yuan) is selected as the innovation investment index.
The electricity consumption of the whole society (100
million kwh) is selected as the energy input index.
2.3.2 Output Index
1) Expected output: the annual urban real GDP
(10,000 yuan) is selected as the regional GDP index.
The annual number of invention patent applications
(pieces) is selected as the innovation achievement.
2) Undesired output: the number of registered
urban unemployment (persons) is selected as the
unemployment index. Select industry SO
2
emission
(ton) is used as the environmental pollution index.
2.4 Data Sources
The data comes from Fujian statistical yearbook from
2008 to 2019, EPS database and statistical yearbooks
of 9 prefecture level cities and 11 county-level cities
in Fujian.
3 EMPIRICAL ANALYSIS
3.1 Static Analysis of Urban
Development Efficiency Based on
Super-SBM Model
From the mean value (Table 1 and Table 2): except
2008-2010 and 2017-2018, which did not reach DEA
effectiveness (efficiency value is greater than 1), all
other years reached DEA effectiveness; The overall
trend is: it increased from 0.97 in 2008 to 0.99 in 2009,
then decreased to 0.94 in 2010, then increased to 1.10
of the peak in 2014 from 1.03 in 2011, then decreased
to 0.85 of the valley in 2017, and finally increased year
by year to 1.07 in 2019.
It is worth noting that the mean value of super
efficiency decreased greatly from 2016 to 2017, which
was caused by the large unexpected output
(unemployment and environmental pollution) in
Nanping and Longyan in 2017; Then, from 2017 to
ICPDI 2022 - International Conference on Public Management, Digital Economy and Internet Technology
180
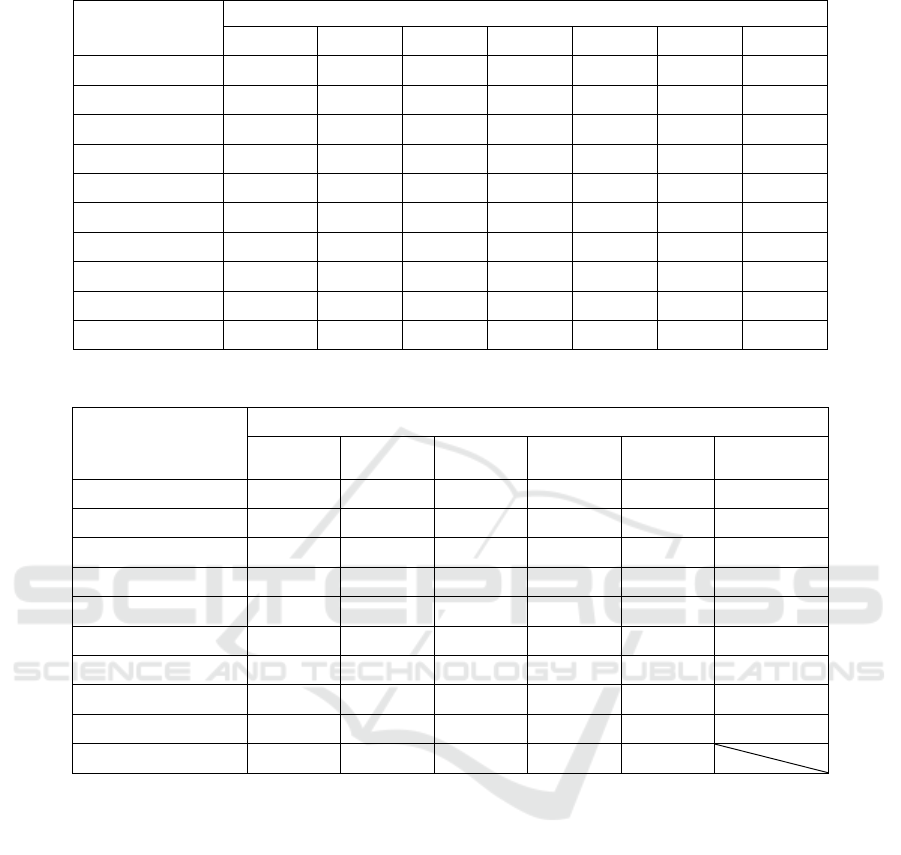
Table 1: Super efficiency of urban development in various cities of Fujian Province from 2008 to 2014.
City Static super efficiency of urban development I
2008 2009 2010 2011 2012 2013 2014
Fuzhou 1.14 1.16 1.20 1.17 1.14 1.10 1.05
Longyan 1.02 1.01 0.74 1.01 1.01 1.02 1.05
Nanping 0.50 0.43 0.41 0.54 0.65 1.01 1.01
Ningde 1.15 1.40 1.18 1.21 1.03 1.06 1.04
Putian 1.08 1.06 1.07 1.08 1.07 1.08 1.10
Quanzhou 1.17 1.17 1.18 1.12 1.12 1.14 1.11
Sanming 0.49 0.45 0.50 0.58 0.57 0.64 1.01
Xiamen 1.12 1.14 1.12 1.51 1.48 1.48 1.47
Zhangzhou 1.03 1.04 1.05 1.05 1.06 1.04 1.03
mean 0.97 0.99 0.94 1.03 1.02 1.06 1.10
Table 2: Super efficiency of urban development in various cities of Fujian Province from 2015 to 2019.
City Static super efficiency of urban development II
2015 2016 2017 2018 2019
mean
(2008-2019)
Fuzhou 1.06 1.09 1.06 1.03 1.02 1.10
Longyan 1.05 1.04 0.21 1.04 1.01 0.93
Nanping 0.62 1.01 0.21 0.25 1.01 0.64
Ningde 1.05 0.44 0.30 0.48 0.54 0.91
Putian 1.07 1.06 1.05 1.02 1.07 1.07
Quanzhou 1.14 1.13 1.04 1.30 1.18 1.15
Sanming 1.03 1.03 1.29 0.37 1.02 0.75
Xiamen 1.45 1.74 1.43 1.74 1.79 1.46
Zhangzhou 1.03 1.03 1.03 1.00 1.03 1.04
mean 1.06 1.06 0.85 0.93 1.07
2019, the average value of super efficiency
increased greatly. Especially since the establishment
of the two coordinated development zones of
Southwest Fujian and northeast Fujian in 2018, high-
efficiency cities such as Xiamen and Fuzhou have
vigorously promoted industrial cooperation and
ecological protection, reducing the unexpected output
of cities such as Nanping and Longyan, thus
improving the overall super efficiency value of Fujian
Province.
Figure 1 reflects the urban development efficiency
level through the color depth according to the average
value of super efficiency. The darker the color, the
higher the development efficiency level. Therefore,
the urban development efficiency level is divided into
five levels: very high level (Xiamen), high level
(Quanzhou, Fuzhou), general level (Zhangzhou,
Putian), low level (Longyan, Ningde) and very low
level (Sanming, Nanping).
In terms of spatial distribution, the mean value of
super efficiency in coastal areas of Fujian is higher
than that in inland mountainous areas; Specifically,
Fuzhou, Southern Fujian (Zhangzhou, Xiamen and
Quanzhou), central Fujian (Putian) (the mean value of
super efficiency is greater than 1) is greater than that
in Western Fujian (Longyan and Sanming), Northern
Fujian (Nanping) and Ningde (the mean value of super
efficiency is less than 1). It can be seen that the super
efficiency level of urban development in Fujian
Province is not randomly distributed, but has a high
spatial correlation: on the whole, it decreases from
coastal areas to inland mountainous areas;
Specifically, the super efficiency value decreases from
southern Fujian, central Fujian and Fuzhou to Western
Fujian, Northern Fujian and Ningde.
Evaluation of Urban Development Efficiency in Fujian Province under the Constraint of Unexpected Output Based on Super-SBM Model
and Malmquist Luenberger Index Model
181
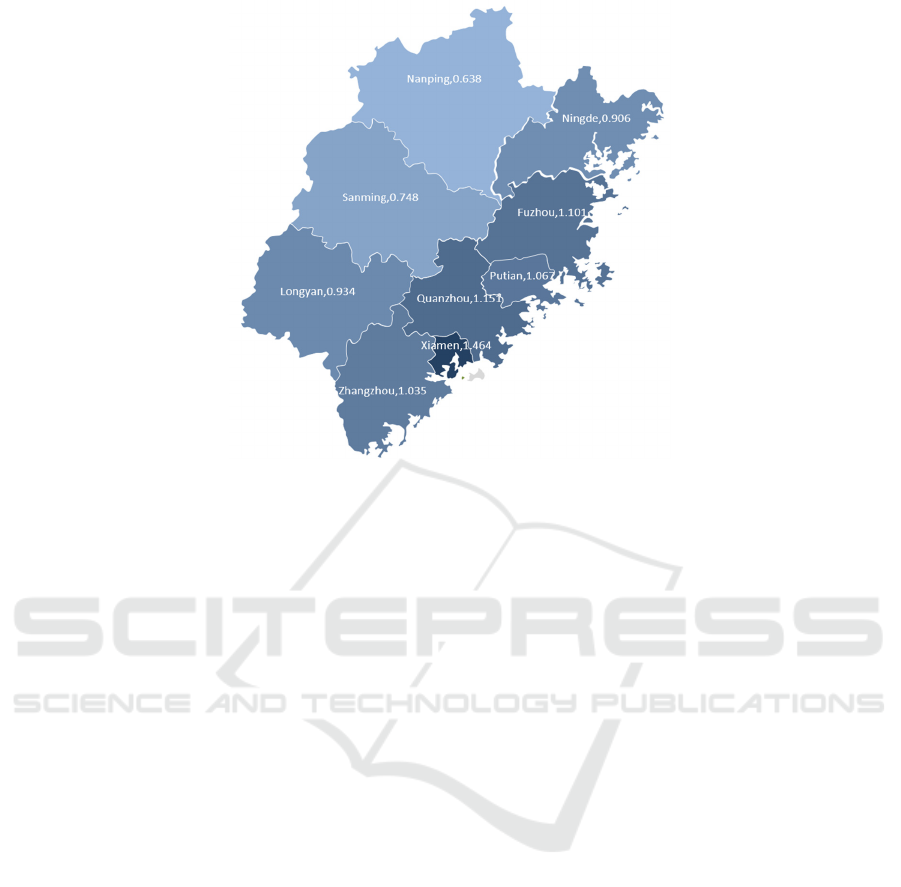
Figure 1: Average value of super efficiency of urban development of cities at all levels in Fujian Province (Jinmen county is
not included in the statistical category).
3.2 Dynamic Analysis of Urban
Development Efficiency Based on
Malmquist Luenberger Index
Limited by space, the panel data of urban development
dynamic efficiency in Fujian Province in 2008-2009,
2012-2013 and 2018-2019 are intercepted to analyze
its ML index and its decomposition:
From 2008 to 2009, the ML of all cities in Fujian
Province was greater than 1, and the urban
development efficiency was improved; Among them,
the EC of Nanping and Sanming is less than 1, and the
TC value is greater than 1. The deterioration of
technical efficiency affects technological progress and
deteriorates urban development efficiency; The EC
Value of other cities is 1, and the TC value is greater
than 1. The improvement of technological progress
plays a major role in the improvement of urban
development efficiency.
From 2012 to 2013, the ML value of Longyan and
Ningde was less than, the EC value was 1, and the TC
value was less than 1. The deterioration of
technological progress led to the deterioration of
urban development efficiency; The ML value of
Sanming is greater than 1, the EC value is greater than
1, and the TC value is less than 1. The deterioration of
technological progress affects the technical efficiency
and improves the urban development efficiency; The
ML value, EC Value and TC value of Nanping are
greater than 1. The improvement of technical
efficiency and technological progress jointly promote
the improvement of urban development efficiency;
The ML value of other cities is greater than 1, the EC
value is 1, and the TC value is greater than 1. The
improvement of technological progress plays a major
role in improving the efficiency of urban
development.
From 2018 to 2019, the ML value of Fuzhou and
Quanzhou is less than 1, the EC value is 1, and the TC
value is less than 1. The deterioration of technological
progress leads to the deterioration of urban
development efficiency; The ML value of Nanping is
less than 1, the EC value is greater than 1, and the TC
value is less than 1. The improvement of technical
efficiency can not make up for the impact of the
deterioration of technical progress, resulting in the
deterioration of urban development efficiency; The
ML value of Ningde is greater than 1, EC value is less
than 1, TC value is greater than 1, the deterioration of
technical efficiency affects technological progress and
improves urban development efficiency; The ML
value of other cities is greater than 1, the EC value is
1, and the TC is greater than 1. The improvement of
technological progress plays a leading role in the
improvement of urban development efficiency.
To sum up, in the selected period, the development
efficiency of most cities has been improved, but there
is a single source of improvement (EC / TC
improvement, TC / EC unchanged), and there is little
phenomenon that technical efficiency and
technological progress jointly promote the
improvement of urban development efficiency; In the
ICPDI 2022 - International Conference on Public Management, Digital Economy and Internet Technology
182
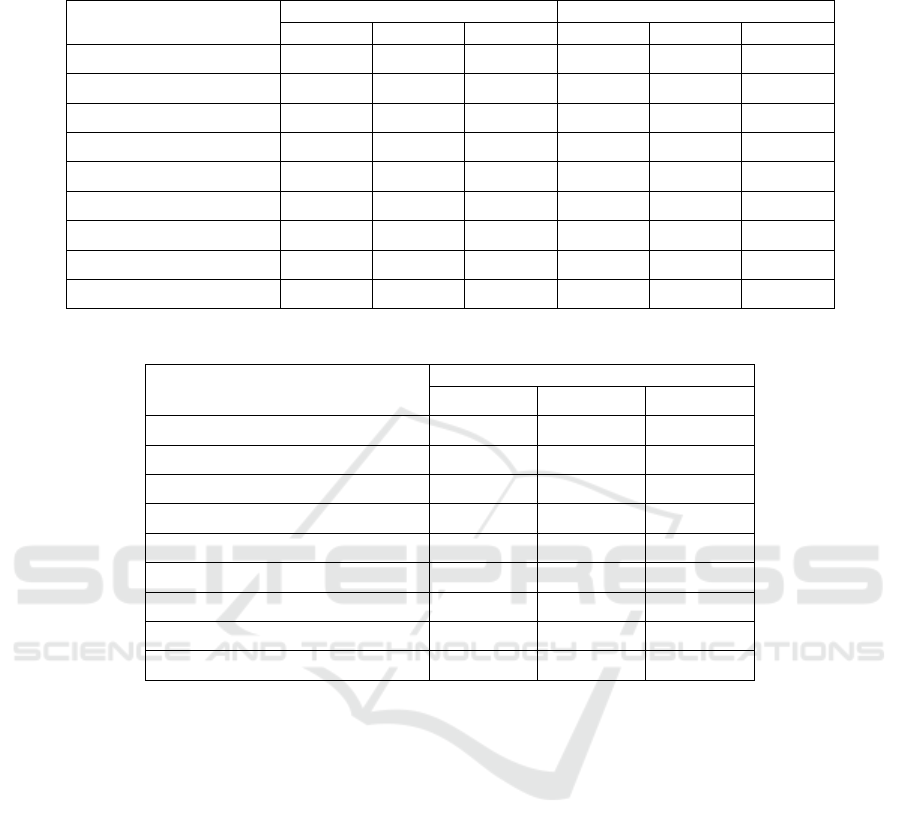
Table 3: ML index and its decomposition of dynamic efficiency change of urban development in Fujian Province (2008-
2009,2012-2013).
City 2008-2009 2012-2013
ML EC TC ML EC TC
Fuzhou 1.17 1.00 1.17 1.01 1.00 1.01
Longyan 1.09 1.00 1.09 0.99 1.00 0.99
Nanping 1.01 0.94 1.07 1.06 1.02 1.04
Ningde 1.52 1.00 1.52 0.96 1.00 0.96
Putian 1.01 1.00 1.01 1.04 1.00 1.04
Quanzhou 1.06 1.00 1.06 1.02 1.00 1.02
Sanming 1.09 0.99 1.11 1.03 1.06 0.98
Xiamen 1.29 1.00 1.29 1.20 1.00 1.20
Zhangzhou 1.11 1.00 1.11 1.01 1.00 1.01
Table 4: ML index and its decomposition of dynamic efficiency change of urban development in Fujian Province (2018-2019).
City 2018-2019
ML EC TC
Fuzhou 0.86 1.00 0.86
Longyan 1.06 1.00 1.06
Nanping 0.99 1.05 0.94
Ningde 1.04 0.95 1.09
Putian 1.13 1.00 1.13
Quanzhou 0.81 1.00 0.81
Sanming 1.01 1.05 0.96
Xiamen 1.13 1.00 1.13
Zhangzhou 1.15 1.00 1.15
case of the deterioration of urban development
efficiency, the deterioration source is basically single
(EC / TC deterioration, TC / EC unchanged or EC /
TC deterioration, TC / EC unchanged). Among them,
TC deterioration and EC unchanged mainly lead to
the deterioration of urban development efficiency.
Efforts to improve technological progress should be
strengthened.
4 CONCLUSION
In order to evaluate the urban development efficiency
in Fujian province, this study constructs the
transcendence evaluation system and takes panel data
of nine prefecture-level cities in Fujian, which uses the
Super-SBM model under unexpected output in DEA
and Malmquist-Luenberger index. This paper
calculates the high-quality development level of urban
economy in Fujian Province from static and dynamic
aspects, analyzes the evaluation results.
From a static perspective, the super efficiency
level of urban development in Fujian Province has a
high spatial correlation: it decreases from coastal areas
to inland mountainous areas on the whole and
decreases from southern Fujian, central Fujian and
Fuzhou to Western Fujian, Northern Fujian and
Ningde specially. Fujian province should strengthen
the cooperation between mountainous and coastal
areas in various fields, and Xiamen, Quanzhou and
Fuzhou should play central cities as a role.
From a dynamic perspective, the main reason for
the deterioration of urban development efficiency is
due to the deterioration of TC and the unchanging EC.
Efforts to improve technological progress should be
strengthened by increasing investment in innovation.
ACKNOWLEDGMENT
1.Project of Xiamen Federation of Social Sciences
(XMSK2021C03)
Evaluation of Urban Development Efficiency in Fujian Province under the Constraint of Unexpected Output Based on Super-SBM Model
and Malmquist Luenberger Index Model
183

2.Project of the National Ethnic Affairs
Commission(2020-GMD-033)
REFERENCES
C.Y. Wen, Y. M. Lee,J. L. Hu.(2016). Urban sustainability
assessment of Taiwan based on data envelopment
analysis [J]. Renewable and Sustainable Energy
Reviews, 61(5):342-352
F.Z Li, H.K. Fu. (2016) Research on the efficiency of
China’s coastal open cities[J]. Business research, (12):
80-87
J.Y.Zhang, X.L.Yuan, J.Wang, D.M. Ma ei.(2021) Urban
efficiency evaluation of the Yellow River Basin from
the perspective of high-quality development[J].
Statistics and decision making, 37 (11): 98-102
K.Tone (2001). A slacks-based measure of efficiency in
data envelopment analysis[J]. European Journal of
Operational Research, 130(3), 498-509.
K.Tone (2002). A slacks-based measure of super-efficiency
in data envelopment analysis[J]. European Journal of
Operational Research, 143(1), 32-41.
R. Färe, S. Grosskopf (1983). Measuring congestion in
production [J]. Ztschrift Für Nationalkonomie, 43(3),
257-271.
X.L.Yuan, J.Wang, J.Y.Zhang.(2020). Urban efficiency
evaluation under high-quality development -- An
Empirical Study from 19 sub provincial and above cities
[J]. Urban development research,27 (06): 62-70
Y.H. Chung; R. Färe; S. Grosskopf (1997). Productivity
and Undesirable Outputs: A Directional Distance
Function Approach [J]. Journal of Environmental
Management. 51(3), 229–240.
ICPDI 2022 - International Conference on Public Management, Digital Economy and Internet Technology
184
