
Empirical Research on Users' Continuous Use Intention of Live
Broadcast Platform in the Context of Digital Societ
Pengyu Zhu
*
and Shimin Shao
School of Management Engineering, Xuzhou University of Technology Xuzhou, China
Keywords: Live Broadcast, SPSS, Use Intention, Model.
Abstract: With the rapid development of live broadcast industry, the competition between live broadcast platforms is
becoming more and more fierce. It is very important for live broadcast platform to retain users and enhance
their continuous use intention. In this paper, we construct the model of live broadcast platform users'
continuous use intention, collect data through the way of questionnaire investigation, analyze and process the
data by using SPSS software, draw conclusions and put forward relevant suggestions, which will provide
reference for enhancing the user stickiness and competitiveness of live broadcast platform.
1 INTRODUCTION
With the integration and development of the new
generation of information technology and traditional
fields, industrial and social transformation is
imminent. The digital society characterized by
digitization, networking and intelligence has become
the general trend. At the same time, with the
accelerated upgrading of people consumption and the
continuous growth of diversified and personalized
demand, live broadcast, as a new consumption mode,
has been rapidly accepted by the public. Compared
with traditional texts and pictures, live broadcast can
make people more convenient and fast to obtain
information and emotional communication.
Therefore, the live broadcast industry has achieved
vigorous development in recent years. According to
The 47th China Statistical Report on Internet
Development issued by China Internet Network
Information Center (CNNIC), by December 2020, the
number of live broadcast users in China had reached
617 million, an increase of 57.03 million over March
2020, accounting for 62.4% of the total Internet users.
(China Internet Network Information Center, 2021)
The vigorous development of the live broadcast
industry also makes it become a hot spot in the
academic and industrial circles in recent years.
Therefore, this article explores the factors that
influence the users' continuous use intention of live
broadcast platform. It can help the live broadcast
platform better understand user needs, improve
service quality, enhance user stickiness, promote
healthy and rapid development of the live broadcast
industry, and better build Internet ecosystem.
2 LITERATURE REVIEW
Live broadcast is a new trend of highly interactive
Internet. It shows the current situation of ongoing
activities to end users and meets the needs of users
through network media. This communication mode
absorbs and continues to maintain the advantages of
Internet, with intuitive expression, rich content, full
interaction and no time and space constraints.
Xiaojun Fan (2020) believed that the interactivity
of mobile live-video broadcast has a significant
positive effect on the satisfaction and the intention of
continuous use of user by improving the viewing
experience and anchor identity. (Fan, 2020) Lijia Tang
(2018) believed that different interface modes should
be developed according to the personalized experience
of different users to provide users with efficient and
accurate content. (Tang, 2018) Xiwei Wang (2020)
constructed a conceptual model of influencing factors
of webcast app users' use behavior and conducted
empirical analysis to prove that perceived
interactivity, perceived value and perceived risk have
a significant effect on users' use intention. (Wang,
2020)
Based on the rational behavior theory, Davis
(1989) proposed a technology acceptance model
Zhu, P. and Shao, S.
Empirical Research on Users’ Continuous Use Intention of Live Broadcast Platform in the Context of Digital Societ.
DOI: 10.5220/0011732700003607
In Proceedings of the 1st International Conference on Public Management, Digital Economy and Internet Technology (ICPDI 2022), pages 185-190
ISBN: 978-989-758-620-0
Copyright
c
2023 by SCITEPRESS – Science and Technology Publications, Lda. Under CC license (CC BY-NC-ND 4.0)
185
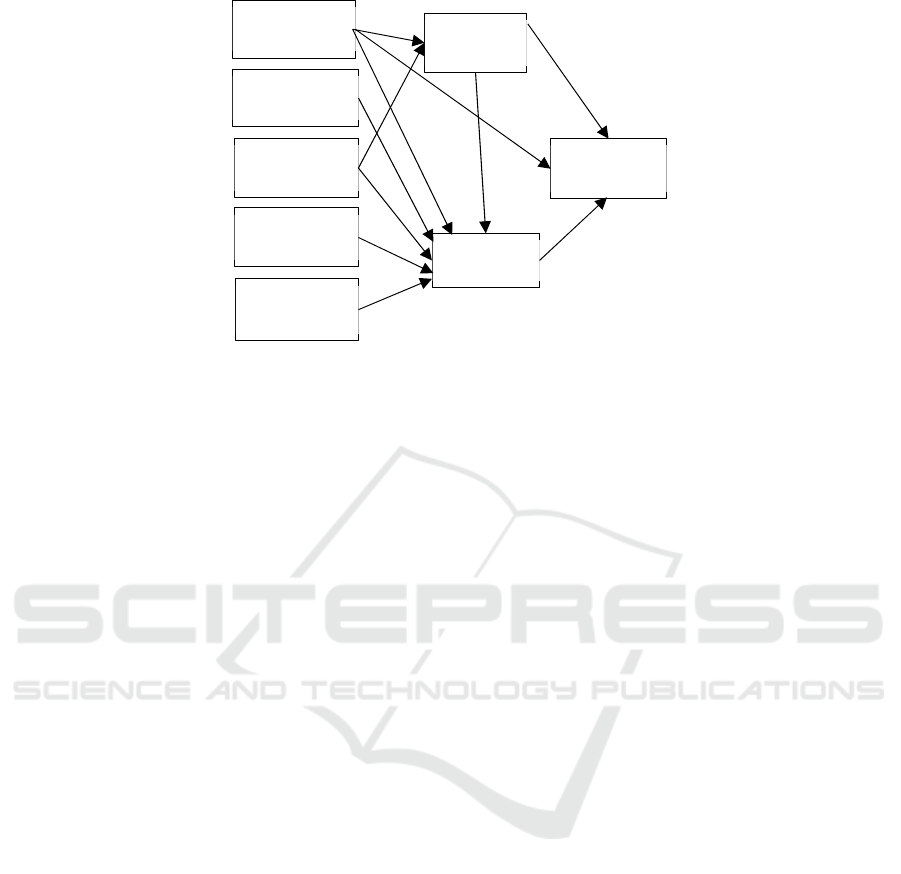
Figure 1: Framework of the model.
(TAM) when analyzing people's use of information
systems, in which there are two very important
factors: perceived ease of use and perceived
usefulness. (Davis, 1989) Bhattacherjee (2001)
proposed the expectation confirmation model of
information system continuance (ECM-ISC), Users'
perceived usefulness and satisfaction affect their
continuous use, and satisfaction is affected by users'
perceived usefulness and expectation confirmation.
(Bhattacherjee, 2001)
3 RESEARCH MODEL AND
DATA COLLECTION
3.1 Research Model and Hypothesis
Referring to TAM and ECM-ISC model, this paper
constructs the research model, as shown in Figure 1.
According to the model, the following
assumptions are proposed:
H1: Perceived ease of use has a positive effect on
perceived usefulness.
H2: Perceived ease of use has a positive effect on
satisfaction.
H3: Perceived ease of use has a positive effect on
users' continuous use intention.
H4: Perceived entertainment has a positive effect
on satisfaction.
H5: Expectation confirmation has a positive effect
on perceived usefulness.
H6: Expectation confirmation has a positive effect
on satisfaction.
H7: Perceived risk has a negative effect on
satisfaction.
H8: Perceived interactivity has a positive effect on
satisfaction.
H9: Perceived usefulness has a positive effect on
satisfaction.
H10: Perceived usefulness has a positive effect on
users' continuous use intention.
H11: Satisfaction has a positive effect on users'
continuous use intention.
3.2 Questionnaire and Data Collection
The questionnaire consists of three parts.
The first part is the introduction, which explains
the research purpose, confidentiality and content of
the questionnaire, so as to help the respondents better
understand the research background.
The second part is the basic situation of the
respondents, including gender, age, occupation,
education level and the weekly using frequencies of
live broadcast platform.
The third part is the key research content. It
includes 8 variables, including perceived usefulness,
perceived ease of use, perceived entertainment,
expectation confirmation, perceived risk, perceived
interactivity, satisfaction and continuous use
intention, with a total of 28 items.
This paper conducted a questionnaire survey
posted electronic questionnaire online. The online
questionnaire is made through the questionnaire star
platform and distributed through online channels.
Finally, 256 complete questionnaires are returned.
After excluding 11 invalid questionnaires, 245 valid
questionnaires are finally received, with a detailed
sample description as shown in Table 1.
perceived
ease of use
perceived
entertainment
expectation
confirmation
perceived risk
perceived
interactivity
perceived
usefulness
satisfaction
continuous
use intention
ICPDI 2022 - International Conference on Public Management, Digital Economy and Internet Technology
186

Table 1: Distribution of Respondents.
Category Frequency Percentage
Gender
Male 129 52.7
Female 116 47.3
Age
Below 18 33 13.5
18-25 160 65.3
26-35 37 15.1
36-45 12 4.9
Above 45 3 1.2
Education
Specialists and below 92 37.6
Bachelor 131 53.5
Master and above 22 9
Occupation
government employees 16 6.5
employees of firms and enterprises 26 10.6
liberal professions 6 2.4
Private owners 39 15.9
students 158 64.5
Using frequencies of
live broadcasting
platform
1 time 20 8.2
2-5 times 69 28.2
6-10 times 97 39.6
11 times and above 59 24.1
Table 2: Reliability Analysis.
Research Variable Cronbach α Item
perceived ease of use 0.845 3
perceived entertainment 0.841 3
expectation confirmation 0.861 3
satisfaction 0.847 3
perceived risk 0.879 5
perceived ease of use 0.824 3
perceived interactivity 0.855 4
continuous use intention 0.898 4
Table 3 KMO and Bartlett Test.
KMO 0.881
Bartlett Test of
Sphericity
Approx. Chi-Square 3925.481
df 378
Sig. .000
4 DATA
ANALYSIS
4.1 Reliability Analysis and Validity
Analysis
This paper tests the reliability and validity by SPSS
software. In the reliability analysis, Cronbach alpha
coefficient is generally used to test the consistency of
the research variables of each measurement item. As
shown in Table 2, the Cronbach's alpha coefficient of
each variable is greater than 0.8, indicating that it has
higher internal consistency.
The validity analysis is shown in Table 3.
KMO=0.881, greater than 0.8, indicating that there is
a strong correlation between variables.
4.2 Structural Equation Analysis
In this study, AMOS 23.0 software is used for
structural equation modeling, and the relationship
between variables is verified. According to the
research hypothesis, based on the research model, the
Empirical Research on Users’ Continuous Use Intention of Live Broadcast Platform in the Context of Digital Societ
187
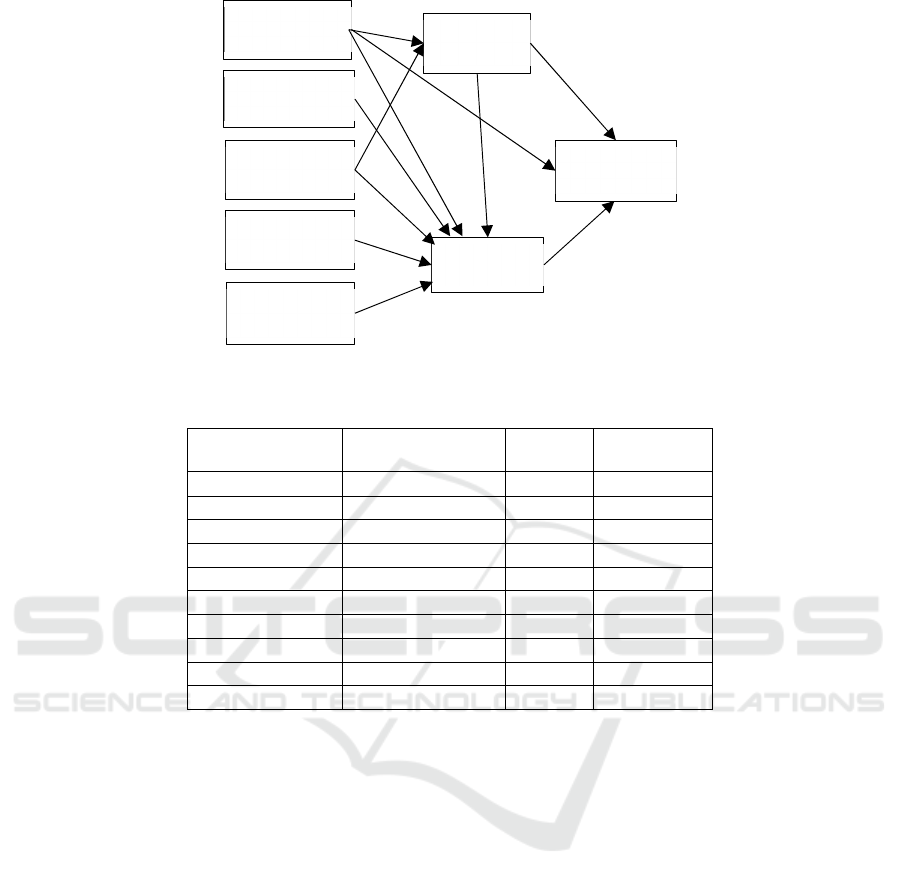
Figure 2: Action Path.
Table 4: Model Fitness Test.
Goodness of
Fit Index
Model Matching
Criteria
Value Result
CMIN —— 395.907 ——
DF —— 329 ——
CMIN/DF <3 1.203 Good
RMR <0.08 0.040 Good
GFI >0.8 0.898 Acceptable
AGFI >0.8 0.874 Acceptable
NFI >0.9 0.903 Good
IFI >0.9 0.982 Good
TLI >0.9 0.979 Good
CFI >0.9 0.982 Good
structural equation model is established by AMOS,
and we get the standardized path coefficient, as shown
in Figure 2.
After constructing the users' continuous use
intention model of live broadcast platform, this paper
tests and modifies the fitting relationship between the
model and the data, and finally obtains a model with
high fitting degree. The model fitting results are
shown in Table 4.
The better the fitting degree of the model, the
higher the effectiveness, applicability and persuasion
of the initial model of the influencing factors of users'
continuous use intention of live broadcast. It can be
seen from the above table that the fitness indexes of
the research model meet the research standards, and
the fitness of the model is good.
The model path coefficients and research
hypothesis test results of the structural equations are
shown in Table 5. From the model test results in Table
5, it can be seen that perceived ease of use has a
positive effect on perceived usefulness (β=0.321,
P<0.001), thus, H1 assumption is effectively
validated. Perceived ease of use has a positive effect
on satisfaction (β=0.197, P<0.05), thus, H2
assumption is effectively validated. Perceived ease of
use has a positive effect on users' continuous use
intention (β=0.191, P<0.05), thus, H3 assumption is
effectively validated. Perceived entertainment has a
positive effect on satisfaction (β=0.176, P<0.05), thus,
H4 assumption is effectively validated. Expectation
confirmation has a positive effect on perceived
usefulness (β=0.176, P<0.05), thus, H5 assumption is
effectively validated. Expectation confirmation has a
positive effect on satisfaction (β=0.164, P<0.05), thus,
H6 assumption is effectively validated. Perceived risk
has a negative effect on satisfaction (β=-0.185,
P<0.05), thus, H7 assumption is effectively validated.
Perceived interactivity has a positive effect on
satisfaction (β=0.173, P<0.05), thus, H8 assumption is
effectively validated. Perceived usefulness has a
positive effect on satisfaction (β=0.246, P<0.001),
thus, H9 assumption is effectively validated.
Perceived usefulness has a positive effect on users'
continuous use intention (β=0.23, P<0.05), thus, H10.
0.23
0.191
0.246
0.321
0.176
0.197
0.176
0.164
-0.185
0.173
0.282
perceived ease
of use
perceived
entertainment
expectation
confirmation
perceived risk
perceived
interactivity
perceived
usefulness
satisfaction
continuous
use intention
ICPDI 2022 - International Conference on Public Management, Digital Economy and Internet Technology
188
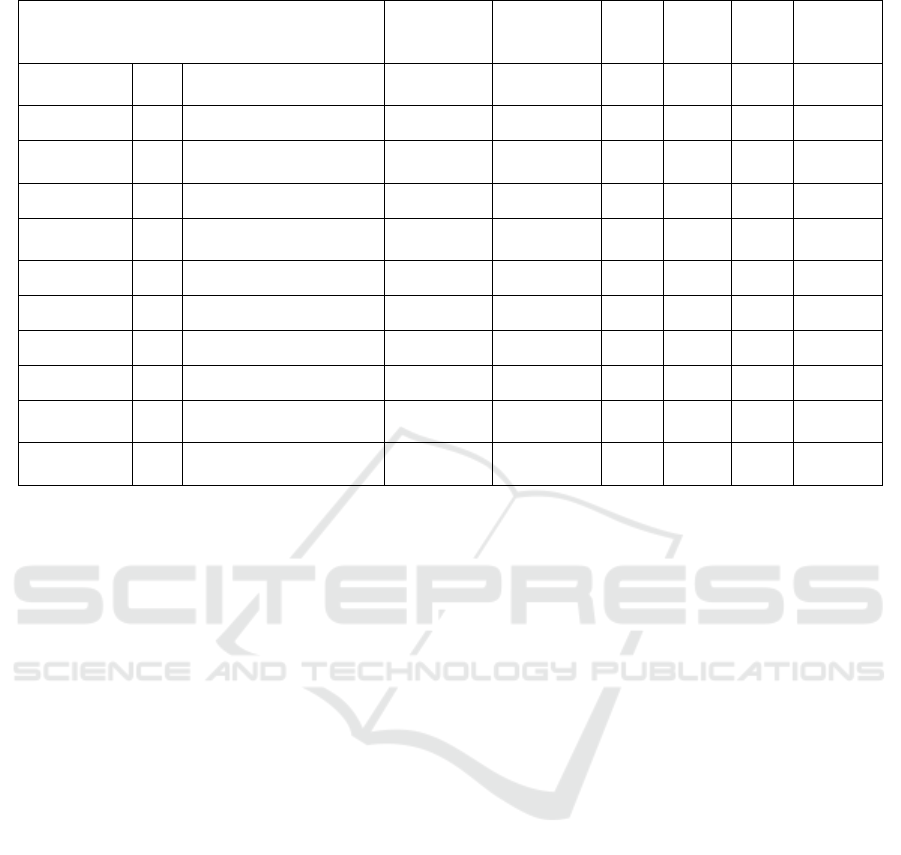
Table 5: Model Validation Results.
Assumed Path
standardized
coefficient
Non-
standardized
coefficient
S.E. C.R. P
Test
Results
perceived
usefulness
<--- perceived ease of use 0.321 0.35 0.086 4.087 *** True
satisfaction <--- perceived ease of use 0.197 0.205 0.078 2.634 0.008 True
continuous
use intention
<--- perceived ease of use 0.191 0.208 0.091 2.275 0.023 True
satisfaction <--- perceived entertainment 0.176 0.175 0.067 2.631 0.009 True
perceived
usefulness
<--- expectation confirmation 0.176 0.159 0.068 2.355 0.019 True
satisfaction <--- expectation confirmation 0.164 0.141 0.059 2.376 0.018 True
satisfaction <--- perceived risk -0.185 -0.238 0.084 -2.828 0.005 True
satisfaction <--- perceived interactivity 0.173 0.205 0.078 2.639 0.008 True
satisfaction <--- perceived usefulness 0.246 0.235 0.059 3.988 *** True
continuous
use intention
<--- perceived usefulness 0.23 0.231 0.072 3.196 0.001 True
continuous
use intention
<--- satisfaction 0.282 0.296 0.093 3.182 0.001 True
assumption is effectively validated. Satisfaction has a
positive effect on users' continuous use intention
(β=0.282, P<0.05), thus, H11 assumption is
effectively validated.
5 CONCLUSIONS
According to the results of data analysis, the following
conclusions can be drawn:
5.1 Analysis of Factors Affecting
Continuous Use Intention
The path coefficients of perceived usefulness,
perceived ease of use and satisfaction were 0.23, 0.191
and 0.282 respectively. The path coefficient of
satisfaction is the largest, indicating that satisfaction
has the greatest effect on continuous use intention.
This means when users are satisfied with platform live
content and related services, they will continue to use
it, and their continuous use intention will naturally
increase.
5.2 Analysis of Factors Affecting
Satisfaction
The path coefficients of perceived usefulness,
perceived ease of use, perceived entertainment,
perceived interactivity, expectation confirmation and
perceived risk to satisfaction were 0.246, 0.197, 0.176,
0.173, 0.164 and -0.185 respectively. Among them,
the path coefficient of perceived usefulness and
perceived ease of use is the largest, and the path
coefficient of perceived risk is negative, but its
absolute value is large, indicating that these three
factors have a great effect on satisfaction.
5.3 Analysis of Factors Affecting
Perception Usefulness
The path coefficients of perceived ease of use and
expectation confirmation for perceived usefulness are
0.321 and 0.176 respectively. The path coefficient of
perceived ease of use is higher, indicating that
perceived ease of use has the greater effect on
perceived usefulness.
Therefore, live broadcast platform should pay
more attention to factors such as perceived usefulness,
perceived ease of use, perceived risk. Firstly, they
should timely follow up user needs, constantly update
and upgrade real-time content, so that users can obtain
the most useful and high-quality information
resources in learning, work and life, and promote the
diversification of real-time content. Secondly, the
platform layout and pages strive to be concise and
clear, simplify operation steps, abandon complex
operation functions, so that people of all ages can
accept and understand them. It will effectively
improve users' first impression and stimulate users'
continuous use intention. Finally, the platform should
Empirical Research on Users’ Continuous Use Intention of Live Broadcast Platform in the Context of Digital Societ
189

protect user privacy and data security, eliminate
unnecessary spam, build a complete information
security protection management mechanism, provide
guaranteed service measures and diversified products
to meet the needs of users.
REFERENCES
A. Bhattacherjee, Understanding iformation sstems
continuance: an expectation confirmation model, Mis
Quarterly, vol. 25, pp. 351-370, 2001.
China Internet Network Information Center. (2021) The
47th China Statistical Report on Internet Development.
http://www.cnnic.net.cn/hlwfzyj/hlwxzbg/.
F.D. Davis, R.P. Bagozzi, P.R. Warshaw, User acceptance
of computer technology: a comparison of two
theoretical models, Management Science, vol. 35, pp.
982-1003, 1989.
L.J.Tang, Z.Q.Zhao, Analysis of the way and problem of
TikTok communication from the perspective of big
data, Editors Monthly, vol. 6, pp. 52-56, November
2018.
X.J.Fan, X.Y.Jiang, R.R.Ni, X.B.Dong, Influence of
interactivity of mobile live-video broadcast on intention
of continuous use of users, Journal of Systems and
Management, vol. 29, pp. 294-307, March 2020.
X.W. Wang, W.L. Liu, F.Q. Jia, C. Zhang, Model and
empirical study on influencing factors of webcast app
usage behavior, Library and Information Work, vol. 64,
pp. 22–31, March 2020.
ICPDI 2022 - International Conference on Public Management, Digital Economy and Internet Technology
190
