
Viewing Prediction Based on Hybrid Kernel Model with User
Behaviors and Sentiment Analysis
Meiqi Ji, Xiaoli Feng, Ruiling Fu and Fulian Yin
*
College of Information and Communication Engineering Communication University of China Beijing, China
*
Corresponding author: yinfulian@cuc.edu.cn
Keywords: User Behavior, Sentiment Analysis, Viewing Prediction, Hybrid Kernel Least Squares Support Vector
Machines, Particle Swarm Optimization Algorithms.
Abstract: The viewing prediction for TV programs has an important impact on users and program producers and
broadcasters, but existing prediction methods do not take into account the emotional factors of users’ viewing
and have problems of over-fitting. In this paper, we propose a hybrid kernel least squares support vector
machine model based on a particle swarm optimization algorithm to research viewing prediction, based on
the advantages of time series and least squares support vector machine models in prediction, taking into
account two types of factors, namely user viewing behavior and comment sentiment, and setting up a
comparison experiment. The results show the effectiveness and applicability of the model in fitting and
predicting audience ratings.
1 INTRODUCTION
Audience ratings mainly refer to the ratio of the
viewers of a certain channel or TV program to the total
viewers in a region and the same period (Xiao, 2015).
It is one of the most important indicators to assess the
value of TV programs, not only reflecting the
reputation of the programs, but also directly related to
the economic benefits, hence it is of great concern to
the public (Shi, 2018). In recent years, due to the
development of social networks, uncontrollable
factors such as viewer emotional preferences and
online opinions have become key factors interfering
with audience ratings (Wang, 2019). At the same time,
users’ opinions and comments on TV programs,
which are posted instantly on interactive platforms
such as various video websites and Douban movies,
will have a certain impact on program ratings. Based
on TV program data, user viewing behavior data and
comment text data, we can make scientific and
effective predictions on the ratings of programs to be
promoted or already broadcast, to grasp the impact of
user viewing behavior and comment sentiment on
ratings, which will enable program producers and
broadcasters to explore user interests more deeply and
further enhance the competitiveness of programs. In
addition, it can also provide a better basis for users to
make their viewing choices and improve their viewing
experience.
In order to eliminate the bias of subjective
judgments, viewing prediction focuses on how to
convert the various factors affecting ratings into some
relevant indexes and represent them in a relatively
accurate mathematical form. In the early days, some
scholars used statistical linear regression methods to
judge viewing regularity, but this method could not
allow for a deeper understanding of the regularity of
viewing changes (Zhang, 2007). In the early 21st
century, as the data mining technology mature,
methods such as artificial neural network (Wang,
2014), Bayesian network (Zhang, 2007) and decision
tree algorithm (Zhou, 2017) began to be applied to the
viewing prediction, but these methods are often
susceptible to individual “singularity” data and are
limited by the amount of data available. Furthermore,
methods based on time series (Zheng, 2009) can solve
the problems of low viewing data to a certain extent,
achieving better prediction effects. Recently, some
scholars also researched the estimation method of a
class of support vectors under the Bayesian evidence
framework (Chen, 2011), which provided a new idea
for the audience ratings analysis and prediction, and
achieved better prediction accuracy than the
traditional methods. Meanwhile, good advantages of
the least squares support vector machine (LSSVM)
Ji, M., Feng, X., Fu, R. and Yin, F.
Viewing Prediction Based on Hybrid Kernel Model with User Behaviors and Sentiment Analysis.
DOI: 10.5220/0011733000003607
In Proceedings of the 1st International Conference on Public Management, Digital Economy and Internet Technology (ICPDI 2022), pages 197-202
ISBN: 978-989-758-620-0
Copyright
c
2023 by SCITEPRESS – Science and Technology Publications, Lda. Under CC license (CC BY-NC-ND 4.0)
197
technique are demonstrated in various aspects of
predicting (Ma, 2015; Zhai, 2021). However, during
the prediction, parameter optimization like particle
swarm optimization (PSO) algorithms needs to be
considered for better performance.
Our paper takes into account two major factors,
namely user viewing behavior and comment
sentiment, during the program broadcast, and
researches the TV program viewing prediction based
on time series. The data is collected and analyzed to
build a time-based dataset of user viewing sequences
and a dataset of user sentiment sequences. Then,
starting from the standard LSSVM model, we utilize
the PSO algorithm and combine the advantages of the
single Gaussian radial basis (RBF) kernel function and
a polynomial (POLY) kernel function to build a hybrid
kernel PSO_LSSVM model for fitting and predicting
the viewing data. Finally, the viewing prediction
effects of four models, namely the standard LSSVM
model, the PSO_LSSVM model based on a single
RBF kernel, the PSO_LSSVM model based on a
hybrid kernel and the BP neural network, are
compared and analyzed.
2 THE PSO_LSSVM MODEL
BASED ON HYBRID KERNEL
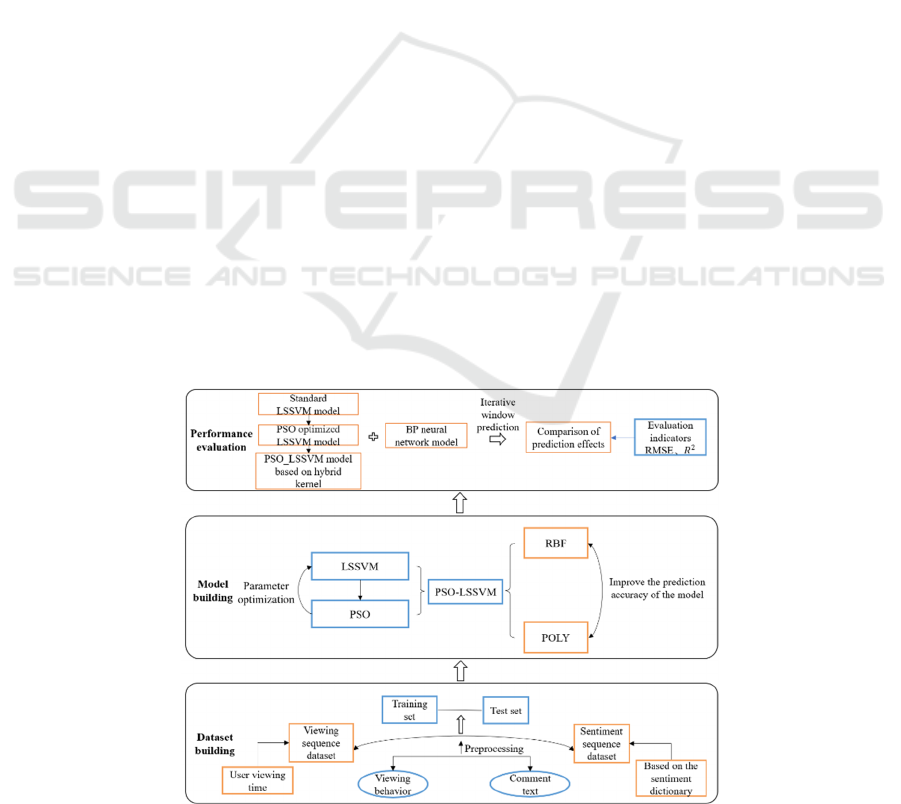
Our paper researches viewing prediction based on user
behaviors and sentiment analysis. The structure of our
model is shown in Fig. 1, which is divided into three
parts: dataset building, model building and
performance evaluation. Firstly, we select a popular
TV program and through the crawler technology to
obtain data on user viewing behavior and textual data
of users’ comments. Then, we utilize data pre-
processing and text sentiment analysis methods to
obtain experimental datasets for model training fitting
and prediction.
Then, the standard LSSVM model is used as the
basis, as the performance of the model depends
heavily on the choice of its kernel function and the
determination of the model parameters. However,
there is no unified theory identified to guide the
selection of an effective kernel function and model
parameters. Therefore, we utilize a PSO algorithm to
obtain the optimal parameter values through circular
iterations. We build a hybrid kernel function based on
the local RBF kernel function with high learning
ability and the global POLY kernel function with high
generalization ability, and takes it as the kernel
function of LSSVM to avoid overfitting. The
PSO_LSSVM model based on the hybrid kernel is
finally built for TV program viewing prediction by
combining the PSO algorithm at the same time.
Eventually, on the basis of the built model, the
adaptive iterative window prediction method is used
to make a comparative experiment on the standard
LSSVM model, the PSO_LSSVM model based on a
single kernel, the PSO_LSSVM model based on a
hybrid kernel proposed in the paper and the commonly
used data fitting model, namely the BP neural network
model. Through two basic evaluation indicators,
𝑅𝑀𝑆𝐸 and coefficient of determination ( 𝑅
), the
prediction performance of the model is objectively
evaluated to verify that our proposed model has better
applicability and validity than other models in terms
of viewing prediction.
Figure 1: Structure of the PSO_LSSVM model based on hybrid kernel.
ICPDI 2022 - International Conference on Public Management, Digital Economy and Internet Technology
198

2.1 Least Squares Support Vector
Machine
Support vector machine (SVM) is a general learning
method developed based on statistical theory, which
specializes in the study of the small sample case where
an optimal solution to the learning problem can be
obtained without the asymptotic condition that the
amount of data tends to infinity (Niu, 2020). SVM has
been widely used in recent years for fitting small
samples and non-linear data, and has a better
advantage over traditional neural network algorithms.
This is in line with the requirement to viewing
prediction in the short term during the broadcast of a
TV program. LSSVM was proposed by Suykens and
Vandewalb in 1999 and is a new type of SVM that is
improved by choosing a quadratic loss function and
transforming the optimization problem from quadratic
programming into a problem of solving a set of linear
equations, effectively increasing the speed of
budgetary solutions.
2.2 Particle Swarm Optimizer
Algorithm
Particle Swarm Optimizer (PSO) was proposed by
scholars Kennedy and Eberhart in 1995 (Kennedy,
2017) as an evolutionary computational technique
based on swarm intelligence (Li, 2002). The basic idea
of the algorithm is to use collaboration and
information sharing among different particles in a
population to find the location of the global optimal
solution. In the algorithm, each particle corresponds to
an adaptation value based on a fitness function derived
from its current velocity and location. For example, in
this paper, the adaptation value is the RMSE between
the fitting and true values of the viewing. The
algorithm uses a circular iterative approach to
dynamically update the attribute values, and
eventually finds the speed and position corresponding
to the global optimal adaptation value to achieve the
optimal viewing prediction effect.
2.3 The PSO_LSSVM Model Building
Based on Hybrid Kernel
2.3.1 Hybrid Kernel Function Building
In order to ensure that the model can have a good
performance of viewing prediction while having a
high fitting effect on the audience ratings series data.
Based on the local RBF kernel function with high
learning ability and the global POLY kernel function
with high generalization ability, we utilize the hybrid
weight coefficients to realize the hybrid kernel
function 𝐾, which is defined as:
𝐾 = 𝑎× 𝐾
+
1 −𝑎
× 𝐾
, (1)
𝐾
= 𝑒𝑥𝑝
−
‖
𝑥−𝑥
‖
/𝜎
, (2)
𝐾
=
𝑥× 𝑥
+ 𝑡
, (3)
where
𝑎 is the hybrid weight coefficient to indicate the
weight of two single RBF kernel and POLY kernel in
the hybrid kernel function, and its value takes the
range of [0,1]. When 𝑎 =1, 𝐾 consists of RBF kernel
function only; when 𝑎 =0, 𝐾 consists of POLY
kernel function only. 𝜎
denotes RBF kernel function
width. 𝑡 denotes the bias coefficient (He, 2016) and
𝑡≥0, which is 1 by default in the LSSVM toolkit. 𝑞
denotes the polynomial POLY kernel function order,
𝑞≥1 and 𝑞 is an integer.
2.3.2 Training Steps Of PSO_LSSVM Model
Based on Hybrid Kernel
When PSO_LSSVM model based on hybrid kernel
proceeds audience ratings fitting and prediction, the
values of model parameters to be determined can be
divided into two groups, namely
𝛾, 𝜎
,
𝑝, 𝑎
. Based
on the optimization performance of the PSO
algorithm, our paper utilizes the algorithm to
determine the combined values of the two groups of
parameters, and obtain the corresponding optimal
parameter values under different training data to
achieve better viewing prediction.
Step 1: Initialization parameter setting
The two parameters in LSSVM are consistent with the
standard LSSVM experiments, the value ranges are set
to 𝛾 𝜖 [0.01, 50], 𝜎
𝜖 [0.01, 20]respectively. For the
PSO algorithm, the number of particle swarm 𝑀 =
50, the initialization learning factor 𝐶
= 𝐶
=1, the
initial inertia weight 𝑤_𝑚𝑖𝑛 =0.4, the termination
inertia weight 𝑤
=0.95, the maximum number of
iterations 𝐾 = 500.
Step 2: The first optimization determines the
optimal value of [γ, σ
2
]
The values of 𝛾 and 𝜎
respectively refer to the flight
velocity and current position of each particle in the
particle swarm, and the RMSE between the ratings
fitting value and the real value of the model training
output is used as the adaptation value calculated by the
adaptation function. Then the three values are stored
in the 3-dimensional local vector 𝑃
_
(𝑀,3) .
𝑃
_
[
𝑖,1
]
represents the 𝛾 value of the 𝑖th particle,
𝑃
_
[
𝑖,2
]
represents the 𝜎
value of that particle,
𝑃
_
[
𝑖,3
]
represents the optimal adaptation value of
that particle under the current two attribute taking
values.
Viewing Prediction Based on Hybrid Kernel Model with User Behaviors and Sentiment Analysis
199

By comparing the local optimal values found by
each particle through circular iterations, when the
number of iterations reaches the maximum, the global
optimal parameter taking value 𝐺
_
(
𝑖,3
)
is
determined, the optimal parameter taking value of
[
𝛾, 𝜎
]
for model training fitting is namely obtained.
Step 3: The second optimization determines
the optimal value of [p, a]
In the second PSO optimization, except for changing
the maximum number of iterations to 300 (determined
by the results of several experiments), the
initialization settings of the remaining parameters are
consistent with those of the first optimization. The
maximum value of the hybrid weight coefficient 𝑎 is
also set to 1 and the minimum value to 0. The
polynomial kernel order 𝑝 is taken in the range
[
2,8
]
.
The values of 𝑝 and 𝑎 respectively refer to the
flight velocity and current position of each particle in
the particle swarm, the global optimal parameter
values of
[
𝛾, 𝜎
]
obtained from the first optimization
are substituted into the new adaptation function
constructed based on the hybrid kernel model, and the
RSME between the fitting value and real value of the
model training output is also taken as the adaptation
value. The value of 𝑝, 𝑎 and the new adaptation value
are stored in the 3-dimensional local vector
𝑃
_
(
𝑀,3
)
.
𝑃
_
[𝑖,1] represents the 𝑝 value of
the 𝑖th particle, 𝑃
_
[
𝑖,2
]
represents the 𝑎 value of
the particle. 𝑃
_
[𝑖,3] represents the optimal
adaptation value of that particle under the current two
attributes and the two attributes obtained by the first
optimization.
Consistent with the first optimization, the local
optimal values found by each particle are compared
through circular iterations, when the number of
iterations reaches the maximum, the global optimal
parameter taking value 𝐺
_
(
𝑖,3
)
can be
determined, that is the values of
[
𝑝, 𝑎
]
are determined.
Finally, after all the optimal parameters for the
hybrid kernel model fitting and training are
determined by two PSO optimizations, the combined
values of the two groups of parameters are substituted
into the hybrid kernel model to obtain the training
model for user viewing prediction.
3 EXPERIMENTS
3.1 Experimental Settings
3.1.1 Evaluation Metrics
In this paper, we utilize two evaluation metrics, Root
Mean Squared Error 𝑅𝑀𝑆𝐸 and coefficient of
determination 𝑅
to objectively evaluate the model’s
ratings fitting and prediction effects. The evaluation
metrics are specifically defined as:
𝑅𝑀𝑆𝐸 =
∑ (
𝑦
−𝑦
)
, (4)
𝑅
=1−
∑ (
)
∑
(
)
, (5)
where 𝑛 denotes the number of input training samples,
𝑦
represents the actual output sample value of the
training, 𝑦
is the output predicted value obtained by
the trained model. In general, the closer the value of
𝑅𝑀𝑆𝐸 is to 0, the better the model is indicated. 𝑦
represents the average of the actual output sample
value. The closer the value of 𝑅
is to 1, the better the
overall performance of the model.
3.1.2 Project Settings
User behaviors are reflected by time, hence we study
the variation of users viewing over time and user
viewing emotion to build a training model. Our paper
proposes a two-dimensional model fitting and training
based on Time-Series to the series of sentiment values
of user comments. Afterward, the sentiment value of
the comments in the following days is predicted based
on the obtained two-dimensional model. Then the
predicted sentiment values are substituted into the
model trained by fitting the three-dimensional viewing
data which is based on time and comment sentiment
to predict the viewing values of these days.
In addition, there is a certain short-term regularity
in sentiment values of user comments and variation of
audience ratings during a week interval (Wang, 2014).
Therefore, we perform model adaptive iterative
prediction experiments with a sliding window step of
7 days. With the adaptive method, the corresponding
model parameters are obtained based on different
input data, which can effectively improve the fitting
and prediction performance of the model.
3.2 Our Model Experiment Results
The comment sentiment series from the 1st day to 7th
day are trained and optimized to build a two-
dimensional fitting model to predict the value of
comment sentiment on the 8th day as an example. The
optimal combination of parameters of the model is
obtained by the PSO algorithm twice. 𝛾 =
49.8176224758775 , 𝜎
= 0.984616850043333 ,
𝑝 =6 , 𝑎 = 0.774411848246410 . The model
corresponds to a two-dimensional fitted curve chart of
the output, which is shown in Fig. 2.
ICPDI 2022 - International Conference on Public Management, Digital Economy and Internet Technology
200
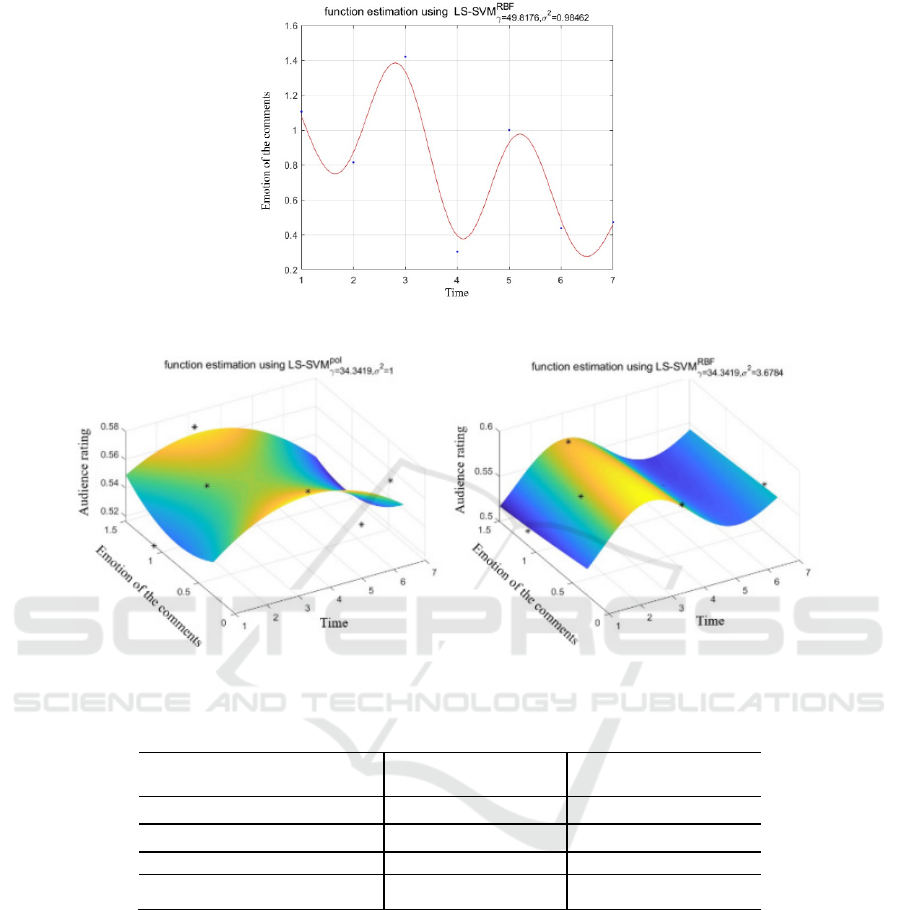
Figure 2: Comment sentiment series fitting curve from 1st day to 7th day by hybrid kernel PSO_LSSVM model.
Figure 3: User viewing series fitting surface plots from 1st day to 7th day by hybrid kernel model RBF kernel(left) and POLY
kernel(right).
Table 1: The accuracy of viewing prediction of each model.
Model RMSE Coefficient of
Determination 𝑹
𝟐
Standard LSSVM 0.041775728604624 -1.233229389032163
RBF Kernel PSO_LSSVM
0.041184539557121 -1.170469553745755
BP Neural Network 0.036683035753293 -0.721931244854013
Hybrid Kernel PSO_LSSVM
0.013011451968885 0.783360924310559
In Fig. 2, the fitting of user comment sentiment
series using the hybrid kernel-based model is closer to
the change of real sentiment values, and the fitting
curve can better reflect the change of users’ sentiment.
Similarly, the user viewing series and comment
sentiment series from 1st day to 7th day are trained
and optimized to build a three-dimensional hybrid
kernel fitting model to predict the audience ratings on
the 8th day for example. The optimal combination of
parameters of the model is obtained by the PSO
optimization algorithm twice. 𝛾 =
34.3419039139321 , 𝜎
= 3.67838800318802 ,
𝑝 =2, 𝑎 =1. The model corresponds to three-
dimensional fitted surface plots of the output, which
are shown in Fig. 3.
In Fig. 3, the hybrid kernel model obtained a better
fitting effect based on the local RBF kernel than that
based on the global POLY kernel, reflecting the high
learning ability of the local kernel function.
3.3 Performance Evaluation
When the sliding window step of 7 days is used for the
viewing prediction, the performance of viewing
prediction of each model can be reflected more
intuitively in Table 1.
Viewing Prediction Based on Hybrid Kernel Model with User Behaviors and Sentiment Analysis
201

According to Table 1, the prediction performance
of the PSO_LSSVM model based on hybrid kernel our
paper proposed is significantly better than other
models and our model can obtain better generalization
performance.
4 CONCLUSIONS
Our paper researches the audience rating prediction by
integrating user viewing behaviors and comments
sentiment analysis, and makes further enhancements
in the traditional prediction methods without the
influence of users’ sentiment on the ratings. We
propose a hybrid kernel model with high fitting and
generalization performance, and utilize the adaptive
iterative prediction to train the model fitting with a
sliding window step of 7 days. Through comparative
experimental analysis, our hybrid kernel model is
verified its effectiveness and applicability in the field
of audience rating prediction.
REFERENCES
A. Li, Z. Tan, and F. Bao, “Particle swarm optimization
algorithms,” Computer Engineering and Applications,
vol. 38, 2002, pp. 1-3.
A. He, “Stock key inflection point prediction based on
polynomial fitting and support vector machine,” Jilin
University, 2016.
D. Zhou and Y. Su, “Research on TV ratings prediction
based on decision tree algorithm,” Computer & Digital
Engineering, vol. 11, 2017, pp. 2123-2125+2130.
J. Wang and M. Guo, “A study on TV series ratings
prediction model in China - based on the perspective of
copyright value assessment,” Modern Communication,
vol. 08, 2019, pp. 126-132.
J. Zhang, B. Bai, and Y Su, “Bayesian network-based TV
program ratings prediction research,” Science
Technology and Engineering, vol. 07, 2007, pp. 4099-
5102.
J. Kennedy, “Particle Swarm Optimization,” Boston:
Springer, 2017, pp. 967-972.
N. Niu, S. Nan, J. Zhang, and Y. Wang, “LSSVM
prediction model based on improved kernel parameter
selection method,” 2020 11th International Conference
on Prognostics and System Health Management. Jinan,
China, 2020, pp. 391-394.
Q. Xiao, “Research on statistical and analytical methods of
digital TV viewing data,” Fuzhou University, 2015.
Q. Chen and H. Xue, “Improved P-SVM ratings forecasting
method and its application research,” Journal of Xi'an
Technological University, vol. 06, 2011, pp. 535-542.
X. Zhai, “Chaos analysis and least squares support vector
machines for graduate employment prediction models,”
Microcomputer Applications, vol. 37, 2021, pp. 169-
172.
Y. Wang, G. Tian, and S. Wen, “BP neural network based
TV program ratings prediction model,” Television
technology, vol. 38 2014, pp. 94-96.
Y. Zheng, “Audience rating prediction of new TV programs
based on GM(1,1) envelopment model,” IEEE Press.
Nanjing, China, 2009, pp. 388-391.
Y. Ma and B. Yan, “Hybrid kernel function least squares
support vector machines for network traffic prediction
models,” Microcomputer Applications, vol. 02, 2015,
pp. 50-53.
Z. Shi and Y. Xing, “A brief description of TV ratings
analysis methods,” Technology Innovation and
Application, vol. 31, 2018, pp. 107-109.
ICPDI 2022 - International Conference on Public Management, Digital Economy and Internet Technology
202
