
Analysis on The Dynamic Evolution Characteristics of
Three-Dimensional Ecological Footprint in Shaanxi Province
Zhaowen Duan
a
, Shan Xie
*
and Yuanli Su
School of Tourism & Institute of Humanities and Geography, Xi'an International Studies University,
Xi'an, Shaanxi, 710128, China
Keywords: Footprint Size, Footprint Depth, Ecological Sustainability, Shaanxi Province.
Abstract: With the accelerated pace of industrialization and urbanization, the rapid economic development of Shaanxi
Province is accompanied by increasingly prominent ecological and environmental problems. An improved
three-dimensional ecological footprint model was used to analyze the evolution characteristics of ecological
footprint in Shaanxi Province from 2010 to 2019. The results showed that 1) The per capita footprint size and
per capita footprint depth in Shaanxi Province from 2010-2019 showed an overall increasing trend. 2) The
per capita three-dimensional ecological footprint increased at a rate of 10% year by year, and the per capita
ecological carrying capacity has been maintained at about 0.8 hm
2
; By 2019, the per capita ecological deficit
reached 3.0264 hm
2
, and Shaanxi Province's ecological development was in an unsustainable state. In the
future, we need to pay attention to the reasonable control of urbanization process, improve the efficiency of
energy utilization, and advocate economical consumption patterns, so as to realize the sustainable
development of Shaanxi Province.
1 INTRODUCTION
With the economic development and the
improvement of people's living standards, the
uncontrolled use of resources by humans has led to
land degradation, soil erosion, and a sharp decrease
in biodiversity, which has seriously restricted the
sustainable development of urban ecological
construction. In 1992, William E. Rees, a Canadian
scholar, proposed the "ecological footprint model",
which is mainly used to measure the harmony of
human-land relationship and ecological sustainable
development in the region (Rees, 1992), and
Wackernagel further supplemented and improved the
ecological footprint model (Wackernagel, 1999).
Later, Chinese scholars such as Xu Zhongmin and
Zhang Zhiqiang introduced the model into China
(Xu, 2000; Mo, 2020). It has been widely used by
scholars at home and abroad because of its concise
framework and easy operation (Niccolucci, 2009).
However, with further research, it was found that the
model only focuses on capital flow in natural capital
and ignores the capital stock. Therefore, Niccolucci
introduced two indicators of footprint depth and
footprint size to classify and measure natural capital
use, which solved the problem that capital stock was
ignored in previous models and developed the
research scale from two-dimensional to three-
dimensional (Fang, Gao, Li, 2013). Fang Kai further
improved the defects of the three-dimensional
ecological footprint model (Fang, 2012; Zhang,
2019), which not only measured the use of natural
capital from the time and space levels, but also
overcame the situation that the ecological deficit or
ecological surplus among different land types offset
each other in the accumulation process of the
traditional three-dimensional ecological footprint
model.
Through the summary of relevant ecological
footprint studies, it can be seen that ecological
footprint theory and models have been applied by
some scholars to evaluate the natural capital
utilization of land, water and other resources (Wu,
2020; Niccolucci, 2011), but most of them are still
based on two-dimensional ecological footprint
models, and the application of improved three-
dimensional ecological footprint models is still
relatively lacking, and previous studies have focused
on macroscopic scales such as global, national, and
urban clusters (Niccolucci, 2011; Zheng, 2018).
Therefore, this paper analyzes the dynamic evolution
characteristics of the ecological footprint of Shaanxi
292
Duan, Z., Xie, S. and Su, Y.
Analysis on The Dynamic Evolution Characteristics of Three-Dimensional Ecological Footprint in Shaanxi Province.
DOI: 10.5220/0011735100003607
In Proceedings of the 1st International Conference on Public Management, Digital Economy and Internet Technology (ICPDI 2022), pages 292-296
ISBN: 978-989-758-620-0
Copyright
c
2023 by SCITEPRESS – Science and Technology Publications, Lda. Under CC license (CC BY-NC-ND 4.0)

Province from 2010 to 2019 based on the improved
three-dimensional ecological footprint model, in
order to promote its ecological environment
construction and sustainable development level.
2 RESEARCH DESIGN
2.1 Research Method
Footprint size refers to the area of biologically
productive land actually occupied within the carrying
capacity and indicates the level of human
appropriation of capital flows, with spatial attributes.
Footprint depth refers to the number of multiples of
the land area that humans need for themselves to meet
the actual resource consumption and the number of
years required to regenerate these resources,
indicating the level of human depletion of the capital
stock with temporal attributes (Fang, 2013). The
calculation equation is as follows:
(1)
3, ,
D
size region depth region
EF EF EF=×
(2)
1
,
1
(,0)
1
n
ii
i
depth region
n
i
i
EF EC
EF
EC
=
=
−
=+
(3)
where EF
size,region
represents the size of the regional
footprint; EF
depth,region
represents the depth of the
regional footprint; EF
i
, EC
i
are the ecological
footprint and ecological carrying capacity of the i-th
land type; EF
3D
represents the regional three-
dimensional ecological footprint.
2.2 Data Source and Processing
According to the resource consumption status of
Shaanxi Province, this paper combines the research
results of Guo Xiurui, Wang Ruijie and Shi Lei (Guo,
2003; Wang, 2020; Shi, 2017), and constructs the
type of ecological footprint account as shown in
Table 1. The consumption data of the main products
of biological resources account and fossil energy
account in Shaanxi Province are obtained from the
Shaanxi Statistical Yearbook and Shaanxi Economic
and Social Development Statistical Bulletin from
2011 to 2020.
3 RESULTS
3.1 Dynamic Change of Per Capita
Footprint Size
It can be seen from Table 2, the per capita footprint
size in Shaanxi Province showed a slow upward trend
from 0.5105hm
2
in 2010 to 0.6352hm
2
in 2019, with
an average annual growth rate of 2.4%, reflecting the
increasing occupation of natural capital flow by
residents in Shaanxi Province. In terms of different
land types, the per capita footprint size of cultivated
land decreased slowly during the decade; forest land
and construction land were on the rise as a whole;
grassland and water area did not change significantly,
remaining at 0.0062 hm
2
and 0.0014 hm
2
,
respectively. The contribution of per capita footprint
size of each land type was in the following order:
cultivated land > forest land > construction land >
grassland > water area, which indicated that the main
carriers of natural capital flow in Shaanxi Province
were cultivated land and forest land. Cultivated land
accounts for more than 66% of the footprint size in
Shaanxi Province, providing food demand for
residents; forest land occupies the second largest
share, which is mainly used to provide wood for
economic construction and absorb greenhouse gases
such as CO
2
produced by human activities.
Table 1: Types of ecological footprint accounts in Shaanxi Province.
Account type
Consumption items Land type
Biological resources
account
Grain, oilseeds, vegetables, melons and fruits, pork, poultry
eggs, pastries, flue-cured tobacco, tea, wine, cotton
Cultivated land
Beef, mutton, poultry, milk Grassland
Wood, walnut, chestnut Forest land
Aquatic product Water area
Fossil energy account Electric power Construction land
Raw coal, coke, crude oil, gasoline, kerosene, diesel oil, natural
gas
Fossil energy land
,
1
(, )
n
s
ize region i i
i
EF EF EC
=
=
Analysis on The Dynamic Evolution Characteristics of Three-Dimensional Ecological Footprint in Shaanxi Province
293

Table 2: Per capita footprint size of Shaanxi Province from 2010 to 2019.
Year
Cultivated
lan
d
Forest land Grassland Water area
Construction
lan
d
Per capita footprint
size
2010 0.4435 0.0355 0.0069 0.0014 0.0232 0.5105
2011 0.4363 0.0514 0.0049 0.0014 0.0265 0.5205
2012 0.4346 0.1000 0.0064 0.0015 0.0286 0.5712
2013 0.4330 0.0876 0.0064 0.0014 0.0309 0.5594
2014 0.4317 0.0997 0.0063 0.0014 0.0327 0.5719
2015 0.4305 0.1117 0.0063 0.0014 0.0325 0.5824
2016 0.4286 0.1236 0.0062 0.0014 0.0384 0.5982
2017 0.4255 0.1355 0.0062 0.0014 0.0416 0.6102
2018 0.4216 0.1453 0.0062 0.0014 0.0455 0.6201
2019 0.4197 0.1583 0.0062 0.0014 0.0497 0.6352
Table 3: Per capita footprint depth of Shaanxi Province from 2010 to 2019.
Year Cultivated land Forest land Grassland Water area
Construction
lan
d
Per capita footprint
depth
2010 1.5248 1.0000 21.0519 19.8571 1.0000 3.7360
2011 1.5517 1.0000 30.2354 18.7857 1.0000 3.9406
2012 1.6188 1.0000 23.1009 19.1845 1.0000 4.3965
2013 1.1957 1.0000 8.3126 8.3097 1.0000 4.5885
2014 1.2367 1.0000 8.7595 7.8125 1.0000 4.8522
2015 1.3122 1.0000 9.8327 8.8068 1.0000 5.1915
2016 1.2974 1.0000 11.0435 9.0909 1.0000 5.6478
2017 1.3737 1.0000 11.1076 10.0142 1.0000 6.0425
2018 1.4895 1.0000 11.7318 10.7955 1.0000 5.7141
2019 1.4449 1.0000 14.3182 12.7131 1.0000 6.0183
3.2 Dynamic Change of Per Capita
Footprint Depth
As can be seen from Table 3, the per capita footprint
depth in Shaanxi Province showed a continuous
upward trend from 2010 to 2019, from 3.7360 hm
2
in
2010 to 6.0183 hm
2
in 2019, with an average annual
growth rate of 8.3%. In the past 10 years, the per
capita footprint depth of Shaanxi Province has always
been greater than 1, indicating that the capital flow
can no longer meet people's demand for natural
resources, and the capital stock needs to be consumed
to make up for the shortage of capital flow. From the
perspective of different land types, the per capita
footprint depth of cultivated land changed little and
was basically the same as that in 2010; grassland and
water area showed a fluctuating downward state. The
per capita footprint depth of cultivated land, forest
land and grassland were all greater than 1. Therefore,
these three types of land could not meet the ecological
needs and the capital stock was excessively
consumed. The per capita footprint depth of forest
land and construction land was equal to 1, indicating
that these two types of land were in ecological
surplus, and the consumption of capital flow could
meet people's consumption demand for these two
types of natural resources. The contribution of the per
capita footprint depth of each land type was in the
following order: grassland > water area > cultivated
land > forest land = construction land, which
indicated that the residents of Shaanxi Province
consume the most capital stock in grassland and
water area. The per capita footprint depth reached
6.0183hm
2
in 2019, which indicated that Shaanxi
Province needs 6.0183 times the existing land area to
meet the demand for natural resources for socio-
economic development.
3.3 Change in Supply and Demand of
Per Capita Ecological Footprint
It can be seen from Figure 1, the per capita three-
dimensional ecological footprint showed an overall
upward trend, from 1.9072 hm
2
in 2010 to 3.8231 hm
2
in 2019, with an average annual growth rate of 10%,
indicating that the residents of Shaanxi Province have
an increasing demand for resources. The per capita
ecological carrying capacity has not fluctuated
ICPDI 2022 - International Conference on Public Management, Digital Economy and Internet Technology
294
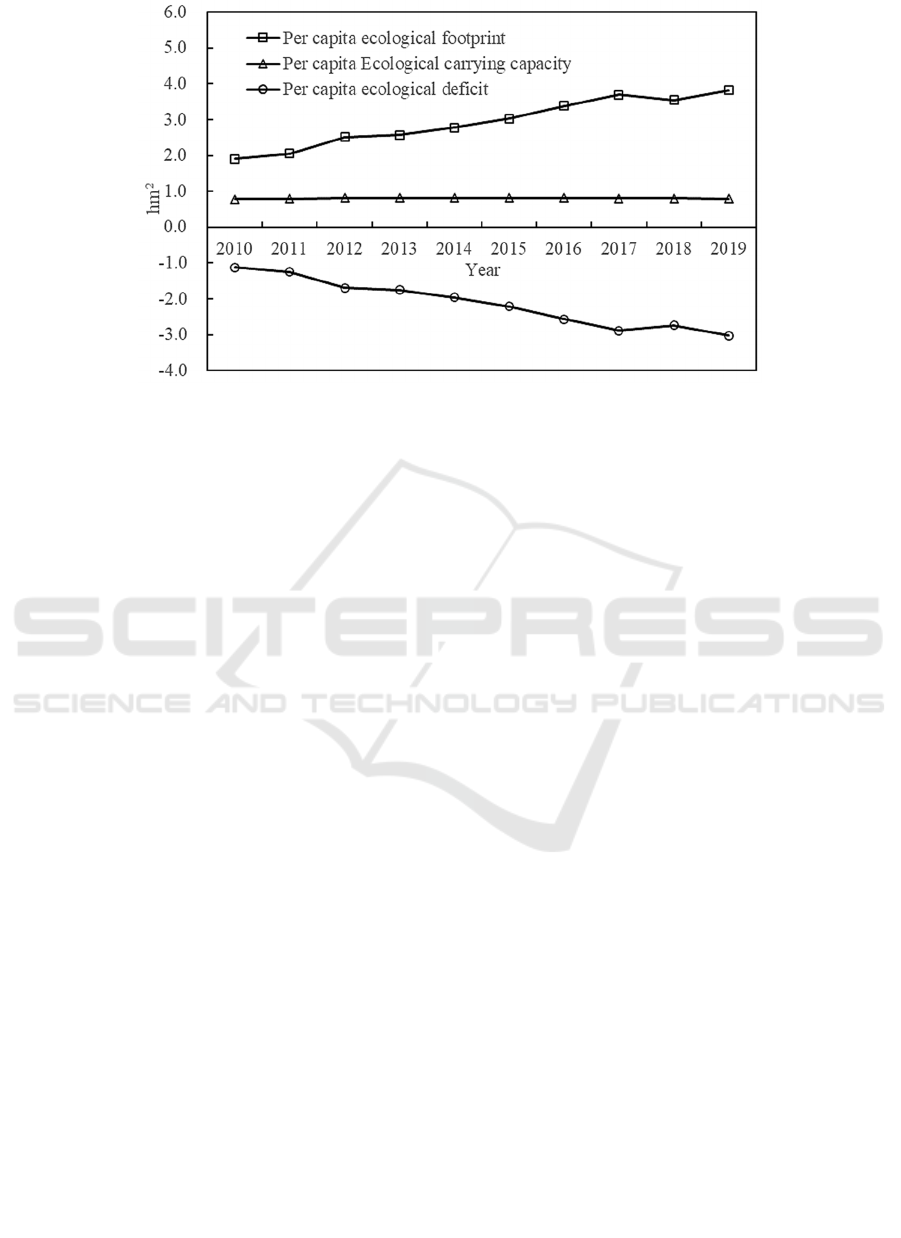
Figure 1: Per capita ecological footprint, carrying capacity and ecological deficit of Shaanxi Province from 2010 to 2019.
greatly and has been maintained at 0.8 hm
2
,
indicating that the ecological supply in Shaanxi
Province was relatively stable. The per capita
ecological deficit increased from 1.1262hm
2
in 2010
to 3.0264hm
2
in 2019, which was consistent with the
change trend of per capita ecological footprint. As of
2019, the per capita ecological footprint was 4.8
times of the per capita carrying capacity, indicating
that residents' demand for resources has far exceeded
the supply of environmental ecology, and the
ecological economic development of Shaanxi
Province has been in an unsustainable state. The
intensification of resource consumption due to rapid
population growth and the consumption of fossil
energy due to the need for vigorous industrial
development for economic and social development
are important reasons for the continuous increase of
ecological deficit in Shaanxi Province.
4 CONCLUSION AND
DISCUSSION
Based on the improved three-dimensional ecological
footprint model, this paper analyzes the dynamic
change characteristics of the footprint size, footprint
depth and ecological deficit in Shaanxi Province. The
main conclusions are as follows:
(1) From 2010 to 2019, the per capita footprint
size of Shaanxi Province showed a slow upward
trend, indicating that residents' occupation of capital
flow was increasing day by day. The per capita
footprint depth showed a continuous upward trend,
indicating that the capital flow could not meet the
needs of residents, and the capital stock was
continuously consumed.
(2) The per capita three-dimensional ecological
footprint was on the rise, with an average annual
growth rate of 10%. The development of per capita
ecological carrying capacity was relatively stable,
which has been maintained at 0.8 hm
2
. The trend of
per capita ecological deficit was consistent with that
of per capita ecological footprint. By 2019, the per
capita ecological footprint was 4.8 times of the per
capita carrying capacity, indicating that the human-
land relationship was tense and the sustainable
development situation was grim in Shaanxi Province.
Considering the availability of the data and the
characteristics of the analysis model, in the
calculation of ecological footprint, the missing data
or small negligible values of some consumption items
in the ecological footprint calculation lead to the
small calculation result of per capita ecological
footprint, indicating that the per capita ecological
deficit of Shaanxi Province may be larger. In
addition, indicators such as ecological stress index
and ecological diversity index are not introduced in
the paper, and future studies can introduce these
indicators for a more in-depth exploration of natural
capital utilization and sustainable development.
ACKNOWLEDGMENTS
This work was financially supported by the Shaanxi
Provincial Social Science Foundation (2020D045)
and Xi'an social science planning foundation
(2020WL154).
Analysis on The Dynamic Evolution Characteristics of Three-Dimensional Ecological Footprint in Shaanxi Province
295

REFERENCES
Fang, K., Gao, K., Li, H.C. (2013) International
comparison of natural capital use: a three-dimensional
model optimization of ecological footprint. Geogr.
Res., 32: 1657-1667.
Fang, K., Reinout, H. (2012) A review on three-
dimensional ecological footprint model for natural
capital accounting. Prog. Geogr., 31: 1700-1707.
Fang, K. (2013) Ecological footprint depth and size: new
indicators for a 3D model. Acta Ecol. Sinica., 33: 267-
274.
Guo, X.R., Yang, J.R., Mao, X.Q. (2003) Calculation and
analysis of urban ecological footprint: a case study of
Guangzhou. Geogr. Res., 05: 654-662.
Mo, C.X., Zhao, S.T., Ruan, Y.L., Mo, X.X., Sun, G.K.,
Huang, Y. (2020) Spatial-temporal variation of water
ecological characteristic of Guangxi Zhuang
Autonomous Region and its driving factors based on
ecological footprint model. Water. Conserv., 40: 297-
302+311.
Niccolucci, V., Galli, A., Reed, A., Neri, E., Wackernagel,
M., Bastianoni, S. (2011) Towards a 3D national
ecological footprint geography. Ecol. Model., 222:
2939-2944.
Niccolucci, V., Bastianoni, S., Tiezzi, E.B.P., Wackernagel,
M., Marchettini, N. (2009) How deep is the footprint?
A 3D representation. Ecol. Model., 220: 2819-2823.
Rees, W.E. (1992) Ecological footprints and appropriated
carrying capacity: what urban economics leaves out.
Environ. Urban., 4: 121-130.
Shi, L., Zhou, H.R. (2017) Analysis of spatio-temporal
change and driving force of ecological footprint in
Bazhou from 2009 to 2014. Environ. Sci. Technol., 40:
311-316.
Wackernagel, M., Onisto, L., Bello, P., Linares, A.C.,
Falfán, I.S.L., Garcı
́
a, J.M., Guerrero, A.I.S., Guerrero,
M.G.S. (1999) National nature capital accounting with
the ecological footprint concept. Ecol. Econ., 29: 375-
390.
Wu, J.S., Li, K.Y., Zhao, H.Y. (2020) The use of land
natural capital in the Guanzhong region based on a
revised three-dimensional ecological footprint model.
Prog. Geogr., 39: 1345-1355.
Wang, R.J., Yan, F., Zhang, X.L. (2020) Spatiotemporal
variations of ecological carrying capacity in Ordos
Plateau during 2000-2015. Bul. Soil. Water. Conserv.,
40: 91-98+107+2.
Xu, Z.M., Zhang, Z.Q., Cheng, G.D. (2000) The calculation
and analysis of ecological footprints of Gansu Province.
J. Geogr., 55: 607-616.
Zhang, Y.Y. (2019) Research on water resources carrying
capacity of Tangshan City based on 3D ecological
footprint model. Water. Resour., 01: 23-26.
Zheng, D.F., Liu, X.X., Wang, Y.Y., Lv, L.T. (2018)
Spatiotemporal evolution and driving forces of natural
capital utilization in China based on three-dimensional
ecological footprint. Prog. Geogr., 37: 1328-1339.
ICPDI 2022 - International Conference on Public Management, Digital Economy and Internet Technology
296
