
Research on the Discovery of Timing Causal Structure in Epidemic
Prevention and Control
Tengjiao Mao, Chunxiao Cai, Yue Lu
*
, Ruihua Wang and Wei Liu
Center for Strategic Assessment and Consulting, AMS, Beijing 100097, China
∗
Corresponding author
Keywords: Epidemic Prevention and Control, Timing Causation, Dimensionality Reduction, Convergence.
Abstract: Decision-makers need to timely and accurately identify departments with unfavorable handling based on the
effect of epidemic prevention and control, which requires the construction of a timing causal structure between
departments. In consideration of a large number of departments and influencing factors involved, traditional
algorithms are more costly to construct causal structures. In this paper, the departments involved in epidemic
prevention and control and related factors are analyzed. A causality analysis framework based on Bayesian
networks is proposed. The dimensionality of data is reduced based on time-varying characteristics. Bayesian
network structure learning algorithms are used to build a structural model based on timing causality. The
results of the simulation case show that the method takes the advantage of fast convergence and accurate
causality.
1 INTRODUCTION
Inferring causal relationships between things is a hot
topic in the study of data relationships. Causal infer-
ence methods, as the main means of causality re-
search, have been widely used in the fields of policy
evaluation, fault diagnosis, biomedicine, etc. For ex-
ample, researchers have applied causal inference
models in disease diagnosis, biological network infer-
ence, and drug efficacy analysis in the biomedical
field (Sesia, 2020; Shen, 2020; Zhou, 2010; Dong,
2014; Cai, 2013; Liu, 2014). In the field of communi-
cation and industry, some scholars have applied
Bayesian networks to fault diagnosis and perfor-
mance optimization studies of networks (Hao, 2016;
Trave-Massuyes, 1997; Hu, 2013). In the field of so-
cial networks, researchers have tried to use causal dis-
covery models to study the causal relationships of
user behaviors (Ver Steeg, 2012; Duan, 2013; Sun,
2014; Sun, 2015).
Exploring the causal relationship between various
departments in epidemic prevention and control is
also needed. Especially in the case of poor prevention
and control, a higher degree of accuracy and timeli-
ness is required to trace the problem and allocate re-
sponsibility, so that the relevant departments can be
targeted to rectify and effectively curb the spread of
the epidemic on time. Therefore, it is relevant to re-
search the discovery method of the causal structure of
departments in epidemic prevention and control
based on timing multidimensional data.
The widely used causal inference methods are
mainly divided into Rubin's potential outcome model
and Pearl's SCM (structure causal model). Causal
structure discovery methods mainly rely on causal
structure learning models, which are mainly classified
as conditional independence constraint-based meth-
ods (Pearl, 2009; Le, 2016; Cai, 2011; Tu, 2019) and
scoring-based methods (Ramsey, 2017; Huang, 2018;
Zheng, 2018). Conditional independence constraint-
based methods learn the causal structure by judging
the independence and conditional independence in-
formation between nodes, and typical algorithms are
the PC (Peter-Clark) algorithm and IC (Inductive
Causation) algorithm. Scoring-based methods dis-
cover causal structures by scoring them based on ob-
served data, typical methods are GES (Greedy equiv-
alence search) and FGES (fast greedy equivalence
search).
However, there are many departments and emer-
gencies involved in epidemic prevention and control,
and the factors that affect the handling capabilities of
departments result in large changes in the timing epi-
demic prevention results. To accurately learn the
causal structure among departments, a great amount.
386
Mao, T., Cai, C., Lu, Y., Wang, R. and Liu, W.
Research on the Discovery of Timing Causal Structure in Epidemic Prevention and Control.
DOI: 10.5220/0011737900003607
In Proceedings of the 1st International Conference on Public Management, Digital Economy and Internet Technology (ICPDI 2022), pages 386-392
ISBN: 978-989-758-620-0
Copyright
c
2023 by SCITEPRESS – Science and Technology Publications, Lda. Under CC license (CC BY-NC-ND 4.0)

Figure 1: Diagram of epidemic prevention and control based on timing changes.
of multi-dimensional timing sample data is required.
The learning cost is too high if traditional algorithms
are used directly. To solve the above problems, the
key elements in epidemic prevention and control are
analyzed and summarized. The dimensionality of the
data is reduced based on the timing change character-
istics. Timing causal structures are constructed
through scoring-based learning algorithms. Finally,
simulated data are utilized to verify the effectiveness
of the algorithm. The simulation results indicate that
the proposed algorithm can effectively reduce the di-
mensionality of data, which results in faster conver-
gence speed and lower learning costs
2 CONSTRUCTION OF
MULTI-DIMENSIONAL
TIMING NODE CAUSAL
STRUCTURE DISCOVERY
MODEL
2.1 Analysis of Key Departments and
Influencing Factors
A city's emergency plan for epidemic prevention and
control is taken as an example in the paper (Shanghai
municipal health commission, 2020). The depart-
ments mainly involved in epidemic prevention and
control include the Health Commission, the publicity
departments, the grassroots communities, hospitals,
and the disease control departments. Their main func-
tions in epidemic prevention and control are summa-
rized as follows.
The Health Commission is responsible for formu-
lating disease prevention plans and immunization
plans, and implementing intervention measures for
public health problems which endanger people’s
health.
The publicity department is responsible for publi-
cizing epidemic prevention policies, monitoring and
controlling online public opinion, etc.
The hospital is responsible for treating patients
and assisting in disease testing and virus elimination.
The disease control department is responsible for
epidemiological investigation of cases, case closure
and virus elimination efforts.
The grassroots community is responsible for mon-
itoring the health of people in the community, regu-
larly organizing disease screenings, and conducting
preliminary disposition, reporting, and prevention
and control once cases are detected.
Research on the Discovery of Timing Causal Structure in Epidemic Prevention and Control
387
The departments above all play an important role
in epidemic prevention and control. When emergen-
cies come, each department needs to handle the situ-
ation individually or collaboratively. There are also
many factors that affect the handling ability of depart-
ments, including operational capability, epidemic
handling attitude, epidemic handling quantity, epi-
demic disposal time, and severity of the epidemic.
With the change of time and the influence of various
factors, the handling capacity of each department will
not always remain the same. Changes in handling ca-
pacity will affect the result of epidemic prevention
and control, as shown in Fig.1.
Because of the great number of departments and
factors involved and the timing change, it is necessary
to construct a causal structure to timely discover the
influence relationship among departments.
2.2 Algorithm Model Construction
In Pearl's structural causal model (Pearl, 2009), a
DAG (directed acyclic graph) is used to construct the
causal structure. In this paper, departments and pre-
vention results are used as variable nodes.
Take the simplest case as an example. The han-
dling capacity of departments is influenced by the
above five factors., and it is assumed that each factor
has only two states which are denoted as 0 and 1 re-
spectively at moment
t
. The state of the node repre-
sented by each department at that moment has
5
2
possible values which are noted as binary from 00000
to 11111. As an outcome node, the epidemic preven-
tion result is usually measured by the number of in-
fected people at moment
t
.
Each node takes 5 factors into consideration, re-
sulting in an excessive number of possible values. It
will greatly reduce the efficiency of the structure
learning algorithm if the causal structure is learned in
this way. It is necessary to improve the model and re-
duce the dimensionality of the data. The specific di-
mensionality reduction method is as follows.
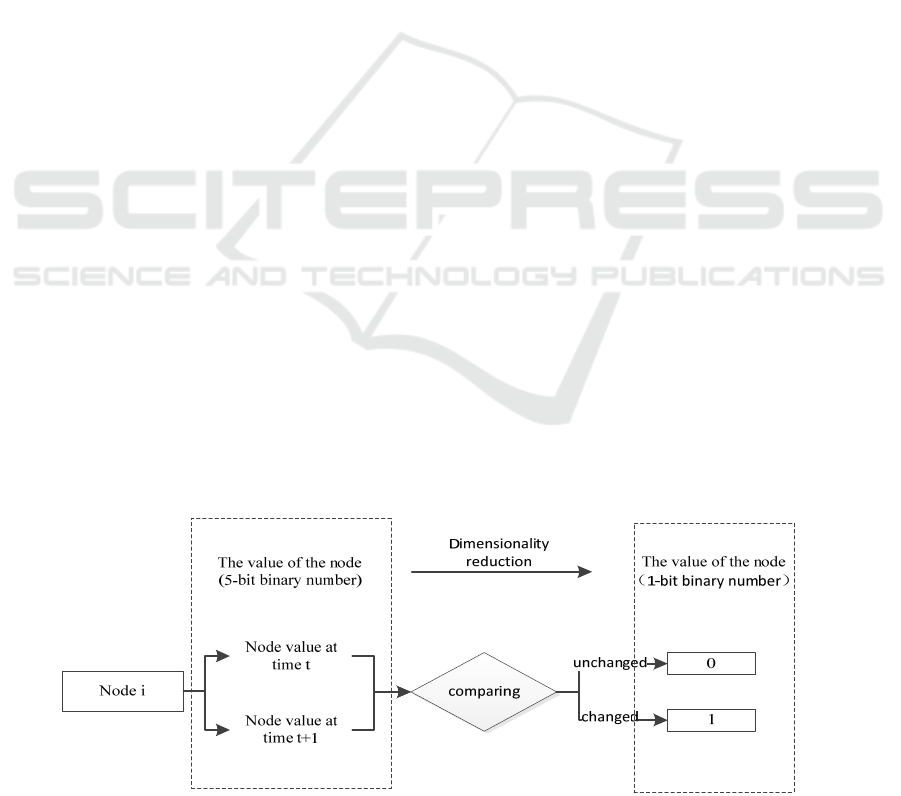
In the original data, a 5-bit binary number is taken
to represent the value of the node state. The state of
each node at different times is counted, and the state
of nodes at two adjacent moments is compared. If the
value of node state remains unchanged, it is recorded
as 0, and if the value of node state changes, it is rec-
orded as 1. Therefore, 1-bit binary number can be
used to represent the state changes of department
nodes in the adjacent periods, so as to realize the di-
mension reduction of the number of department node
values, as is shown in Fig.2. Considering the changes
in epidemic prevention results, when the number of
infected people increases, it can be considered that the
prevention results have become worse (recorded as -
1); when the number of infected people falls, the pre-
vention results can be considered better (recorded as
1); when the number of infected people remains un-
changed, the prevention results can be considered un-
changed (recorded as 0).
As time advances, multiple sets of data on node
state changes will be formed. Finally, according to the
dimensionality-reduced data, the corresponding
causal graph is derived with a score-based Bayesian
structure learning algorithm.
3 SIMULATION VERIFICATION
To verify the validity of the model in this paper, the
causal structure between departments is preset in the
context of epidemic prevention and control in a city,
and the timing change data is generated according to
this structure. Based on the generated data, the tradi-
tional learning algorithm and proposed algorithm are
utilized to learn the causal structure separately, and
the learning results and costs are compared and ana-
lyzed to verify the validity of the algorithm.
Figure 2: Diagram of node value dimensionality reduction.
ICPDI 2022 - International Conference on Public Management, Digital Economy and Internet Technology
388

The simulation flow is shown in Fig.3.
Figure 3: The diagram of simulation flow.
Figure 4: summarized causal structure.
3.1 Data Generation and
Dimensionality Reduction
According to the contents of the emergency manage-
ment plan and work measures for municipal epidemic
prevention and control (Shanghai municipal health
commission, 2020), the influence relationship be-
tween departments and the epidemic prevention result
is qualitatively summarized as shown in Fig.4.
Different moments are divided evenly in enough
time. At each moment, the state of each node is gen-
erated with a certain conditional probability accord-
ing to the influence relationship in Fig.4. In this way,
the state value (5-bit) of each node is generated as
sample data. Assuming that the sample data at each
moment belongs to independent and identical distri-
bution, multiple sets of simulated data are generated
in this way. Traditional algorithms perform causal
structure learning based on this data.
Research on the Discovery of Timing Causal Structure in Epidemic Prevention and Control
389

The dimensionality of the simulated data is re-
duced with the proposed algorithm. And multiple sets
of node state change data (1-bit) for different time pe-
riods are formed. The proposed algorithm learns the
causal structure based on the data.
3.2 Criteria For Comparison of Results
In order to measure the difference between the pro-
posed algorithm which learns after dimensionality re-
duction and the traditional algorithm, the results are
compared and analyzed in terms of learning effect
and learning cost.
The learning cost is measured by the size of sam-
ples and the time used for learning. The sample size
plays an important role in the result of causal structure
learning, and the accurate structure always cannot be
obtained with little data. Theoretically, the more sam-
ple data is learned, the more accurate the learned
causal structure will be. When a certain amount of
sample data is exceeded, the learned causal structure
will not change. It can be considered that the algo-
rithm has converged and learning has completed. The
size of samples and the learning time is used as the
learning cost when the algorithm converges.
When the algorithm has converged, the effect of
learning is measured by the similarity between the
learned causal structure and the actual causal struc-
ture. If the structure in Fig.4 is assumed to be the ac-
tual causal structure, comparing the causal structure
at the time of algorithm convergence with the causal
structure in Fig.4, it can be concluded that a higher
degree of similarity represents a more accurate
learned causal structure. In order to quantify the de-
gree of similarity between two causal structures, the
concept of Structural Relevance is defined.
Structural Relevance
R
(Adler, 2010): Struc-
tural Relevance quantitatively characterizes the de-
gree of similarity between two causal structures. The
causal structure can be transformed into the form of a
matrix. If there are
n
nodes in the causal structure,
it can be represented by a
×nn
matrix. When node
i
in the causal structure has an arrow pointing to the
node
j
(node
i
is the cause of node
j
), the
value
()
,i
j
in the corresponding matrix is 1, other-
wise, it is 0. Taking the actual causal structure as an
example, the schematic diagram of its causal structure
transformed into a matrix is shown in Fig.5. Then, the
degree of similarity of two causal structures can be
expressed in terms of the similarity of two matrices.
The matrix transformed by the actual causal structure
is denoted as
A
, and the matrix transformed by the
matrix obtained from learning is denoted as
B
. The
specific formula for the structural correlation
R
is
as follows.
()
()
()
()
2
2
−−
=
−−
nn nn
nn
nn nn
nn nn
AABB
R
AA BB
A
(or
B
) is equivalent to averaging the value of
all elements in
A
(or
B
), and
n
is the matrix
rank. The closer the value
R
is to 1, the more simi-
lar the two structures are meant to be. When
1=
R
, it
indicates that the actual causal structure is learned.
Figure 5: Schematic diagram of the actual causal structure
transformation matrix.
3.3 Results Display and Analysis
With the traditional algorithm and the proposed algo-
rithm in this paper, the correct causal structure ob-
tained after the final algorithm convergence is shown
in Fig.6.
ICPDI 2022 - International Conference on Public Management, Digital Economy and Internet Technology
390
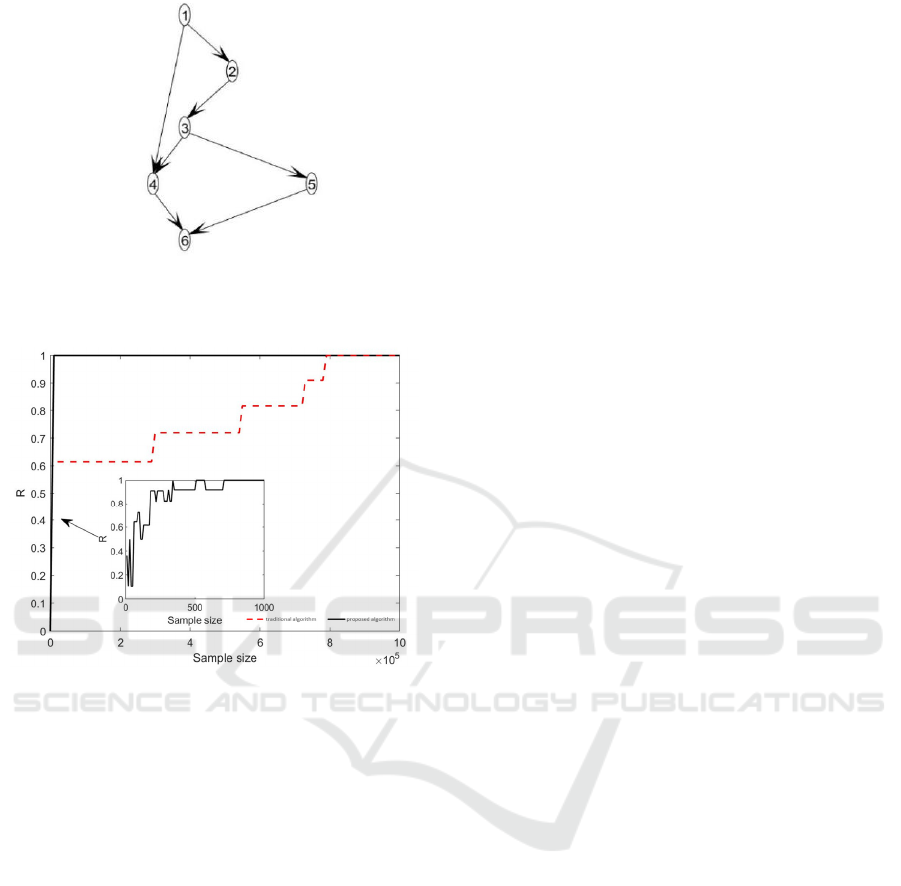
Figure 6:Learned causal structure.
The convergence of the algorithm is shown in Fig.7.
Figure 7: The diagram of algorithm convergence.
Both methods learned the actual causal structure
from Fig.6. But there are significant differences in
learning cost. According to Fig.7, 800000 samples are
required for the traditional algorithm to learn the ac-
tual causal structure. While for the proposed algo-
rithm, only 800 samples are needed to learn the actual
causal structure. The size of samples learned by this
algorithm is reduced by 1000 times. From the per-
spective of learning time, the convergence time of the
traditional algorithm is 11250s, while the conver-
gence time of the proposed algorithm is 10s. The time
cost is reduced by 1125 times.
It can be seen that the proposed algorithm learns
an accurate causal structure based on the simulated
data, and greatly outperforms the traditional algo-
rithm in terms of time cost and the size of samples,
which verifies the advantages and effectiveness of the
proposed algorithm. When using real data, this
method is equally applicable and advantageous.
4 CONCLUSION
In order to construct an accurate causal structure and
reduce the cost of learning, the dimension of timing
data is reduced based on the changing features and the
causal structure is constructed through the structural
learning algorithms in this paper. The proposed algo-
rithm and the traditional algorithm are compared in
learning effect and cost with an example. The pro-
posed algorithm takes the advantage of fast conver-
gence and accurate causality. However, the size of
samples required by the proposed algorithm is still
considerable in actual needs, so the size of samples
required for learning needs to be further reduced in
the next research to achieve better results.
REFERENCES
Adler J, Parmryd I. Quantifying colocalization by correla-
tion: The Pearson correlation coefficient is superior to
the Mander's overlap coefficient[J]. Cytometry Part A,
2010, 77a(8):733-742.
Cai R, Zhang Z, Hao Z. BASSUM: A Bayesian semi-super-
vised method for classification feature selection[J]. Pat-
tern Recognition, 2011, 44(4): 811-820.
Cai R, Zhang Z, Hao Z. Causal gene identification using
combinatorial V-structure search[J]. Neural Networks,
2013, 43: 63-71.
Dong G, Wang Y, Zhang Q, et al. The methodology of Dy-
namic Uncertain Causality Graph for intelligent diagno-
sis of vertigo[J]. Computer Methods and Programs in
Biomedicine, 2014, 113(1):162-174.
Duan P, Yang F, Chen T, et al. Direct causality detection
via the transfer entropy approach[J]. IEEE Transactions
on Control Systems Technology, 2013, 21(6): 2052-
2066.
Hao Z, Chen W, Cai R, et al. Performance optimization of
wireless network based on canonical causal inference
algorithm [J]. Journal of Computer Applications, 2016,
36(8): 2114-2120.
Hu Y, Zhang X, Ngai E W T, et al. Software project risk
analysis using Bayesian networks with causality con-
straints[J]. Decision Support Systems, 2013, 56: 439-
449.
Huang B, Zhang K, Lin Y, et al. Generalized score func-
tions for causal discovery[C]//Proceedings of the 24th
ACM SIGKDD International Conference on
Knowledge Discovery&Data Mining, 2018:1551-1560.
Le T, Hoang T, Li J, et al. A fast PC algorithm for high
dimensional causal discovery with multi-core PCs[J].
IEEE/ACM Transactions on Computational Biology
and Bioinformatics, 2016, 16(5): 1483-1495.
Liu M, Cai R, Hu Y, et al. Determining molecular predic-
tors of adverse drug reactions with causality analysis
based on structure learning[J]. Journal of the American
Medical Informatics Association, 2014, 21(2): 245-251.
Research on the Discovery of Timing Causal Structure in Epidemic Prevention and Control
391

Pearl J. Causality: models, reasoning and inference[M].
Cambridge University Press, 2009: 107-173.
Ramsey J, Glymour M, Sanchez-Romero R, et al. A million
variables and more: the Fast Greedy Equivalence
Search algorithm for learning high-dimensional graph-
ical causal models, with an application to functional
magnetic resonance images[J]. International Journal of
Data Science and Analytics, 2017, 3(2): 121-129.
Sesia M, Katsevich E, Bates S, et al. Multi-resolution local-
ization of causal variants across the genome[J]. Nature
Communications, 2020, 11(1):1-10.
Shen X, Ma S, Vemuri P, et al. Challenges and opportuni-
ties with causal Discovery Algorithms: Application to
Alzheimer's pathophysiology[J]. Scientific Reports,
2020. 10(1):1-12.
Sun J, Bollt E M. Causation entropy identifies indirect in-
fluences, dominance of neighbors and anticipatory cou-
plings[J]. Physica D: Nonlinear Phenomena, 2014, 267:
49-57.
Sun J, Taylor D, Bollt E M. Causal network inference by
optimal causation entrop[J]. SIAM Journal on Applied
Dynamical Systems, 2015, 14(1):73-106.
Shanghai municipal health commission. Shanghai Special
Emergency Response Plan for Public Health Emergen-
cies[Z]. 2020-05-11.
Trave-Massuyes L, Mime R. Gas-turbine condition moni-
toring using qualitative model-based diagnosis[J]. IEEE
Expert, 1997, 12(3): 22-31.
Tu R, Zhang C, Ackermann P, et al. Causal Discovery in
the Presence of Missing Data[C]//The 22nd Interna-
tional Conference on Artificial Intelligence and Statis-
tics, 2019: 1762-1770.
Ver Steeg G, Galstyan A. Information transfer in social me-
dia[C]//Proceedings of the 21st international conference
on World Wide Web. ACM, 2012: 509-518.
Zhou T, Wang Y. Causal relationship inference for a large-
scale cellular network[J]. Bioinformatics, 2010, 26(16):
2020-2028.
Zheng X, Aragam B, Ravikumar P, et al. DAGs with NO
TEARS: continuous optimization for structure learn-
ing[C]//Proceedings of the 32nd International Confer-
ence on Neural Information Processing Systems, 2018:
9492-9503.
ICPDI 2022 - International Conference on Public Management, Digital Economy and Internet Technology
392
