
Smart Traffic Light Design Based on Histogram of Oriented Gradient
and Support Vector Machine
Yuliadi Erdani, Hendy Rudiansyah and Zahra Dhiyah Nafisa
Politeknik Manufaktur Bandung, Jalan Kanayakan 21, Dago, Coblong, Bandung, Indonesia
Keywords: Traffic Light, HOG, SVM, Webster, NodeMCU.
Abstract: Traffic congestion is one of the frequent problems in big cities, especially at intersections. Congestion occurs
because the setting time of traffic lights installed still using the fixed timing without consider to the ups and
downs of vehicle density that have the potential to cause congestion. To reduce these problems, the traffic
light timing system must be in accordance with the circumstances in each intersection path. In this study, a
traffic light simulation was made using the Histogram of Oriented Gradient (HOG) and Support Vector
Machine (SVM) methods to detect vehicles that would determine the level of vehicle density. Webster method
used to determine the duration of the traffic light based on the parameters of the density of vehicle. The output
of this simulation is in the form in traffic light prototype that is controlled by NodeMCU and monitored by
an application.
1 INTRODUCTION
Traffic congestion is one of the problems that often
occurs in big cities and generally occurs at road
intersections. The number of vehicles that continues
to increase from year to year, the growing population,
the imbalance between traffic demand and
transportation infrastructure, and the inability of
traffic management to control and reduce traffic flow
are one of the main causes of congestion. (Hartanti et
al., 2019). The right way to control traffic congestion
is by using traffic lights. (Mohanaselvi & Shanpriya,
2019). However, the use of traffic lights does not
always solve traffic congestion problems. In one
situation, the traffic light will be very helpful in the
smooth flow of traffic, but in another situation, it will
make the traffic jam worse. (Toar-lumimuut et al.,
2015). A common example is congestion during peak
hours, i.e. in the morning and evening. This
congestion occurs because the traffic light timing
settings used today still apply a conventional or fixed-
cycle traffic light (FCTL) timing system or
fixed/static red and green light durations without
considering real-time road conditions, such as vehicle
density in each lane of the intersection. (Ng & Kwok,
2020), (Siswipraptini et al., 2018). Such timing will
lead to the accumulation of vehicles on one side of the
intersection and is very prone to causing congestion.
With the different density levels at the intersection, a
smart traffic light cycle timing system is needed,
which can adjust the cycle time automatically.
Several studies have been conducted to overcome
these problems. Fibrilianty et.al, have made a traffic
light timing system based on vehicle density
detection using the Histogram of Oriented Gradient
(HOG) method. The output of this simulation is a
Traffic Light prototype that has been designed on
Arduino which is connected to a program that has
been designed in Matlab. Simulation of Trafic light
timings designed to get more efficient system
performance results compared to traffic lights with
automatic timers in general. (Fibriliyanti et al.,
2017). Another study designed an application using
MATLAB 2009a Software and Digital Camera as
processing and input of traffic light images to detect
density using the bwarea method. The results of this
system can determine the length of time the green
light is on based on the density of the road section.
(Toar-
lumimuut et al., 2015). Noval, C. et.al have
conducted
research on traffic light optimization using
the webster method. In this study, the webster
method is able to optimize traffic cycle time based on
vehicle density detection using infrared sensors.
(Noval et al., 2018).
The purpose of this research is to create a
simulation of a miniature traffic light that works
adaptively, namely a traffic light that adjusts the
176
Erdani, Y., Rudiansyah, H. and Nafisa, Z.
Smart Traffic Light Design Based on Histogram of Oriented Gradient and Support Vector Machine.
DOI: 10.5220/0011738000003575
In Proceedings of the 5th International Conference on Applied Science and Technology on Engineering Science (iCAST-ES 2022), pages 176-181
ISBN: 978-989-758-619-4; ISSN: 2975-8246
Copyright © 2023 by SCITEPRESS – Science and Technology Publications, Lda. Under CC license (CC BY-NC-ND 4.0)
duration of the green light based on vehicle density
conditions in each lane.
2 RESEARCH METHODS
The system will control the work of the traffic light
by detecting the level of density in each lane of the
intersection, then the results of density detection will
determine the duration of the green light, where if the
lane is in a congested condition, the duration of the
green light will be longer than the free lane.
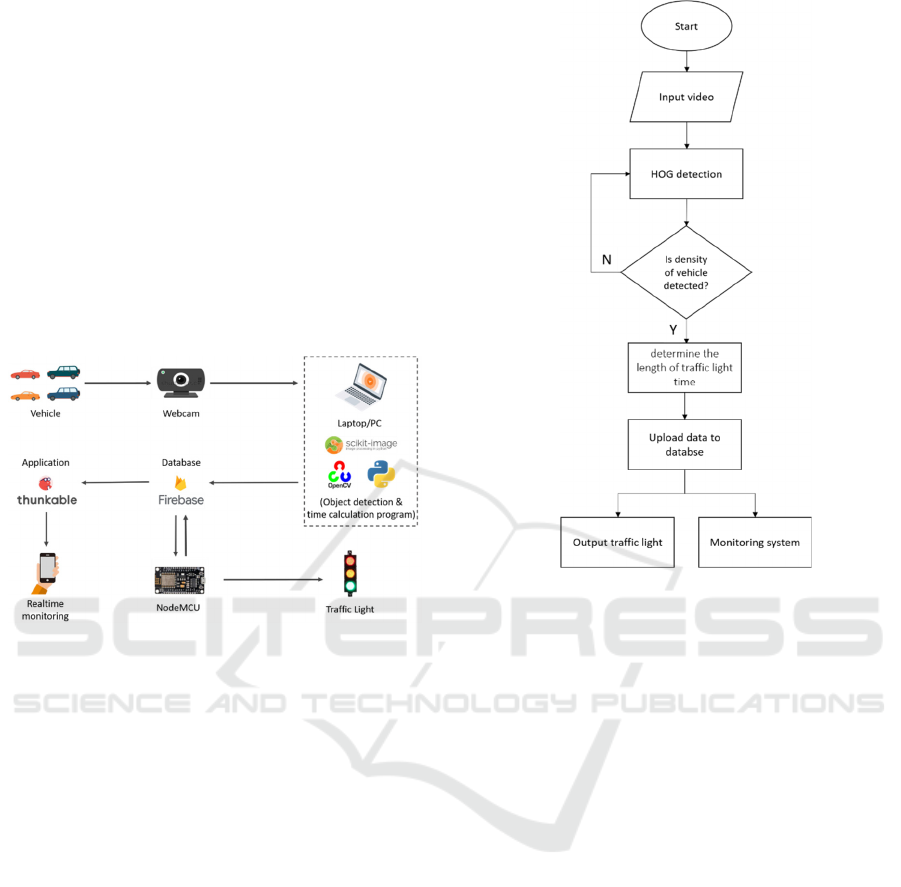
2.1 System Overview
Figure 1: System Overview.
In Figure 1 above, the general system is explained,
the first stage is image capture at a miniature traffic
light intersection using a webcam camera. The
captured image is then processed by the OpenCV
library programmed on a laptop/PC. The image is
processed to detect the level of vehicle density at the
traffic intersection using the HOG and SVM methods.
The detected vehicle density level will then determine
the length of time the traffic light works. based on the
webster method, and will activate the traffic light
according to the calculated time length and display it
on the application for the monitoring system.
2.2 System Flowchart
Figure 2 shows how the smart traffic light system
works. The camera will start working since the
system starts operating, then the camera will detect
the level of vehicle density using the HOG and SVM
methods. If the detected image is able to determine
the level of density, the system will continue to
Figure 2: System Flowchart.
process it for setting the length of time the traffic light
works based on the level of vehicle density that has
been detected. Next, the system will send the data that
has been obtained to the database. The data stored in
the database will then be read and will activate the
traffic light based on the data read in the database. The
data in the database will also be read for the
monitoring system on Android.
2.3 Domain Spesific Design
This specific domain design is a breakdown of the
specific system design of each domain.
2.3.1 Mechanical Domain Design
The design scheme of the miniature traffic
intersection is made using a two-lane traffic
intersection with a two-phase traffic light
arrangement. There are two cameras installed towards
each lane at the intersection and two traffic light
modules are used as system outputs and a TM1637
module as a display to show the length of time the
green light is on.
Smart Traffic Light Design Based on Histogram of Oriented Gradient and Support Vector Machine
177
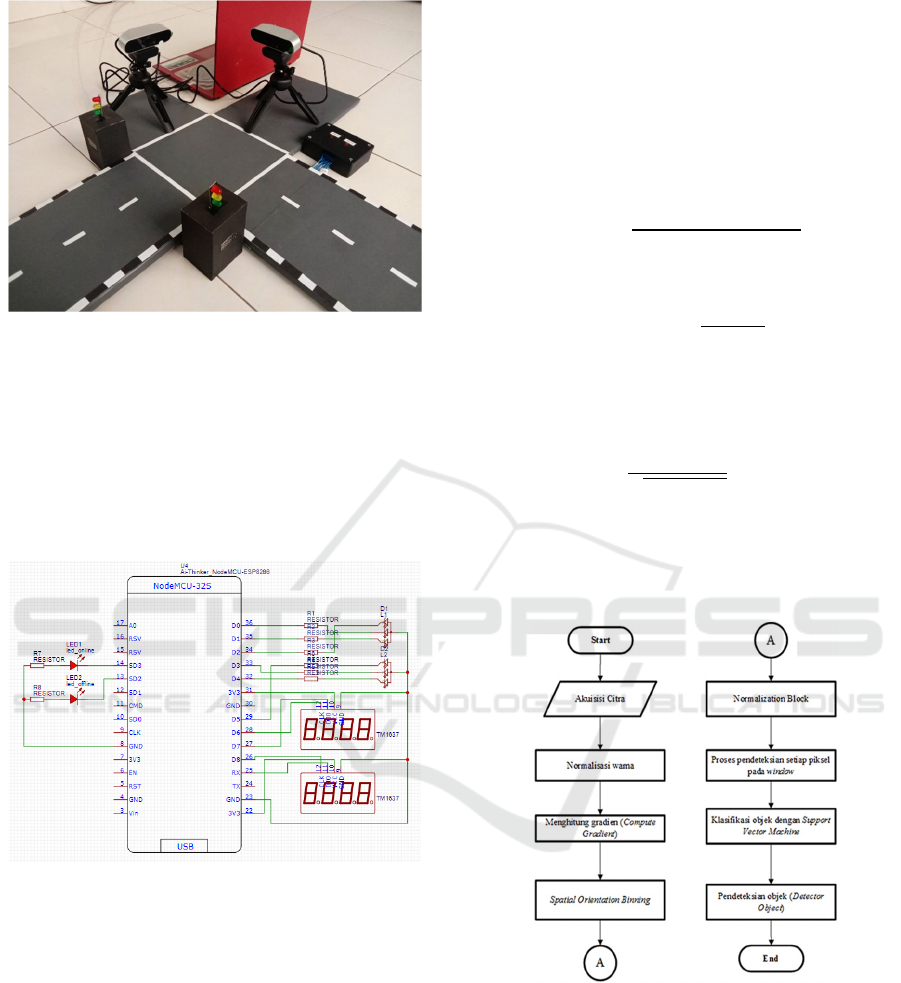
Figure 3: Miniature Traffic Light Intersection.
2.3.2 Electric Domain Design
The electrical design will be made of components
according to the needs of the tool. NodeMCU is used
as a microcontroller, traffic light module, TM1637
display module as an indicator to calculate the green
light timer, and LED as an indicator of online and
offline modes.
Figure 4: Electrical Circuit.
2.3.3 Informatic Domain Design
The vehicle density detection algorithm consists of
five parts:
a. Object Detection System Design
The first stage in making this system is character
extraction on the image data that has been collected
using the HOG method. (Pranoto et al., 2017).
Characteristic extraction is performed on an image
measuring 32x32 pixels. The image piece will be
divided into several overlapping blocks, in which
there are several cells, where each cell is composed
by several pixels. Then, in each cell, the horizontal
and vertical image gradient values are calculated
using the formulas in equations (2.1) and (2.2).
𝑓
𝑥,𝑦
𝐼
𝑥1,𝑦
𝐼𝑥1,𝑦 (2.1)
𝑓
𝑥,𝑦
𝐼
𝑥,𝑦1
𝐼𝑥,𝑦1
(2.2)
After that, the magnitude and orientation values
are calculated using the formulas in equations (2.3)
and (2.4).
𝑚
𝑥,𝑦
𝑓
𝑥,𝑦
𝑓
𝑥,𝑦
(2.3)
𝜃
𝑥,𝑦
𝑡𝑎𝑛
𝑓
𝑥,𝑦
𝑓
𝑥,𝑦
(2.4)
Next, normalization is performed using the
formula in equation (2.5), to avoid value differences
due to lighting differences.
𝑉
𝑉
‖
𝑉
‖
∈
(2.5)
From the calculation results, a histogram will be
built by voting the θ value according to the
predetermined bin value (binning process). Then, the
histogram of all cells in one block will be merged.
Figure 5: Flowchart HOG and SVM method.
Then the data that has been extracted will be
trained using SVM by giving the data class a value of
1 for positive images and -1 for negative images.
From the training results, a model in the .npy format
is produced as a model for the vehicle object detection
process.
In this vehicle object detection process using a
sliding window with each window extracting 32x32
pixel characteristics. The window moves from the top
iCAST-ES 2022 - International Conference on Applied Science and Technology on Engineering Science
178
left corner to the right, and then down by extracting
HOG and SVM process and will produce data in the
form of an image marked with a box indicating that
the boed image is a detected objects/vehicle. The
number of vehicles detected indicates the density
division described in table 1.
Table 1: Density Level Based on Number of Vehicle.
No Number of Vehicle Density Level
1 0 – 3 Low
2 4 – 7 Normal
3 > 7 High
b. Webster Method Timing Design
The Webster method is a concept to determine the
optimal cycle length and calculate the traffic light
time duration based on vehicle density and road
width. Factors that influence the Webster method are
as follows: (Noval et al., 2018)
1) Determine the order and number of phases
2) Determine the saturation flow (s)
Saturation flow (s) is the number of vehicle
departures in the queue when vehicles are at a
constant rate. In Webster's method, the saturation flow
can be estimated based on the road width.
Table 2: Saturation flow by road width.
Road width Saturation flow
3,05 1850
3,35 1875
3,65 1900
3,95 1950
4,25 2075
4,60 2250
4,90 2475
5,20 2700
3) Determine the normal flow (q)
4) Determine the level of traffic flow
5) Calculate the ratio between traffic volume and
saturation flow of each entersection
𝑦𝑖𝑞𝑖/𝑠𝑖
(2.6)
6) Determining lost time
𝐿2𝑛𝑅 (2.7)
7) Determine the optimum cycle time
𝐶0
1,5𝐿5
1𝑌
(2.8)
8) Specifies settings for effective green light
duration
𝐺𝑖
𝑦𝑖𝐶𝑜𝐿
𝑦
(2.9)
c. Database and Output Design
Data from density detection and green light duration
calculations that have been carried out are then sent
to the firebase database in real time. This data is
intended to be read by nodemcu to activate the traffic
light module at the miniature traffic light intersection
and read by the application for the monitoring system.
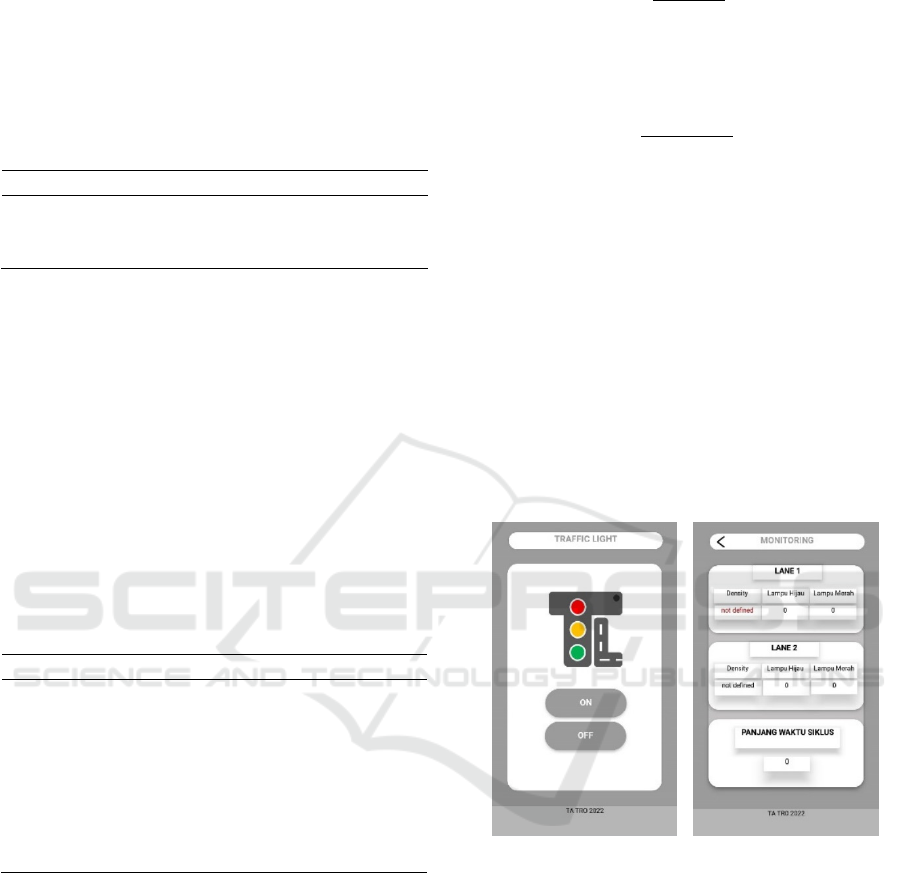
d. Interface Program Design
Figure 6 is a view of the thunkable application that
functions to monitor the system. The data displayed
is the density of each lane and the duration of the
traffic light. (green light, red light, cycle time length).
For the main page there are also buttons to activate
and turn off the system.
Figure 6: Monitoring application.
3 RESULT AND DISCUSSION
The automatic traffic light testing process is carried
out on a miniature traffic light intersection as an image
capture input. Image input is taken using a webcam.
3.1 Testing the Effect of Light
This detection test was conducted to determine the
effect of lighting on the number of vehicles detected.
Smart Traffic Light Design Based on Histogram of Oriented Gradient and Support Vector Machine
179
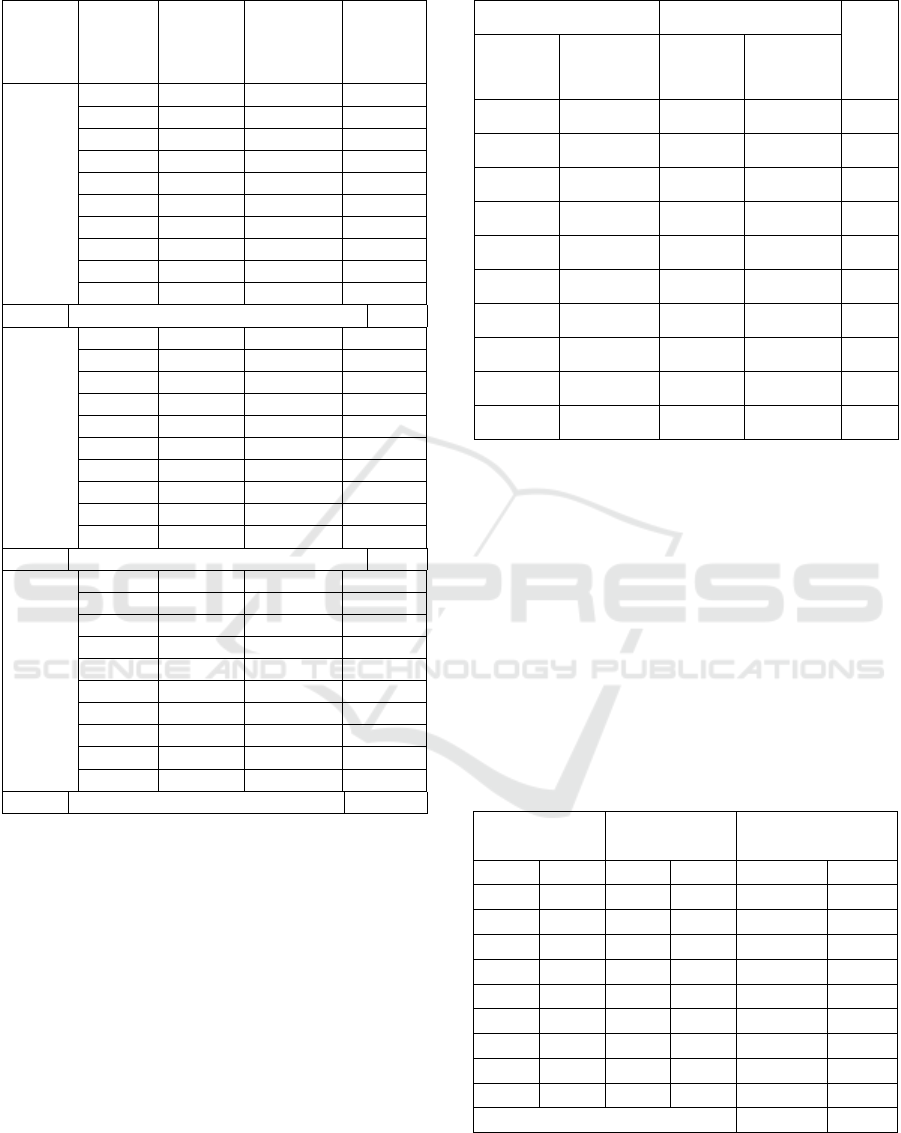
Table 3: Test result for the effect of light.
Light
Actual
Number
of
Objects
Number
of
Detected
Objects
Difference
Error
10000
0 lux
1 1 0
0,00
2 2 0
0,00
3 3 0 0,00
4 4 0
0,00
5 5 0
0,00
6 6 0
0,00
7 7 0
0,00
8 8 0
0,00
9 9 0 0,00
10 8 2
0,20
Average (%) 2,00
200
lux
1 1 0
0,00
2 2 0
0,00
3 3 0
0,00
4 4 0 0,00
5 5 0
0,00
6 6 0
0,00
7 7 0
0,00
8 8 0
0,00
9 8 1
0,11
10 8 2 0,20
Average (%) 3,10
50 lux
1 1 0
0,00
2 2 0
0,00
3 3 0
0,00
4 4 0
0,00
5 5 0 0,00
6 6 0
0,00
7 5 2
0,29
8 6 2
0,25
9 6 3
0,33
10 8 2
0,20
Average (%) 10,07
From the test result in table 3, it can be sees that
the error on detection is higher in 50 lux light
conditions, which is 10,07%. From these result it is
concluded that the system runs better in light
condition >= 200 lux.
3.2 Density Detection Testing
Testing of vehicle density detection is carried out to
ensure that the level of vehicle density in the
observation area scenario can be detected by the
system. The density level description is L for low, N
for normal, and H for high, S for successful and US
for unsuccessful.
Table 4: Density detection test result.
Actual Condition Detection Result
Note
Number
of
Objects
Density
Level
Number
of
Objects
Density
Level
1 L 1 L
S
2 L 2 L
S
3 L 3 L
S
4 N 4 N
S
5 N 5 N
S
6 N 6 N
S
7 N 8 H US
8 H 8 H
S
9 H 9 H
S
10 H 7 N US
Accuracy value = (Correct data/Number of data) * 100% =
(8/10) * 100% = 80%.
From table 4, it can be seen that the system is
able to detect the level of density based on the number
of cars detected with an accuracy rate of 80%.
3.3 Green Light Time Testing
This test is conducted to determine the length of green
light time based on the density of vehicles on lane 1
and lane 2 that have been detected and compare it with
the results of fixed cycle time. L1 for lane 1 and L2
for lane 2.
Table 5: Green light duration test result based on density.
Density
Green Light
Duration (sec)
Cycle Time (sec)
L1 L2 L1 L2 Adaptive Fixed
L L 15 15 41 80
L N 17 21 49 80
L P 18 26 55 80
N L 21 17 49 80
N N 25 25 62 80
N P 28 31 71 80
P L 26 18 55 80
P N 31 28 71 80
P P 36 36 83 80
Total 536 720
From the table 5 above, it is known that the
adaptive traffic light timing runs according to the
density conditions of each lane, where lanes with low
iCAST-ES 2022 - International Conference on Applied Science and Technology on Engineering Science
180

density conditions will get fewer green light than
lanes with normal or high density conditions with a
total cycle time of 536 seconds, less when compared
to the fixed cycle time of 720 seconds.
4 CONCLUSION
Based on the results of design and testing in this final
project, it can be concluded that:
1. The vehicle detection system using the HOG and
SVM methods can work more optimally in
lighting conditions above 200 lux with an average
error of 1.56%.
2. The HOG and SVM methods are able to detect
vehicle density on the path with 80% accuracy.
3. The Webster method is able to optimize the traffic
light cycle time based on the density in each lane.
REFERENCES
Fibriliyanti, Y., Faradila, L. R., & Taqwa, A. (2017).
Implementasi Pengolahan Citra dengan Metode
Histogram of Oriented Gradient (HOG) untuk
Pengaturan Waktu pada Traffic Light Berdasarkan
Deteksi Kepadatan Kendaraan. Prosiding SNATIF, 35–
40.
Hartanti, D., Aziza, R. N., & Siswipraptini, P. C. (2019).
Optimization of smart traffic lights to prevent traffic
congestion using fuzzy logic. Telkomnika
(Telecommunication Computing Electronics and
Control), 17(1), 320–327. https://doi.org/10.
12928/TELKOMNIKA.v17i1.10129
Mohanaselvi, S., & Shanpriya, B. (2019). Application of
fuzzy logic to control traffic signals. AIP Conference
Proceedings, 2112(June). https://doi.org/10.1063/
1.5112230
Ng, S. C., & Kwok, C. P. (2020). An intelligent traffic light
system using object detection and evolutionary
algorithm for alleviating traffic congestion in hong
kong. International Journal of Computational
Intelligence Systems, 13(1), 802–809. https://doi.
org/10.2991/ijcis.d.200522.001
Noval, C., Virgono, I. A., & Saputra, R. E. (2018). Optimasi
Lampu Lalu Lintas Cerdas Menggunakan Metod
Webster Optimization Smart Traffic Light Using
Webster Method. 5(3), 6236–6243.
Pranoto, M. B., Ramadhani, K. N., & Arifianto, A. (2017).
Face Detection System Menggunakan Metode
Histogram of Oriented Gradients ( HOG ) dan Support
Vector Machine ( SVM ) Face Dtection System using
Histogram of Oriented Gradients ( HOG ) Method amd
Support Vector Machine ( SVM ). E-Proceeding of
Engineering, 4(3), 5038–5045. https://openlibrary
publications.telkomuniversity.ac.id/index.php/enginee
ring/article/view/5441
Siswipraptini, P. C., Martono, W. H., & Hartanti, D. (2018).
Reducing a congestion with introduce the greedy
algorithm on traffic light control. Journal of Physics:
Conference Series, 974(1). https://doi.org/
10.1088/1742-6596/974/1/012013
Toar-lumimuut, Tolah, R. E. P., Sengkey, R., & Rindengan,
Y. D. Y. (2015). Perancangan Simulasi Otomatis
Traffic light Menggunakan Citra Digital Studi Kasus.
E-Journal Teknik Elektro Dan Komputer, 4(4), 35–45.
Smart Traffic Light Design Based on Histogram of Oriented Gradient and Support Vector Machine
181
