
An Empirical Study of Volatility Spillover Effects between
International Crude Oil Futures and Russian and Chinese Stock
Markets: A Multivariate BEKK-GARCH Model based on
Wavelet Multi-Resolution Analysis
Chengchen Hu and Wenhao Ai
*
SILC Business School, Shanghai University, China
Keywords: International Crude Oil Futures, Russian and Chinese Stock Markets, Volatility Spillover Effects, Wavelet
Multi-Resolution Analysis, Multivariate BEKK-GARCH Model.
Abstract: The strategic position of oil determines the high impact of crude oil on the macro economy. The volatility of
crude oil futures prices affects the stock market, and China and Russia are typical representatives of crude oil
importers and exporters respectively. This paper focuses on empirically studying the volatility spillover
effects of international crude oil futures and the Chinese and Russian stock markets. This paper selects data
on international crude oil futures prices, China-Russia stock market composite index and sectoral stock
indices for the period from 24 April 2015 to 20 April 2018. The empirical results show that all industry stock
indices are cointegrated with international crude oil futures prices, and the adjustment coefficients of
international crude oil futures prices on the volatility of other industry stock indices are insignificant, except
for CSI Industrial and Russian Energy.
1 INTRODUCTION
China is extremely dependent on imported crude oil
and Russia is currently the world's largest crude oil
reserve, which means that fluctuations in
international crude oil prices will have a significant
impact on the Chinese and Russian economies. Crude
oil futures, which reflect the spot price, to some
extent influence the stock market, which reflects the
economic situation. Currently, there is a very limited
literature that examines the impact of international
crude oil futures prices on both composite and
sectoral stock indices. This paper investigates the
volatility spillover effects of international crude oil
futures prices on Chinese and Russian composite and
sectoral stock indices, and examines the linkage
between crude oil and stock markets by comparing
the effects of international crude oil futures prices on
Chinese and Russian stock markets.
In this paper, different empirical models are used
for further analysis according to the characteristics
exhibited by the variable groups in the test to ensure
the reliability of the results. In this paper, the
international crude oil futures price is selected as the
explanatory variable, and the Chinese and Russian
stock market composite indexes and sector indices
are selected as the explanatory variables to establish
the corresponding variable groups. The test finds that
all the data are not smooth, so this paper proposes two
options: (1) to make first-order difference on the
original data, establish VAR model and GARCH
model, after that, the international crude oil futures
price is wavelet transformed and multi-resolution
processed, establish BEKK-GARCH model, and
judge whether there is volatility spillover effect
according to the Wald test results; (2) to make
cointegration test on the original data and on the basis
of this, Granger causality test results are used to
divide the variable groups and establish VECM and
ECM models respectively.
2 LITERATURE REVIEW
Most of the studies on the linkage between
international crude oil futures and stock market in the
established literature are based on stock pricing
models. Huang, Masulis and Stoll (1996) suggest that
changes in international crude oil futures prices have
an impact on discount rates and firms' future cash
flows. Leblanc and Chinn (2004) argue that the effect
of international crude oil futures prices on inflation is
choppy. Early studies on the linkage between
438
Hu, C. and Ai, W.
An Empirical Study of Volatility Spillover Effects Between International Crude Oil Futures and Russian and Chinese Stock Markets - A Multivariate BEKK-GARCH Model Based on Wavelet
Multi-Resolution Analysis.
DOI: 10.5220/0011739500003607
In Proceedings of the 1st International Conference on Public Management, Digital Economy and Internet Technology (ICPDI 2022), pages 438-444
ISBN: 978-989-758-620-0
Copyright
c
2023 by SCITEPRESS – Science and Technology Publications, Lda. Under CC license (CC BY-NC-ND 4.0)

international crude oil futures prices and stock
markets did not test for significant results. the multi-
factor model used by Chen, Roll, and Ross (1986)
was a sample of early studies on the impact of
international crude oil futures prices on stock
markets. Since then, Hamao (1990) and Ferson and
Havey (1994) extended the model, but none of the
studies on the U.S. and Japanese stock markets found
a significant effect of international crude oil futures
prices on the stock market. However, Jones and Kaul
(1996) find significant effects of international crude
oil futures prices on the Canadian and U.S. stock
markets. Qian-Min Qi and Hong-Liang Zhu et al.
(2011) and Xi Zhang and Jian-Yu Wang (2013)
found that the fluctuations in international crude oil
prices have a strong and long-lasting impact on the
stock markets of the United Kingdom and the United
States, but a smaller impact on the stock markets of
China and India. Hui Zhang (2013), Shangqi Zhuge
and Xiangchao Hao (2009) find a long-run
cointegration relationship between Chinese stock
market volatility and international crude oil futures
price volatility between 2002 and 2010. Chunying
Zhu (2015) establishes an asymmetric BEKK model
and Wald test to find a two-way volatility spillover
effect between the international crude oil futures
market and the stock market. However, there are
relatively few studies on the impact of international
crude oil futures prices on various sectors of the stock
market. Sadorsky (2001) finds that stock returns of
oil companies are positively correlated with oil
prices, while natural gas companies are negatively
correlated with them. Jie-Nan Lao (2008) finds a
significant positive effect of international crude oil
futures prices on all primary sector indices. However,
Hongfei Jin and Eminent Jin (2010) found that
international crude oil futures prices have a
significant negative effect on the automotive,
construction, and financial sectors, while they have a
significant positive effect on the crude oil and natural
gas sectors by building a GED-GARCH (1,1)-M
model. Using an ARMA-EGARCH-M model for the
period 2009 to 2013, Dandan Dai (2014) finds that an
increase in international crude oil futures prices has a
positive impact on the extractive industries and a
negative impact on the chemical industries, among
others.
Most of the early literature assumed a stable linear
relationship between macroeconomics and
international crude oil futures prices, but studies have
shown that the relationship is nonlinear and
asymmetric. In addition, some literature selects the
composite index as the explanatory variable without
considering the possible correlation between it and
international crude oil futures prices, and when
studying the impact of international crude oil futures
prices on industry stock indices, most of the literature
uses a uniform model to analyze all data without
considering the variability among data, and the
results obtained are prone to bias. At the same time,
many studies only analyze the linkage between
international crude oil futures prices and a country's
stock market. In contrast, this paper studies the
linkage between international crude oil futures prices
and the stock markets of China and Russia, and
investigates the impact of international crude oil
futures prices on the stock indices of both industries.
3 THE IMPACT OF CRUDE OIL
ON THE STOCK
This paper focuses on the macroeconomic and
industry-specific effects on the stock market
respectively, namely how the discount rate changes
and how the future cash flows of firms change when
oil prices fluctuate.
3.1 Impact of Crude Oil Futures Prices
on The Stock Market as A Whole
Crude oil price fluctuations act on the stock market
by trading currencies and influencing the
macroeconomy. The interaction of national monetary
policies affects the trading of crude oil. As the
number of net crude oil importers exceeds the
number of net crude oil exporters, crude oil prices
rise, consumption levels in net importing countries
decrease, the purchasing power of currencies falls,
inflationary pressures rise and the global economy
generally declines.
3.2 Impact of Crude Oil Prices on
Related Industries
In this paper, five industries that are closely linked to
crude oil are selected to analyse the impact of higher
crude oil prices on specific industries. When crude oil
prices rise, it will be good news for crude oil miners
and coal miners in the extractive industry and
negative news for other resource miners; it will have
a negative effect on the manufacturing industry; the
electricity, heat, gas and water production and supply
industry will see an increase in supply costs and a
decrease in corporate profits; companies in the
construction industry will see a decrease in future
cash flows; the transport, storage and postal industry
An Empirical Study of Volatility Spillover Effects Between International Crude Oil Futures and Russian and Chinese Stock Markets - A
Multivariate BEKK-GARCH Model Based on Wavelet Multi-Resolution Analysis
439

will see an increase in operating costs, resulting in
overall profits in the transport industry decline.
4 EMPIRICAL ANALYSIS AND
RESULTS
This paper focuses on the linkages between
international crude oil futures prices and the Russian
and Chinese stock markets, specifically the impact of
international crude oil futures prices on the stock
market composite stock index as well as the stock
market sector stock index, and therefore the
corresponding indicators are selected for the study
respectively. Daily frequency data from April 24,
2015 to April 20, 2018 are used in this paper.
Brent Crude Oil Futures Price is used as the
international crude oil futures price, with data from
wind database, and SHA and RTS are used as the
broad indices of Chinese and Russian stock markets
respectively, data from Bloomberg database.
As for ZZCP, ZZFZ, ZZGY. ZZJZ, ZZJT, ZZNY,
ZZRL, RCP, RFZ, RGY, RJZ, RYS, RNY and RRL,
these specific indexes are gathered from Wind and
Bloomberg.
Firstly, the Jarque-Bera test was performed on the
17 variables mentioned above, and the correlation
statistics showed that the subjects were characterised
by "spikes and thick tails", which did not follow a
normal distribution and had a wide range of
fluctuations. Secondly, the smoothness test shows
that the 17 variables are non-stationary at 1%
significance level. In view of this, this paper proposes
two options for further research: 1. first-order
differencing of the original data; 2. cointegration test
of the original data.
4.1 First-Order Differential
After first-order differencing of the raw data, the
original hypothesis of a unit root was rejected at the
1% significance level for all 17 variables selected.
The results of the Granger causality test after first
order differencing of the data show that there is a two-
way Granger causality between Brent crude oil
futures price and Russian RTS; Brent crude oil
futures price is the Granger cause of CSI energy
(ZZNY), CSI fuel (ZZRL), Russian car allocation
(RCP) and Russian energy (RNY); while Russian
textile (RFZ), Russian Fuel (RRL) are Granger
causes of Brent crude oil futures prices; there is no
Granger causality between Brent crude oil futures
prices and the remaining nine variables.
The results of the VAR regression of Brent crude
oil futures price and Russian RTS index with two-
way Granger causality show that: 1. Brent crude oil
futures price has a significant negative effect on itself
at the first and second lags. 2. Russian RTS index has
an opposite effect on itself at the first and second lags,
with the effect at the first lag being larger and more
significant; 3. RTS index lagged first and lagged
second have comparable influence on Brent crude oil
futures price, while the coefficient of lagged second
is more significant; 4. Brent crude oil futures price
lagged first and lagged second have great influence
on RTS index and have opposite effects.
The impulse response results show that the RTS
Index has a two-period lag to the Brent crude oil
futures price; the Brent crude oil futures price has no
lag to the RTS Index, has an immediate impact and
lasts for about four periods; in the long run, both the
RTS Index and the Brent crude oil futures price are
in a stable state and the impact effect is largely
unchanged. The results of the variance
decomposition are consistent with these findings.
In this paper, Breusch-Godfrey Serial Correlation
LM Test is chosen to test for serial correlation, and
the results show that the variable groups dSHA &
dBrent, dZZCP & dBrent, dZZFZ & dBrent, dZZJZ
& dBrent and dZZJT & dBrent have serial
correlation.
This paper performs an ARCH effect test on the
regression equations, and the results show that
ARCH effects exist for all variable groups except CSI
Textiles and Brent Crude Oil futures prices. For CSI
Textiles and Brent Crude Oil futures prices, direct
OLS regressions are done and Wald tests show that
there is no significant relationship between the two.
For the variable groups with ARCH effect, the ARCH
effect was eliminated for each variable group after
the GARCH model was built.
To further investigate the volatility spillover
effect of Brent crude oil futures price fluctuations on
the stock indices of China and Russia, a BEKK-
GARCH model is chosen for this paper, with the
following expressions:
𝑌
= 𝜑
+ 𝜑
𝑌
+ ⋯+ 𝜑
𝑌
+ 𝜑
𝑋
+ 𝜀
, 𝑝 >0
𝐻
= 𝐶𝐶
+ 𝐵
𝐻
𝐵+ 𝐴
𝜀
𝜀
𝐴 (1)
where 𝑌
is the stock price index, 𝑋
is the crude oil
futures price, 𝐻
=
ℎ
,
ℎ
,
ℎ
,
ℎ
,
is the conditional
covariance matrix, A and B are both 2*2 order
parameter matrices, A reflects the ARCH effect of
volatility, B reflects the GARCH effect of volatility,
and C is a 2*2 order upper triangular matrix.
ICPDI 2022 - International Conference on Public Management, Digital Economy and Internet Technology
440
The conditional covariance matrix can be
expanded as follows.
ℎ
,
= 𝐶
+ 𝛽
ℎ
,
+2𝛽
𝛽
ℎ
,
+ 𝛽
ℎ
,
+ 𝛼
𝛼
𝜀
,
𝜀
,
+ 𝛼
𝜀
,
+2𝛼
𝛼
ℎ
,
ℎ
,
= 𝐶
+ 𝐶
+ 𝛽
ℎ
,
+2𝛽
𝛽
ℎ
,
+ 𝛽
ℎ
,
+ 𝛼
𝜀
,
+2𝛼
𝛼
𝜀
,
𝜀
,
+ 𝛼
𝜀
,
ℎ
,
= 𝐶
𝐶
+ 𝛽
𝛽
ℎ
,
+
𝛽
𝛽
+
𝛽
𝛽
ℎ
,
+ 𝛽
𝛽
ℎ
,
+ 𝛼
𝛼
𝜀
,
+
𝛼
𝛼
+ 𝛼
𝛼
𝜀
,
𝜀
,
+ 𝛼
𝛼
𝜀
,
(2)
where ℎ
,
denotes the conditional variance of the
stock price index at moment 𝑡, ℎ
,
denotes the
conditional variance of the crude oil futures price at
moment 𝑡, and ℎ
,
denotes the conditional
covariance between the stock price index and the
crude oil futures price.
The BEKK-GARCH model finds the coefficients
of A (1,2) and B (1,2) are significant, indicating that
there are volatility spillovers between the Brent crude
oil futures price and the China and Russia composite
stock indices as well as the sector stock indices.
Comparing B (1,1) with B (2,2), we find that B (1,1)
> B (2,2) for the combinations of SSE, CSI Auto,
Russian Textile, Russian Construction, Brent Crude
Oil futures prices. Indicating that equity indices react
faster and with shorter periods than Brent Crude Oil
futures prices to shocks. In the other combinations, B
(1,1) < B (2,2) indicates that the stock index is more
volatile than the Brent crude oil futures price and has
a longer reaction period to information shocks.
Wavelet transform and multi-resolution can
transform the time and frequency of a time series and
study the morphology of a subspace series satisfying
the multi-resolution condition on different subspaces.
In this paper, the discrete wavelet transform is used
to stratify and process the raw data, and the binary
orthogonal wavelet multi-resolution analysis method
is used to wavelet decompose the raw data into short-
, medium- and long-term data. The time scales for the
short-term data (high frequency signals) are 2 days 4
days. For the medium term are 8 days and 16 days
and for the long term is 32 days.
Granger causality tests were conducted on the
short-, medium- and long-term Brent crude oil
futures price data and the raw data with the composite
and sectoral indices of both China and Russia stock
markets, and found that only the three variable groups
of RTS index and Brent crude oil futures price, RTS
index and Brent crude oil futures price short term,
and SHA index and Brent crude oil futures price had
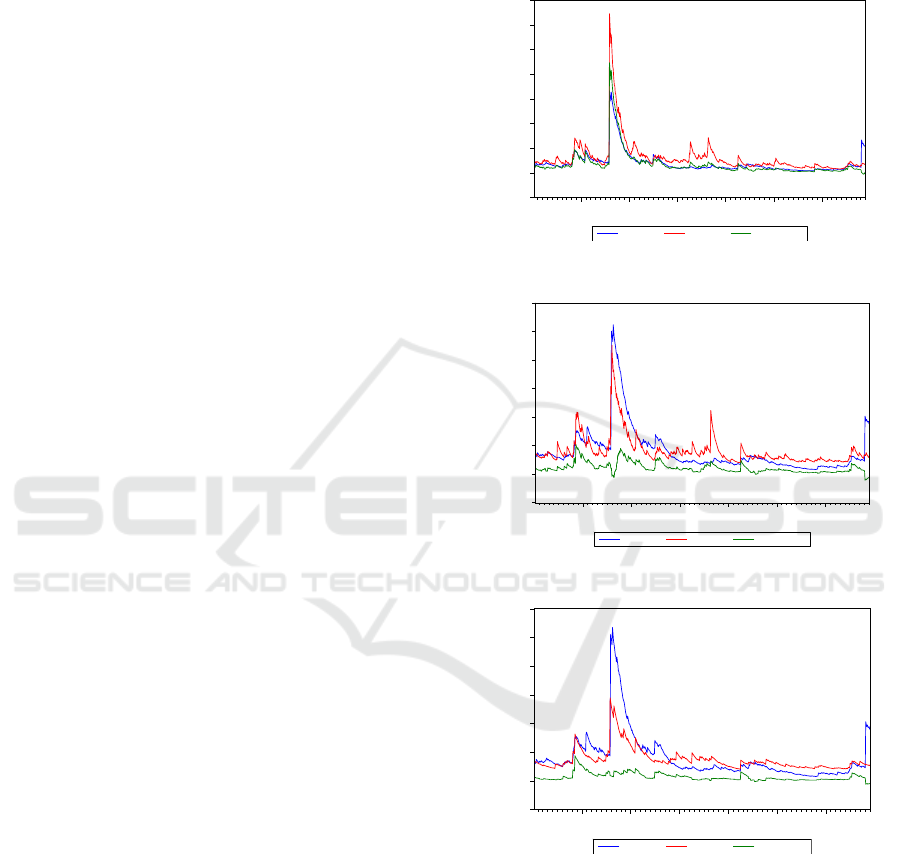
bivariate Granger The regression results of the
BEEK-GARCH model are shown in the figure
below.
Figure 1: RTS & BRENT.
Figure 2: RTS & BRENT short-term.
Figure 3: SHA & BRENT.
Wald tests were conducted on two variable
groups, RTS index and Brent crude oil futures price
and SHA index and Brent crude oil futures price, to
determine the direction of the volatility spillover
effect, and the results are shown in Table 1.
-.001
.000
.001
.002
.003
.004
.005
.006
.007
100 200 300 400 500 600
VAR_Y1 VAR_Y2 C OV _ Y1 Y2
-.0005
.0000
.0005
.0010
.0015
.0020
.0025
.0030
100 20 0 300 400 500 600
VAR_Y1 VAR_Y2 COV_Y1Y2
-.0005
.0000
.0005
.0010
.0015
.0020
.0025
.0030
100 200 30 0 400 500 60 0
VAR_Y1 VAR_Y2 C O V _ Y1 Y2
An Empirical Study of Volatility Spillover Effects Between International Crude Oil Futures and Russian and Chinese Stock Markets - A
Multivariate BEKK-GARCH Model Based on Wavelet Multi-Resolution Analysis
441

Table 1: Wald test results.
Original
hypothesis
No two-way volatility spillover
between Brent crude oil futures
prices and the RTS Index
𝐻
: 𝛼
= 𝛼
= 𝛽
= 𝛽
=0
No unidirectional volatility
spillover effect of the RTS Index
on Brent crude oil futures prices
𝐻
: 𝛼
= 𝛽
=0
No unidirectional volatility spillover
effect of Brent crude oil futures
prices on the RTS Index
𝐻
: 𝛼
= 𝛽
=0
F-value Significance level F-value Significance level F-value Significance level
S 749.0268 0.0000 282146.2 0.000 941138.14 0.0000
𝑑1
2526.654 0.0000 1761374 0.0000 34865.67 0.0000
𝑑2
7973.026 0.0000 1848848 0.0000 296475.1 0.0000
𝑑3
0.2450 0.9128 0.3120 0.7319 7.42e-009 0.9999
Original
hypothesis
No two-way volatility spillover
between Brent crude oil futures
prices and the RTS Index
𝐻
: 𝛼
= 𝛼
= 𝛽
= 𝛽
=0
No one-way volatility spillover
from SSE Composite to Brent
crude oil futures prices
𝐻
: 𝛼
= 𝛽
=0
No unidirectional volatility
spillover
effect of Brent crude oil futures
prices on the RTS Index
𝐻
: 𝛼
= 𝛽
=0
F-value Significance level F-value Significance level F-value Significance level
S 6551.491 0.0000 401.2298 0.000 973683.0 0.0000
𝑑1
1.026588 0.3268 2.568956 0.4456 1.50792 0.5566
𝑑2
0.8561 0.5029 0.6122 0.6250 0.2567 0.7736
𝑑3
0.2380 0.9356 0.4569 0.7259 8.602e-011 0.9999
The results show that there is a two-way volatility
spillover effect between the raw series of Brent crude
oil futures prices and the data at 𝑑1 and 𝑑2 levels and
the RTS Index, while there is no two-way volatility
spillover effect between the data at the remaining
levels of Brent crude oil futures prices and the RTS
Index; while only the raw series of Brent crude oil
futures prices has a two-way volatility spillover effect
with the Shanghai Composite Index.
The conditional covariance plot of the Brent
crude oil futures price and the RTS Index shows that
the covariance curve is extremely similar to the trend
of the variance curves of the Brent crude oil futures
price and the RTS Index, indicating that the volatility
spillover effect is strong, especially in the short term,
and the volatility spillover effect is more obvious.
The volatility spillover effect of Brent crude oil
futures price on the SSE Composite Index is less than
that of the RTS Index, although there is a relationship
between the two. The correlation coefficients
between Brent crude oil futures prices and the RTS
Index and SSE Composite Index are largely positive,
implying that volatility in international crude oil
futures prices is likely to increase the volatility of the
Russian and Chinese stock indices.
4.2 Co-Integration
In order to prevent the loss of long-run relationships
between the data due to first-order differences, this
paper uses a cointegration approach to investigate
whether there is a long-run relationship between the
variables. This paper uses the two-step E-G method
to conduct co-integration tests and regressions. The
results show that all coefficients are significant and
positive, except for the coefficients between the SSE
Index, CSI Textile and Brent Crude Oil Futures Price,
which are not significant, indicating that in the long
run, the stock indices and international crude oil
futures prices show a positive relationship.
Granger causality tests were conducted on the
groups of variables with long-term relationships, and
it was found that RTS Index, SSE Composite Index
and Brent crude oil futures price have Granger bi-
directional causality; while Brent crude oil futures
price is the Granger cause of CSI Energy and CSI
Fuel; CSI Textile, CSI Industry, Russian Industry,
Russian Construction, Russian Energy and Russian
Transportation are the Granger causes of Brent crude
oil futures The price of Brent crude oil futures is the
Granger cause of VECM models were developed for
the groups of variables with Granger two-way
causality: Brent crude oil futures price and RTS
index, and Brent crude oil futures price and SSE
Composite Index. Both the impulse response and
variance decomposition results show that the
international crude oil futures price explains the
volatility of the Russian RTS Composite Index and
most of the sectoral indices quite strongly, but
explains the volatility of the SSE Index less strongly.
The part of the volatility of CSI Industrial, CSI
Transportation and CSI Textile that can be explained
ICPDI 2022 - International Conference on Public Management, Digital Economy and Internet Technology
442

by crude oil futures prices is similarly small, while
crude oil futures prices explain more strongly the
volatility of CSI Auto Allocation and CSI
Transportation, indicating that crude oil futures
prices have a stronger impact on the Auto Allocation
and Transportation sectors. Conversely, the volatility
of international crude oil futures prices was less
strongly explained by the Chinese stock market
composite index and industry indices.
After testing the existence of a long-run
equilibrium relationship between the variables, in
order to investigate the speed of adjustment of the
variables when they deviate from the stochastic trend,
this paper constructs an error correction model
through a first-order linear autoregressive
distribution lag model. The ECM model based on
cointegration theory is built according to the E-G
two-step method for the group of variables that do not
have Granger two-way causality. In the ECM model,
all error correction coefficients are negative,
indicating that the stock market has a reverse
correction function. The results obtained for each
variable group are relatively similar, with the
absolute values of the error correction coefficients
being small, implying that the backward adjustment
of the error correction term is limited if the current
period's volatility deviates from the long-term
equilibrium, i.e. the error in crude oil futures prices
has a small and weak adjustment to the volatility of
the current period's explanatory variables. The results
of the parametric tests show that the adjustment
coefficients of crude oil futures prices on the
volatility of other industry indices are insignificant,
except for China Industry and Russian Energy,
indicating that China Industry and Russian Energy
are correlated with international crude oil futures
prices in the long run.
5 CONCLUSIONS
The crude oil futures market could reflect the
economic situation. This paper finds that the Russian
composite stock index is more influenced by the
international crude oil futures prices and the
effectiveness of the Russian stock market is more
pronounced. The fluctuation of international crude
oil futures price explains more strongly the
fluctuation of RTS index. The empirical results show
that the sensitivity to information, reaction speed and
digestion cycle of the composite stock index and
sector index of the Chinese stock market are weaker
than those of the Russian stock market. Therefore, the
relevant regulators of China's stock market should
strengthen the monitoring of large capital flows to
eliminate malicious manipulation of stock prices. In
the short term, the rise in international crude oil
futures prices will increase the volatility of the
Shanghai Stock Exchange Index, the China Industrial
Sector Index and the Russian Energy Sector Index; in
the long term, all indices show a cointegration
relationship with international crude oil futures
prices. Thus, stabilizing international crude oil
futures prices has a positive effect on stabilizing
stock prices. The government needs more to prevent
speculative behaviour and sound financial regulatory
system.
REFERENCES
B. Meyer, Applying "Design by Contract", Computer
25(10) (1992) 40–51. DOI:
https://doi.org/10.1109/2.161279
Chen N. F., Roll R., Ross S. A. (1986). Economic Forces
and the Stock Market. Journal of Business, 1986,
59(3):383-403.
Dai D. D. (2014). Research on the impact of international
crude oil futures price changes on Chinese industry
stock index returns. Inner Mongolia University, 2014.
(in Chinese)
Ferson, Wayne E., Campbell R. (1994). Harvey, Sources of
Risk and Expected Returns in Global Equity Markets.
Journal of Banking and Finance, 1994, 18, 775-803
Hamao Y., Masulis R. W., Ng V. (1990). Correlations in
Price Changes and Volatility across International Stock
Markets. Review of Financial Studies, 1990, 3(2):281-
307.
Huang, R. D., Masulis, R. W., & Stoll, H. R. (2015).
Energy shocks and financial markets. Social Science
Electronic Publishing, 16(1), 1-27.
Jin H. F., Jin E. (2010). The impact of international oil
prices on the Chinese stock market - an empirical
analysis based on industry data. Financial Research,
2010(2):173-187. (in Chinese)
Jones C. M., Kaul G. (1996). Oil and the Stock Markets.
Journal of Finance, 1996, 51(2):463-491.
Lao, J. N. (2008). Does oil price have an impact on the SSE
Composite Index? --An empirical analysis based on
data from 2000-2007. World Economic Situation,
2008(5):71-76. (in Chinese)
Leblanc M., Chinn M. D. (2004). Do High Oil Prices
Presage Inflation? The Evidence From G-5 Countries.
Business Economics, 2004, 39(2):38-48.
Qi Q. M., Zhu H. L. (2011). An econometric analysis of the
relationship between international oil prices and the
impact of the US and Chinese stock markets. Financial
Theory and Practice, 2011(7):82-87. (in Chinese)
Sadorsky P. (2001). Risk factors in stock returns of
Canadian oil and gas companies. Energy Economics,
2001, 23(1):17-28. (in Chinese)
An Empirical Study of Volatility Spillover Effects Between International Crude Oil Futures and Russian and Chinese Stock Markets - A
Multivariate BEKK-GARCH Model Based on Wavelet Multi-Resolution Analysis
443

Zhang H. (2013). A comparative study on the impact of
crude oil price volatility on stock prices: different
industry and time perspective. Zhejiang University of
Technology, 2013. (in Chinese)
Zhang X., Wang J. Y. (2013). An international comparison
of the impact of crude oil prices on stock markets. Price
Theory and Practice, 2013(1):75-76. (in Chinese)
Zhu C. Y. (2015). Study on the spillover effects among
crude oil futures and spot markets, exchange rate
markets and stock markets. Ocean University of China,
2015. (in Chinese)
Zhuge S. Q., Hao X.C. (2009). Domestic and international
oil price shocks and the Chinese stock market. China
Price, 2009(6):41-44. (in Chinese)
ICPDI 2022 - International Conference on Public Management, Digital Economy and Internet Technology
444
