
U-Optimal Accelerated Life Test Scheme Considering Right
Censored Data
Di Cao, Juan Wang and Liangqing Feng
School of Economics and Management, Nanchang Hangkong University, China
Keywords: Accelerated Life Test, Generalized Linear Model, Optimal Criterion, Monte Carlo Technique.
Abstract: The purpose of accelerated life test is to promote more failure units of test products in a shorter time, so as to
predict the reliability of products under normal conditions based on the failure data collected under accelerated
conditions. In view of the right censored data, some statistical optimality is considered. In the framework of
generalized linear model, the semi-parametric Cox proportional hazard model is used to obtain the accelerated
life test scheme under the U- and D-optimal criteria. From the perspective of prediction variance, the fitting
effect is best when the shape parameter 𝛼 is 1.5 in Weibull distribution. The uncertainty of model parameters
is evaluated by Monte Carlo technique to verify the feasibility of the test scheme.
1 INTRODUCTION
A large number of products in the market have a long
expected life. In order to ensure the stable perfor-
mance of product life during the service period, it is
unrealistic to completely observe the product life due
to limiting factors. Therefore, accelerated life test
(ALT) is introduced. ALT ensures that more products
failure data can be obtained in a shorter time, and the
reliability of products can be inferred by establishing
statistical models. However, when faced with irregu-
lar experimental design areas, the regular design loses
some statistical "optimality" and needs to be "tai-
lored" design.
Censored data results from inaccurate observa-
tions of failure times. The definition of right censored
data is that the starting time of the test is known, but
the test fails to fail at the end of the test, thus, the sur-
vival time is longer than the observed time. There is
a huge literature on ALTs. Song Wu et al (Wu, Lu,
Li, 2021) briefly described the relevant theoretical
knowledge of ALT. Under the assumption of lognor-
mal distribution, Xiaopei Li et al (Li, Li, Liang, 2021)
proposed the relationship between single stress varia-
ble and product life. Yi Dai et al (Dai, Liu, 2020) ap-
plied the maximum likelihood theory to design the
optimal test under the condition that the product life
obeys the minimum extreme value distribution. The
literature described above are performed under single
stress conditions. In fact, most product life is affected
by multiple stress variables. Xu et al (Xu, Fei, 2007)
discussed the dual-stress variables with no interaction
between. Park and Yum (Park, Yum, 1996) assumed
the interaction between stress factors and verified it.
The process of obtaining the information matrix is
particularly complex, thus, focusing on the hazard
rate and under the assumption of proportional hazard
model (PH), the ALT scheme is transformed into an
optimization problem under the generalized linear
model (GLM). For different statistical optimality,
Guo and Pan (Guo and Pan, 2007) used GLM method
to obtain the plan under D-criterion. Juan Wang
(Wang, Ma, Wang, 2017) discussed the ALT scheme
with 2 stress factors under the I-optimal criterion for
interval censored data. In addition, due to the uncer-
tainty of model parameters, literature (Dror, Stein-
berg, 2006; Ozol-Godfrey, Anderson-Cook, Robin-
son, 2008) has discussed the wrong designation of rel-
evant parameters.
2 ACCELERATED LIFE TEST
MODEL
The purpose of using D-optimal is to maximize the
determinant of the expected information matrix. The
goal of the U-optimal is to minimize the overall vari-
ance of the model parameter estimator. Specifically,
the D-optimal criterion is expressed as:
530
Cao, D., Wang, J. and Feng, L.
U-Optimal Accelerated Life Test Scheme Considering Right Censored Data.
DOI: 10.5220/0011751400003607
In Proceedings of the 1st International Conference on Public Management, Digital Economy and Internet Technology (ICPDI 2022), pages 530-533
ISBN: 978-989-758-620-0
Copyright
c
2023 by SCITEPRESS – Science and Technology Publications, Lda. Under CC license (CC BY-NC-ND 4.0)

𝜉
∗
≔𝑎𝑟𝑔𝑚𝑎𝑥
|𝑿
𝜉
𝑾𝑿(𝜉)|
U-optimal criterion:
𝜉
∗
:=𝑎𝑟𝑔𝑚𝑖𝑛
𝑥
⋅(𝑿(𝜉)
𝑾𝑿(𝜉))
⋅𝑥
𝑥
represents the stress under the use condition,
𝑿
(
𝜉
)
represents the model matrix of n×p, n and p rep-
resent testing numbers and model parameters, respec-
tively, and W is the weight matrix related to the vari-
ance of the predicted life.
Under the assumption of PH, the failure function
can be expressed as:
𝑓(𝑡)=ℎ(𝑡)𝑅(𝑡)=ℎ
(𝑡)𝑒
𝒙
𝜷
(𝑅
(𝑡))
𝒙
𝜷
ℎ
(𝑡) is underlying hazard function, β is the vec-
tor of regression coefficients, and 𝜂= 𝒙
𝜷 is the lin-
ear prediction of the model. 𝑅
(𝑡) is reliability func-
tion, the relationship with the cumulative hazard
function is 𝑅
(
𝑡
)
= 𝑒𝑥𝑝 (−𝐻(𝑡)). For the right cen-
sored failure time dataset, (𝑡
, 𝑟
),…(𝑡
, 𝑟
),…(𝑡
,
𝑟
),i=1, 2, 3, …n, 𝑡
is the failure or survival time
of the ith data, 𝑟
is indicator variable of censored
time. If the ith test unit fails, 𝑟
takes the value 1; oth-
erwise, it is 0. After simplification, the likelihood
function can be expressed as:
𝐿= (𝑓(𝑡
))
(𝑅(𝑡
))
= (ℎ(𝑡
))
𝑅(𝑡
)
take the logarithm of both sides:
𝑙𝑛𝐿=
𝑟
𝑙𝑛ℎ
(
𝑡
)
+ 𝑙𝑛𝑅
(
𝑡
)
= [𝑟
(𝑙𝑛ℎ
(𝑡
)+𝒙
𝜷)
+ 𝑒
𝒙
𝜷
𝑙𝑛𝑅
(𝑡
)]
let 𝑢
= 𝐻(𝑡
, 𝒙
)=𝑒𝑥𝑝(𝒙
𝜷)(−ln 𝑅
(𝑡
)), this is:
𝑙𝑛𝐿= [𝑟
𝑙𝑛(
1
𝑡
)+(𝑟
𝑙𝑛𝑢
−𝑢
)]
The form 𝑟
𝑙𝑛𝑢
−𝑢
can be regarded as the log-
likelihood function form of Poisson distribution with
mean 𝑢
. So, in the GLM: indicator variable 𝑟
can
be regarded as poisson distribution with mean 𝑢
, the
connection function is the logarithmic function,
𝑙𝑛𝑢
= 𝜂
+ compensation term, the compensation
term is 𝑙𝑛𝐻
(𝑡
).
In the GLM described above, using the elements
𝑢
, 𝑖=1,…𝑛 construct weight matrix, 𝑾=
𝑑𝑖𝑎𝑔{𝑢
, 𝑢
,...,𝑢
}, then the model estimation pa-
rameter 𝜷
is:
𝑉𝑎𝑟(𝜷
)=(𝑿(𝜉)′𝑾𝑿(𝜉))
Among them, (𝑿(𝜉)′𝑾𝑿(𝜉))
is the expected
Fisher information matrix, and the number of ele-
ments in matrix X is n×(p+1):
𝑿=
1 𝑥
,
⋯
1 𝑥
,
⋯
⋮⋮⋱
𝑥
,
𝑥
,
⋮
1 𝑥
,
⋯
𝑥
,
𝑢
in the weight matrix is a function of the failure
time 𝑡
. Therefore, it is more appropriate to express
the weight matrix by the expected value of 𝑢
: 𝑾=
𝑑𝑖𝑎𝑔{𝐸(𝑢)}:
𝐸(𝑢
)=𝐻(𝑡
, 𝒙
)=𝑒𝑥𝑝(𝛽
+ 𝒙
𝜷) ∙𝐸(𝑡
)
= 𝜆
𝑒
𝒙
𝜷
∙𝐸(𝑡
)
𝜆
is the failure rate, 𝛽
= 𝑙𝑛𝜆
, which is the in-
tercept term of linear prediction. Explicitly censoring
time, the expectation function is 𝐸(𝑡
)=[1−
𝑒
(
,𝒙
)
]
𝒙
𝜷
.
Finally get the expected value:
𝐸(𝑢
)=[1−𝑒
(
,𝒙
)
]
3 THE EXAMPLE ANALYSIS
3.1 The Scheme Affected by
Temperature and Humidity
Consider tests related to metal oxide semiconductors
(Zhu, Elsayed, 2011). Assuming that the lifetime of
the semiconductor is affected by two stress variables,
temperature and humidity. 100 samples is planned to
be tested, and the test is set to be censored at 50 hours.
It is assumed that lifetime obeys the Weibull distribu-
tion, and the cumulative hazard function is 𝐻(𝑡, 𝒙)=
𝜆
𝑡
𝑒
𝒙
𝜷
, 𝛼 is the shape parameter. Various factors
are considered in this paper, and 𝛼=1.5 is taken as
the value. In the test, under normal conditions, the
temperature and humidity range is (25℃, 25%)-
(45℃, 40%). In the ALT, set temperature range of
(60℃-110℃), humidity range is (60%-90%), the
temperature of natural stress level is expressed as
𝑆
= 11605/𝑇, T is an unit with Kelvin, natural
stress level of relative humidity is expressed as 𝑆
=
ln ℎ, h is relative humidity. To normalize the pro-
cessing, the following linear transformation of tem-
perature and humidity is used: 𝑥
=
, 𝑥
=
, 𝑆
(0, 0) said the highest stress level, 𝑆
(1, 1)
U-Optimal Accelerated Life Test Scheme Considering Right Censored Data
531
minimum levels of stress, 𝑥
and 𝑥
are the coding
stress variables corresponding to 𝑆
and 𝑆
. In this
paper, the interaction effect of temperature and hu-
midity is considered and the previous empirical for-
mula is followed: 𝜂= −4.086𝑥
−1.476𝑥
+
0.01𝑥
𝑥
.
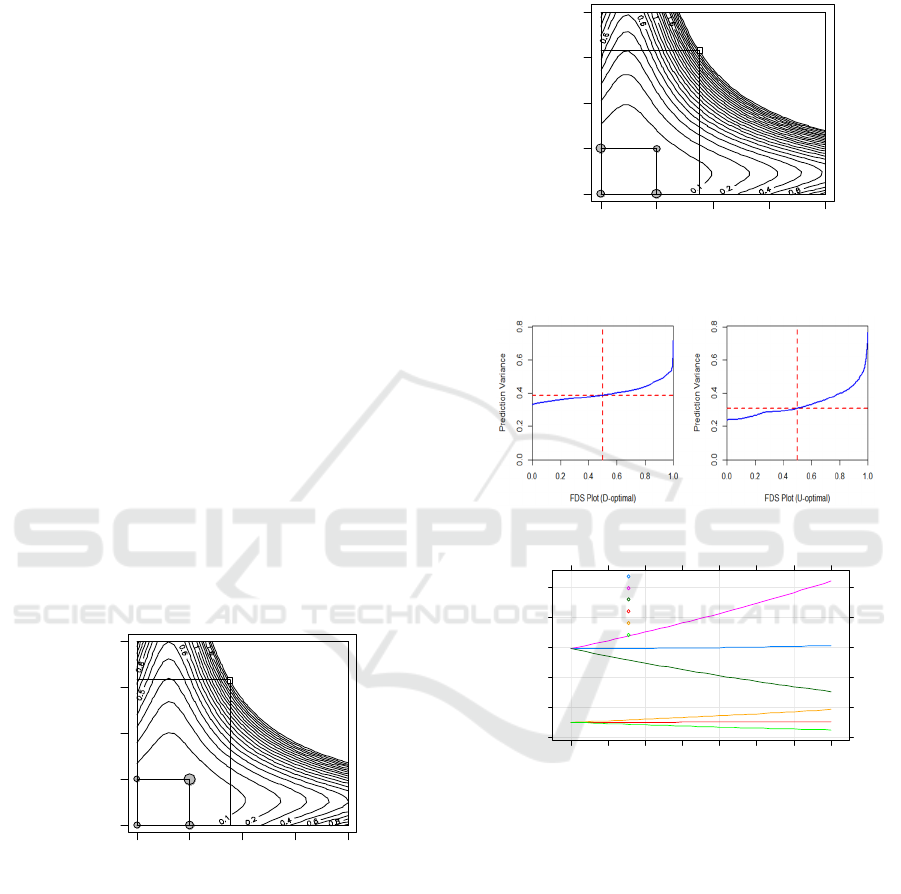
Figure 1 and Figure 2 show the test protocol under
U- and D-criterion and the contour plots of predicted
variance in the use area. The process of calculating
100 test points is more complicated, using a clustering
algorithm to aggregate the points into four different
stress level combinations. Small square area of a
graphic after the corresponding standardized test area,
the origin (0, 0) corresponding to (110℃, 90%), point
(1, 0)-(60 ℃, 90%), (0, 1)-(110 ℃, 60%), (1, 1)-(60
℃, 60%). The circle diameter corresponds to the as-
signed sample size under the test conditions, and the
contour lines outline the positions where the predicted
variance are equal. Comparing the two figures, it can
be seen that the predicted variance under the U-crite-
rion scheme is smaller than that under the D-criterion;
It can be seen from Figure 1 that under the U-crite-
rion, the number of test samples assigned to point (1,
1) is the largest. The reason may be that the low stress
level is closer to the normal operating conditions, and
more test samples have been censored when they do
not reach the high stress level. According to Figure 2,
the number of samples distributed around each stress
point under the D-criterion is roughly balanced.
Figure 1: U-optimal criterion design plot.
The graphical evaluation tool further compares
the test protocols under the U- and the D-criterion. In
the FUS (Fraction of Design Space) plot, the pre-
dicted variance of the ordinate increases with the in-
crease of the ratio of test areas, and the vertical red
line represents the mean. The results show that the
predicted variance of D-criterion is larger than that of
U-criterion. In the VDUS (Variance Dispersion of
Use Space) diagram, ave, min and max respectively
represent the mean, minimum and maximum value. It
can be clearly seen that the predicted variance value
under the D-criterion test scheme is larger.
Figure 2: D-optimal criterion design plot.
Figure 3: FDS design plot.
Figure 4: VDUS design plot.
The prediction results are expected to be accurate
from the perspective of predicted variance, and the
shape parameter 𝛼 in Weibull distribution is an inde-
terminate variable. The above results are obtained un-
der the assumption that 𝛼=1.5. In order to show the
rationality of the method, the case of 𝛼 taking other
values is further discussed. When 𝛼=1, the pre-
dicted variance under D- and U-criteria are 4.33 and
3.58, respectively, and when 𝛼=2, the predicted
variance are 2.14 and 1.92. The experimental results
show that the predicted variance of the U-criterion is
always smaller than that of the D-criterion for differ-
ent values of 𝛼. In addition, in terms of sample num,
when the value of 𝛼 changes, the sample num under
01234
01234
x1
x2
21 2
6
19 34
PV = 1.91
01234
01234
x1
x2
24 2
8
27 21
PV = 2.34
Variance Dispersion of Use Space
Prediction Variance
5
10
15
20
25
0 5 10 15 20 25 30 35
VDUS.D avg
VDUS.D max
VDUS.D min
VDUS.U avg
VDUS.U max
VDUS.U min
ICPDI 2022 - International Conference on Public Management, Digital Economy and Internet Technology
532

D-criterion does not change significantly, on the con-
trary, the sample num under U-criterion changes sig-
nificantly, especially the num of point (1, 1) decreases
with the increase of the value of 𝛼. The results show
that U-criterion has a more obvious influence on the
value change.
3.2 Model to Evaluate
The coefficients specified are taken from previous ex-
perimental results; therefore, ALT protocol with as-
sumed model coefficients needs to be evaluated. The
previous scheme assumes that the real value of stress
coefficient is not more than ±20% away from the set
value. In this paper, Monte Carlo technology is used
to analyze the uncertainty of the model coefficient,
calculate the fluctuation range of the error, and verify
the robustness in reverse.
The Monte Carlo technique uses repeated random
sampling method to obtain numerical results, which
is beneficial to the processing of complex tests. First,
specify the right censored data type, input the sample
size, expectation matrix, linear predictor coefficient
and other relevant variables; Secondly, the GLM was
fitted to obtain the values in the model matrix. Fi-
nally, Monte Carlo simulation is used to evaluate the
intercept term, temperature coefficient 𝑥
, humidity
coefficient 𝑥
, and interaction coefficient 𝑥
𝑥
in
the linear predictor given the values of the running
matrix and the statistical model fitted to the data. The
expected test result is (0, 0, 0, 0). The actual test re-
sults are as follows: the intercept term change rate is
19.65%, 𝑥
is 19.27%, 𝑥
is 19.95%, 𝑥
𝑥
is
19.17%. The test results show that the change rate of
each coefficient is less than 20%, thus, the error rate
of the test scheme is acceptable. The coefficients in
the linear predictor vary within the range, which will
not affect the operation of the test scheme, and the
scheme is still robust.
4 CONCLUSION
In this paper, we discuss the ALT scheme based on
optimal criteria in the framework of GLM with right
censored data. However, the method of parameter es-
timation is based on determining the failure data dis-
tribution, and the parameters are fixed. In fact, in
many cases, the failure data are limited or non-exist-
ent, which makes it difficult to determine the data dis-
tribution. In this case, the Bayesian method is an op-
tion. In the following research, when the failure data
are interval censored, Bayesian method is used to ob-
tain the posterior distribution according to the prior
estimation of parameters, so as to reduce the depend-
ence of model parameters.
REFERENCES
Dror H A, Steinberg D M. Robust experimental design for
multivariate generalized linear models[J]. Technomet-
rics, 2006, 48(4), 520-529.
Guo H, Pan R. D-optimal reliability test design for two-
stress accelerated life tests[C]. International Confer-
ence on Industrial Engineering and Engineering Man-
agement. IEEE, 2007: 1236-1240.
Juan Wang, Yizhong Ma, Jianjun Wang. I-optimal acceler-
ated life test scheme considering interval-censored
data[J]. Practice and Understanding of Mathematics,
2017, 47(17): 184-193.
Ozol-Godfrey A, Anderson-Cook C, Robinson T J. Fraction
of design space plots for generalized linear models[J].
Journal of Statistical Planning and Inference, 2008,
138(1): 203-219.
Park J W, Yum B J. Optimal design of accelerated life tests
with two stresses[J]. Naval Research Logistics(NRL),
1996, 43(4): 863-884.
Song Wu, Jingjing Lu, Xiaokang Li. Review of Reliability
Accelerated Life Test[J]. Reliability and Environmental
Testing of Electronic Products, 2021, 39(01): 94-100.
Xiaopei Li, Fanchang Li, Helan Liang. A Tensor Decom-
position Imputation Algorithm for Bayesian Log-Nor-
mal Distribution[J]. Computer Applications and Soft-
ware, 2021, 38(07): 214-221.
Xu H Y, Fei H L. Planning step-stress accelerated life tests
with two experimental variables[J]. IEEE transactions
on reliability, 2007, 56(3): 569-579.
Yi Dai, Qin Liu. Reliability Evaluation Based on Survival
Analysis and Maximum Likelihood Method[J]. Com-
puter Integrated Manufacturing Systems, 2020, 26(11):
2976-2981.
Zhu Y, Elsayed E A. Design of equivalent accelerated life
testing plans under different stress applications[J].
Quality Technology & Quantitative Management,
2011, 8(4): 463-478.
U-Optimal Accelerated Life Test Scheme Considering Right Censored Data
533
