
The Design and Implementation of Big Data Analysis System for
Enterprise Economic Operation
Dan Liu*, Yuan Sun and Libin Zhang
School of Big Data and Artificial Intelligence, Dalian University of Finance and Economics, Dalian City,
Liaoning Province, 116622, China
Keywords: Economic Operation of Enterprises, Big Data, Hadoop, Java.
Abstract: In order to make big data better serve the development of local economy, the author has established an
analysis platform system of comprehensive data of enterprises' economic operation in this city with the help
of big data technology. This system is a b/s mode application system developed by java language. The de-
velopment environment of this system is built by Linux system and developed by ssh framework which
combines spring, springmvc and hibernate. The system data is collected, converted, cleaned and counted by
setting up hadoop cluster of five servers. And the DTW dynamic time warping algorithm is improved, and
C4.5 decision tree classification algorithm which divides time series sets is used to predict the economic trend
of local enterprises more scientifically and reasonably. From the perspective of society and government, make
overall planning for the economic operation of regional enterprises, and establish a comprehensive data
platform for economic operation of this city with the help of big data technology, so that big data can better
serve the local economic operation and development. We will improve the economic operation monitoring
and analysis system, improve the quality and level of economic operation monitoring and analysis, realize
data integration and sharing, and establish a basic data classification and collection mechanism.
1 INTRODUCTION
The economic operation of enterprises is an im-
portant way for the government and industrial and
commercial administrative departments to manage
the local economy, and proper use can help promote
the sound development of local enterprise economy.
Meanwhile, the economic operation is also a very
important part for the operation and management of
the enterprise itself. Using scientific methods to
manage the economic operation of the enterprise can
help the planning scheme and various operations of
the enterprise to achieve sustainable development.
With the development of the Internet era, the eco-
nomic form has become increasingly complex with
the appearance of the Internet. Many local govern-
ments are aware of this, and begin to attach im-
portance to the establishment of the economic oper-
ation detection and analysis environment under the
Internet technology, so as to realize the data integra-
tion and effective monitoring of the information
systems established by various enterprises.
But the information systems of most enterprises
do not communicate with each other, and the infor-
mation data of each enterprise is not comprehensive
and standardized. It is difficult to realize the data
relevance and value sharing of the data of the local
economic operation detection project. Besides, the
data of enterprises' economic operation in different
markets are generally obtained through field inves-
tigation by relevant personnel, and it is often difficult
to reflect the development trend of the industry be-
cause the data is too specific. The poor quality of data
indirectly leads to the low quality of the report of
local enterprises' economic operation analysis, which
affects the overall development of local economy.
Therefore, it is advisable to use big data technology
to establish a cross-departmental and cross-unit big
data warehouse platform system to effectively inte-
grate all kinds of information and help the industrial
and commercial departments to analyze the economic
operation. (Zhu, 2021)
On the basis of the above analysis, the author
thinks that a data analysis system of local enterprises'
economic operation should be developed based on
big data technology. This system is a b/s mode ap-
plication system developed by java language. The
development environment of this system is built by
Liu, D., Sun, Y. and Zhang, L.
The Design and Implementation of Big Data Analysis System for Enterprise Economic Operation.
DOI: 10.5220/0011751800003607
In Proceedings of the 1st International Conference on Public Management, Digital Economy and Internet Technology (ICPDI 2022), pages 551-554
ISBN: 978-989-758-620-0
Copyright
c
2023 by SCITEPRESS – Science and Technology Publications, Lda. Under CC license (CC BY-NC-ND 4.0)
551

Linux system and developed by ssh framework which
combines spring, springmvc and hibernate. The
system data is collected, converted, cleaned and
counted by setting up hadoop cluster of five servers.
We will provide users with a rigorous and efficient
decision-making platform from the perspective of
relevant personnel of local industrial and commercial
administration departments. The establishment of a
warehouse and a self-service business data analysis
platform integrating the economic operation data of
various enterprises can help local government and
industrial and commercial managers provide great
convenience for data analysis, reduce the workload of
statistical staff and improve the management effi-
ciency of local economy.
2 KEY TECHNOLOGIES
2.1 B/S Structure
The big data analysis system of enterprise economic
operation designed in this paper adopts B/S structure.
The B/S is the structure of browser/server, which is
widely used in web application development. In the
B/S structure, the client uses the browser title, while
the server is used to run the core technology. The
network environment of B/S is mostly used in wide
area network, and only the devices of browser and
operating system need to be loaded, so this structure
is more suitable for application and application de-
velopment with a wide range of customers. (Li, 2019)
2.2 Hadoop Ecology
The Hadoop is the infrastructure of a distributed
system, developed by Apache Foundation. The de-
sign of this ecosystem is mainly used to solve the
problems of massive data storage, analysis and cal-
culation in the era of big data. The Hadoop ecosystem
is mainly composed of mapreduce computing com-
ponent, yarn resource scheduling component, HDFS
data storage component and other auxiliary tools. The
Hadoop ecological cluster covers all kinds of com-
ponents in the big data technology ecosystem, in-
cluding business model layer, task scheduling layer,
data computing layer, resource management layer,
data storage layer and data transmission layer.
(Wang, 2015).
2.3 Classification and Prediction
Algorithm for Data Mining
2.3.1 K-nearest Neighbor Algorithm
K-nearest neighbor algorithm divides the number set
into several categories, and calculates the repre-
sentative particles of each category. X refers to the
distance between different prediction points and
representative points, and the final value X is the
minimum distance point.
Assuming that the number of categories is n and
the number of representative points of each category
is m, the classification function is:
𝑔
(x)=min
x − x
,k=1,2,3....,𝑀
(2)
In which i in x
represents n class, and k repre-
sents the k of m representative points. The category
with the largest number among the k minimum dis-
tances of the predicted point x is the category of the
predicted point, and k=1 is the nearest neighbor
method.
2.3.1 Decision Tree Algorithm
The decision tree algorithm is an inductive algorithm
classification rule based on the decision tree deduced
from the unordered sequence. It is a recursive algo-
rithm from top to bottom, so it is necessary to con-
struct the relationship between categories and attrib-
utes to predict unknown classes. The current main-
stream decision tree algorithms include c4.5, ID3 and
cart, etc. This paper focuses on C4.5 decision tree
algorithm, which is an improved algorithm based on
ID3. The construction of C4.5 decision tree first
needs to input the data set, classification attribute and
sample attribute set of the required data, and use V, C
and S to replace them respectively. 1. create node n .
2. where N=C when s is the set of c, otherwise, exe-
cute 3. 3. S is empty. N = the category with the most
frequent occurrences of S; S=NULL, then execute 4.
4. calculating the highest information gain rate v,
wherein N=V . 5. If s is the set of sample points of V,
then S=null, add a leaf node, otherwise, return
(V-,C,). 6. Recursive results are used to complete the
construction. (Mao, 2018)
2.4 Development Environment
The development environment of enterprise eco-
nomic operation big data analysis system is divided
into two parts, one is the construction of hadoop big
data cluster, the other is the application environment
of Javaweb technology. According to the required
ICPDI 2022 - International Conference on Public Management, Digital Economy and Internet Technology
552
amount of data, this paper builds a hadoop cluster
composed of one primary node named namenode and
four secondary nodes named datanode. These clusters
store massive data based on hdfs distributed storage.
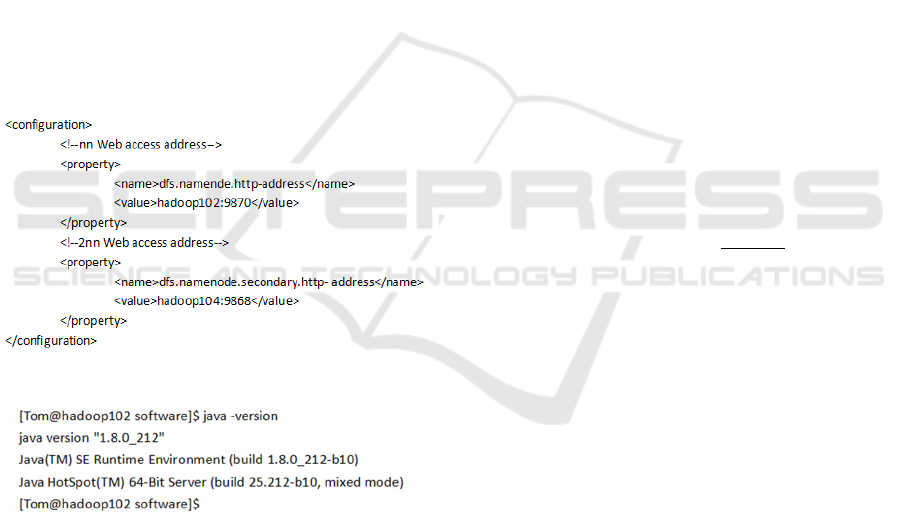
The code of configuring HDFS components in the
cluster is shown in Figure 1. Then, the functional
components such as zookeeper-3.5.5 and flume1.9.0
are installed and deployed in these five nodes syn-
chronously, and the initial construction of hadoop
cluster is completed. The hadoop server cluster is
developed on five clients installed with Linux system.
This paper selects Centos7.8 Server release version of
Linux operating system. The Java development tool
used by the JavaWeb application of this system is
IDEA 2021.1.3, the development environment is
JDK 1.8, the development language is Java, and
Apache Tomcat 9.0 is selected for server building.
The code for detecting whether JDK is successfully
installed is shown in Figure 2. The development of
the system is based on MVC pattern, and the SSH
framework of spring+springmvc+hibernate is se-
lected as the framework. And choose MySQL 8.0.28
to help manage data.
Figure 1: hdfs-site.xml configuration code (Original).
Figure 2: Code for detecting whether JDK is successfully
installed (Original).
3 FUNCTION REALIZATION
3.1 Basic Client
The data warehouse construction in the data classi-
fication function module is mainly classified ac-
cording to the fact data of the main body registration
in the industrial and commercial market, including
five categories: time, region, enterprise type, industry
type and enterprise scale.
In the business analysis module, according to the
existing data, in order to clearly show the local re-
gional economic development situation for the in-
dustrial and commercial management departments,
this paper makes index modeling from a single di-
mension. Meanwhile, mining the law of economic
development, using the c4.5 algorithm based on time
series to forecast the local economy, and helping the
industrial and commercial administration depart-
ments to make a reasonable layout and adjustment of
the market economy in time. The underlying data of
intelligent analysis is the local accumulated historical
data of business administration departments, because
this part of data has the characteristic attribute of time
series. The initial input data set D and the number of
candidate sequence pairs M of the time sequence
decision tree. If there is x and y(x)= in D, this node is
a leaf node. It is continuously selected from D and
input into the set of candidate sequence pairs S, and
stops when the number of candidate sequence pairs is
m. Then the information gain and gain rate of each
candidate data pair are calculated in turn, and the data
with the largest gain rate is selected to be divided into
child nodes, and then the decision tree is constructed
recursively. The calculation formula of information
gain rate is shown in Formula 1.
InfoGainRatio(D,s)=
,
(1)
In the intelligent report generation and export
function module, users can select the time period,
content and form according to their needs, and au-
tomatically generate data reports after the selection.
The report includes data reports and various visual
images generated by echart. The visual image is
loaded by loading the echarts plug-in and data into
the web page generated by the report. According to
the API of the system echarts, the specific patterns of
charts belonging to this system are customized, and
the corresponding option module is also configured.
During the development of the system, in addition to
setting the attributes of option, the setoption function
is also called for rendering. (Chen, 2019)
3.2 Management Client
In the data preparation and uploading function mod-
ule, the administrator needs to select all kinds of
collected local enterprise economic operation data,
and select the appropriate data to upload to the sys-
tem. The data collection is provided by the relevant
departments of the Ministry of Industry and Com-
merce and relevant personnel on-the-spot enterprise
The Design and Implementation of Big Data Analysis System for Enterprise Economic Operation
553

investigation, including the enterprise registration
data and annual inspection data of local enterprises.
Administrators enter the code of information data, for
example, the industry type code input field is HYML,
the input type is vchar, and the data length is 100. The
data source is the industry category registration form.
At the same time, when this data is called in the
industry category dimension table, it is not allowed to
be set to null.
In the model building and deployment function
module, the administrator can adjust and change the
attributes of predictive modeling. The key model of
this paper is the regional economic forecasting mod-
el. The forecast model attributes of this system in-
clude industry division, industry type, enterprise
type, enterprise scale, time and region. The index
content under each attribute division is the number of
enterprises and the amount of registered capital,
while the predicted target attribute is the development
trend of local economy.
In the function module of user management and
data maintenance, administrator users can add, delete
and modify the information and permissions of basic
users. The system data is huge, so administrators
need to monitor and maintain hadoop cluster data of
each module.
4 CONCLUSION
The research of big data analysis system of enterprise
economic operation is mainly aimed at the research
and development of the underlying business data of
local industrial and commercial systems. The system
uses C4.5 decision tree algorithm to predict and
analyze the economic operation and development of
local enterprises through the related technologies of
data mining and the application of data analysis
visualization tools.
Due to my lack of ability, limited time and envi-
ronmental conditions, the current research and anal-
ysis have great limitations. It needs more excellent
personnel to improve and perfect this research.
Firstly, the data source of this system is not com-
prehensive enough, and there is a lack of multiple
data fusion with other government departments.
Secondly, due to the huge amount of data in the
underlying database, there is still as much as 70G of
data after processing, and the algorithm performance
and hadoop cluster server performance are limited,
which needs further optimization to save a lot of time
in data processing.
REFERENCES
Chen Manju. The Application of Statistical Analysis in
Enterprise Economic Operation Analysis.Economic
Forum.2019.04.
Li Ling. The Research and Design of Regional Economic
Trend Prediction and Analysis System Based on In-
dustrial and Commercial Data.Guizhou Universi-
ty.2019.04.
Mao Hongwei, Ruan Bohu.The Monitoring and Research
of Big Data Economic Operation in Zhuji City.MIN
YIN KE JI.2018.02.
Wang Xiaoyong. The Design and Implementation of
Jiangxi Industrial Economic Operation Analysis and
Forecast System.Jiangxi University of Finance and
Economics.2015.12.
Zhu Tao. The Monitoring and Analysis System of Munic-
ipal Private Economy Based on Big Data.Science and
Technology.2021.04.
ICPDI 2022 - International Conference on Public Management, Digital Economy and Internet Technology
554
