
Warning of Target Attitude of Crowd in Closed Area Based on CNN
and Clustering Algorithm
Lianwen Lu, Yuhan Cui and Xinghua Lu
*
Institute of Computer Control Technology, Guangzhou Huali College, Guangzhou, China
Keywords: Human Posture Recognition, Security Warning, Cluster Analysis, Multi Label, Target Tracking, Target
Detection, Machine Learning.
Abstract: Human Activity Recognition (HAR) technology is a hotspot in the field of computer vision. There are still
many technical difficulties in the collaborative tracking of human and object. Based on the skeletal point
algorithm and target detection and tracking, this paper attempts to build a new cooperative tracking system
between people and objects in a relatively closed environment to manage small and medium-sized
populations. Label training is carried out for specific posture and specific dangerous goods, so as to realize
early warning ability by identifying multi person posture and dangerous goods. Using multi label
classification to mark a category can improve recognition efficiency and flexibility, and avoid absolute
interpretation in target detection. After multi label training, the specific target object and target pose can
improve the accuracy of interactive recognition between human pose and object in real scene. In this paper,
we use convolution neural network and clustering algorithm, C3d two stream, openpose human feature bone
point recognition model and yolov4 to realize the crowd target attitude early warning in closed area. The final
clustering test shows that the proposed method can improve the efficiency of machine learning, enhance the
robustness, and improve the accuracy of target attitude.
1 INTRODUCTION
The main function of video surveillance is to record
human social activities. At present, most video
surveillance systems are only used to record and save
views, and the society requires the monitoring
network to gradually develop towards a higher level
of human abnormal behavior recognition. Li Qi (Li,
Jiang, 2021) uses deep convolution neural network
(CNNs) and support vector machine (SVM) to
recognize other people's static space posture, and
applies it to the security system in the field of smart
home. However, it is not suitable for real-time
monitoring due to static limitations. Gao Xiang (Gao,
2018) uses vibe + algorithm and target tracking
algorithm to achieve abnormal behavior detection
through video frame extraction and image processing.
However, the environmental requirements are
relatively high, and the behavior model involved is
less. Similarly, Yang Yahu and others (Yang, Wang,
Chen, 2021) tend to use CNN to solve the problems of
occlusion, obscure and other recognition obstacles in
the video, so as to improve the accuracy of
recognition.
Considering the advantages and disadvantages of
the above research, this paper proposes an intelligent
surveillance camera system based on semi closed area,
which detects specific targets by training YOLOv4
andYPOLOv4-ting, and realizes specific attitude
detection by using human skeleton points combined
with CNN, and finally realizes real-time target attitude
early warning.
2 OVERALL COMPOSITION OF
THE SYSTEM
In this paper, through the image as the research
object, the skeletal point and posture, objects and
posture, objects and features are associated (Gao,
Wang, 2020). Train and extract their spatial
dimensions and relationship features (Figure. 1), and
the resulting data sets are used for clustering test and
real-time test respectively.
Lu, L., Cui, Y. and Lu, X.
Warning of Target Attitude of Crowd in Closed Area Based on CNN and Clustering Algorithm.
DOI: 10.5220/0011753700003607
In Proceedings of the 1st International Conference on Public Management, Digital Economy and Internet Technology (ICPDI 2022), pages 647-658
ISBN: 978-989-758-620-0
Copyright
c
2023 by SCITEPRESS – Science and Technology Publications, Lda. Under CC license (CC BY-NC-ND 4.0)
647

Figure 1: Target training process.
Real time test (Figure. 2) is to extract video frames
for recognition detection. If there is no abnormality,
it will be stored in the storage area, and the storage
area will be cleaned regularly. If there is an exception,
on the one hand, target tracking and continuous cycle
detection will be carried out, on the other hand,
feedback will be sent to the web end to warn the
administrator until the end of the exception or stop
reporting errors.
Figure 2: Real time identification process.
3 DATA SET MAKING
3.1 Principle and Making of Multi
Label Recognition
Different labels are used to label different objects and
attitudes, so as to realize the ability of early warning
for specific targets. The general classification label
recognition is only one category label for each frame
of target image, which is easy to be absolutely
interpreted in target recognition and detection (Yu,
2016). Multi label marking for each target can
improve efficiency and flexibility.
Figure 3: Process of posture change from walking to
running.
For example, in the process of posture change from
walking to running (Figure. 3), in fact the body posture
is gradually changing, such as walking, strolling,
jogging and sprinting. The range of changes in the
body posture of bones and limbs is gradually
increasing, and a single label (Xu, 2017) is prone to
blur, which is not conducive to target warning, so
multi label training is needed (Yu, 2016). For
example, jogging has changed from single label
"jogging" to multi label "walking, jogging and
sprinting".
The generalization of multi label learning (Figure.
6) for labels makes the pose adaptation operation and
measurement space expand exponentially, and the
data processing capacity and space-time complexity
are also optimized. The following is the multi label
learning method (Yu, 2016):
1) Decompose the attitude tags and label multiple
single tags simply.
2) Each pose is associated and distinguished
according to the approximate value of the bone points.
3) In addition to associated tags, each tag is also
evaluated, and the impact of the tag on the overall
proportion is analyzed.
ICPDI 2022 - International Conference on Public Management, Digital Economy and Internet Technology
648
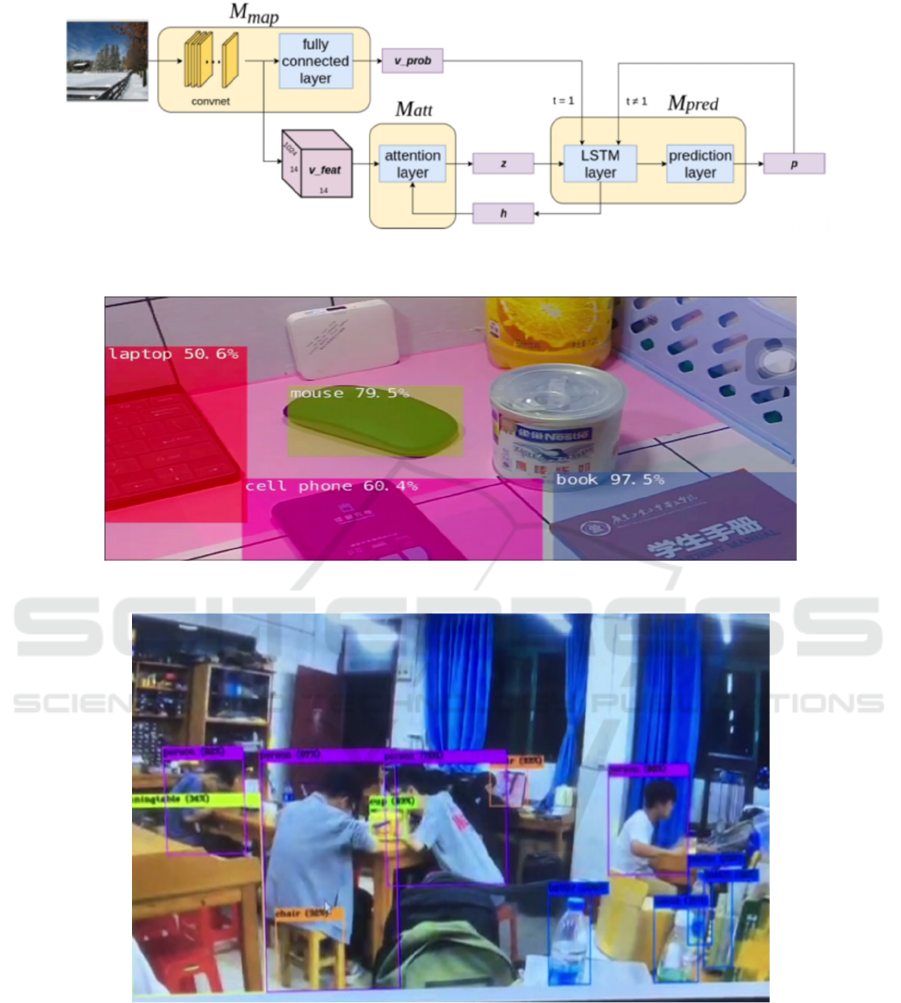
Figure 4: Multi label separation network architecture.
Figure 5: Single label marking.
Figure 6: Multi label marking.
The label architecture consists of feature mapping
layer (Mmap), attention layer (Matt) and label
prediction layer (Mpred) (Figure. 4). Through a set of
target frame pictures Vfeat obtained from Mmap, the
vector output vprob represents the first prediction of
Mmap, Z and H are the hidden states of vector and
LSTM (long short time memory network, which is
used to avoid long-term dependence in RNN and can
learn long-term dependence) respectively, and finally
P is the vprob with label percentage, which can update
the state regularly (Figure. 7).
Warning of Target Attitude of Crowd in Closed Area Based on CNN and Clustering Algorithm
649
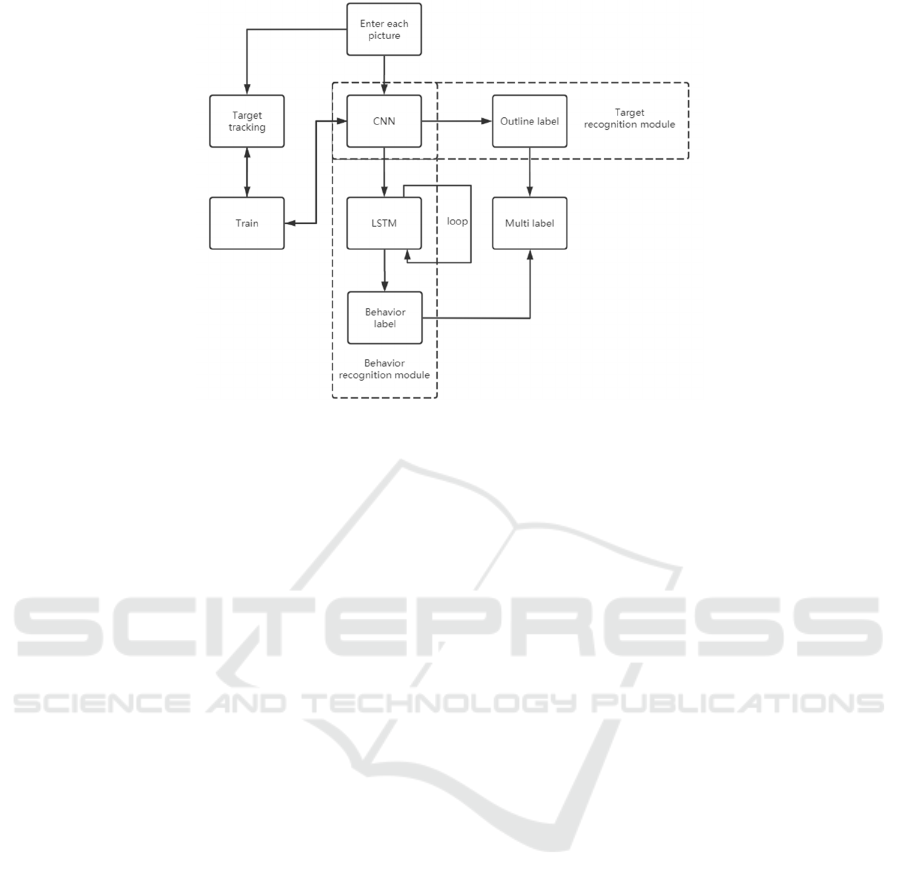
Figure 7: Multi label processing of video frame.
3.2 Cross Validation of Data Sets
To reduce the impact of the randomness of the data set
on the recognition rate and prevent the data model
from over fitting, this paper will use the k-fold cross
validation method (Liu, 2017) to verify the average
accuracy as the result.
Firstly, the package is divided into k subsets, and
each specific posture is designed to be shot by 10
people in 5 environments (Liu, 2017). Plenty of
special pose image sets were recorded. There were 50
poses of each type in the image set, and group 1 to
group 10 were used to label the sample set. Then the
K-N is called for training, and the remaining N is used
for testing, that is, each time the training set of 8 Group
is used, and the remaining 2 Group is used as the test
set. In train 1, the training set intercepts group 1 to
group 8, and the test set intercepts group 9 and group
10; The training set of train 2 intercepts group 1 to
group 6, group 9 and group 10, and its test set
intercepts group 7 and group 8 (Liu, 2017). By
analogy, the final evaluation index is the average value
of the 10 evaluation indexes.
4 TWO-STREAM AND YOLOV4
BASED ON C3D
4.1 C3D Network and Two-Stream
The C3D network framework is used to train the
spatial network, extract the spatial coordinate
information of human posture in the video frame, train
the fine-tuning, train the classified network on
ImageNet, and try to initialize the network through
parameters (Chu, 2017). The time network is
processed based on Two-Stream merged data sets, and
the similarity between two data sets or data groups
within the set is calculated to remove the overlapped
part. A new data set is coordinated and the time
network is trained with relevant parameters. In
addition, k-fold cross validation method can be used
to effectively solve the problem of small number of
human actions and over fitting of training posture (Xu,
2017).
After the above steps, the data parameters of space
network and time network are obtained, and then they
are fused, so that C3D network and Two-Stream are
fused with mean processing and SVM respectively
(Chu, 2017). The training data obtained by adjusting
the parameters of the spatiotemporal network will be
obtained when it continues to run (Chu, 2017).
Two reasons for the spatiotemporal integration of
C3D network and Two-Stream (Chu, 2017):
1) Through 3D convolution and pooling, CNN is
used for operation, and temporal and spatial elements
are fused in the process of extracting target features.
2) When using 3D convolution and pooling
operation, it has little impact on the speed of video
frame processing and network framework. Try to run
it with processor, and it can reach about 600-700
frames per second.
4.2 Yolov4
The target pose detection is performed on the
processor for 15, 30 and 60 FPS video respectively.
UsingYOLOv4-CSP and Scaled-YOLOv4 to
understand the problems of Scaled-YOLOv4 in model
ICPDI 2022 - International Conference on Public Management, Digital Economy and Internet Technology
650

scaling (Wang, Bochkovskiy, Liao, 2021). It also
combines the upper and lower bound elements of
linear scaling model involved in YOLOv4-large and
YOLOv4-tiny algorithm to balance the speed and
accuracy of Scaled-YOLOv4 and improve the
operation efficiency. In this paper, we try to optimize
the operation redundancy of shallow convolutional
neural network, but the most important thing is to
balance and optimize the parameter allocation
between the YOLOv4-large and YOLOv4-tiny.
4.2.1 Yolov4-Tiny
YOLOv4-tiny is a simplified version of YOLOv4
(Wang, 2020). If the speed of YOLOv4-tiny is
between 20 and 25FPS, the general processor GPU
can also meet its operation requirements. Here, the
focus of YOLOv4 is composed of CSPOSANet
(Figure 8) to reduce the amount of calculation. The
main idea is to divide the feature map into two parts,
one part for convolution operation, and the other part
for concatenation with the convolution operation
results of the previous part. CSPOSANet also adopts
PCB architecture.
Assuming that the trunk is in the increasing state,
then the increasing frequency G is half of B, so that it
gradually increases to B / 2 + kg = 2bat, and finally a
value of K is 3 is obtained. The main operation process
is as shown in the figure. We use YOLOv4-tiny in the
number of channels and neck links in each phase of
YOLOv4.
4.2.2 Yolov4-Large
If the simplified version of tiny is an algorithm based
on processor GPU, thenYOLOv4-large is an
algorithm based on cloud GPU (Wang, Bochkovskiy,
Liao, 2021). Large can completely improve the
accuracy and efficiency of motion pose detection.
Through the algorithm model of CSP concurrent
programming, and then extended from P5 to P7
(Figure 9). In order to control the vector change of
one-stage network in running large, the multi-scale
model of deep learning in each loop is set to DS of 2_
I power. The parameter of DS is set to (Wang,
Bochkovskiy, Liao, 2021) [1, 3, 15, 15, 7, 7], and then
the additional width scaling of the target task is
constrained by setting the inference time as an
element. In the process of testing P6, when the extra
width scaling of the target task is set to 1 or close to 1,
the short delay detection efficiency can be improved
in the video with 30 frames per second. Using the
same steps to test P7, when the extra width scaling of
the target task is set to 1. 25 or close to 1. 25, it can
improve the detection efficiency of short delay in the
video with 15 frames per second.
Figure 8: CSPOSANet calculation.
Warning of Target Attitude of Crowd in Closed Area Based on CNN and Clustering Algorithm
651

Figure 9: YOLOv4-P5, P6, P7 structure.
Figure 10: Localization, Association, Matching.
For the large and tiny models in YOLOv4, ablation
tests were carried out.
Table 1: YOLOv4-tiny testing data.
Backbone FLOPs APval
tinyCD53s 7. 0B 22. 2%
COSA-1x3x 7. 6B 22. 5%
COSA-2x2x 6. 9B 22. 0%
COSA-3x1x 6. 3B 21. 2%
Table 2: YOLOv4-large testing data.
Model finetune APval
YOLOv4-P5 - 50. 5%
YOLOv4-P5 150 51. 2%
YOLOv4-P6 - 53. 4%
YOLOv4-P6 150 53. 9%
YOLOv4-P7 - 54. 6%
YOLOv4-P7 150 55. 0%
4.3 OpenPose Human Feature Points
and Skeleton Recognition Model
How to improve the recognition effect of human
posture features of YOLOv4, we design the OpenPose
human feature points and skeleton recognition model
based on Scaled-YOLOv4 (Wang, Li, 2019).
OpenPose human feature points and skeleton
recognition model are popular technologies. We can
detect objects by skeleton distribution. OpenPose is
mainly divided into three modules (Figure 10):
Localization module, Association module and
Matching module.
Localization refers to the skeleton key points,
which is mainly used to obtain the position and
confidence value of each type of candidate key points
from the video frame data. Association obtains the
candidate limbs and PAFS between each pair of
heterogeneous key points from the candidate key
points of Localization. Matching is based on the
Association candidate limb and Localization
candidate key points to match the suitable limb and
outline the whole key point skeleton.
ICPDI 2022 - International Conference on Public Management, Digital Economy and Internet Technology
652
The coordinate data of the human pose model is
obtained from the video frame, and the high-level
feature information of the target model is obtained
through the first 10 convolution layers (16
convolution layers and 3 fully connected layers) of
VGG-19. Through the convolution kernel in different
cases to multiply the previous special image on the
map after the original image, a variety of special
feature maps will be obtained. The data and Feature
map are combined with the model L (T) of human key
point detection classification and regression. NMS
outputs the local maximum through non maximum
suppression algorithm. NMS is mainly used to
determine the size and position of bounding boxes in
human posture recognition. Let m be the number of
bounding boxes and the front row of n be the
coordinates of each bounding box. Then the box is a
matrix of m * n. Of course, there are multiple boxes
obtained through multiple operations, and each box
will have different confidence level, and the
coordinates defined by them may overlap and cross.
Eliminate the low confidence boxes and select the box
with the highest confidence each time. The confidence
graph of each box is graphized, and the X, y two-
dimensional coordinates and the corresponding
coordinate information are established. Combining
XY to draw the vector p, then p represents the
confidence of each Localization candidate key point.
PAFS are used to link the pose of human body with
the object in the video frame, and the Association limb
and corresponding confidence map between different
skeletal points are obtained. For the pose of the target
in the video frame, the pair matching generated by
PAFS and the vector data of PAFS pose are obtained.
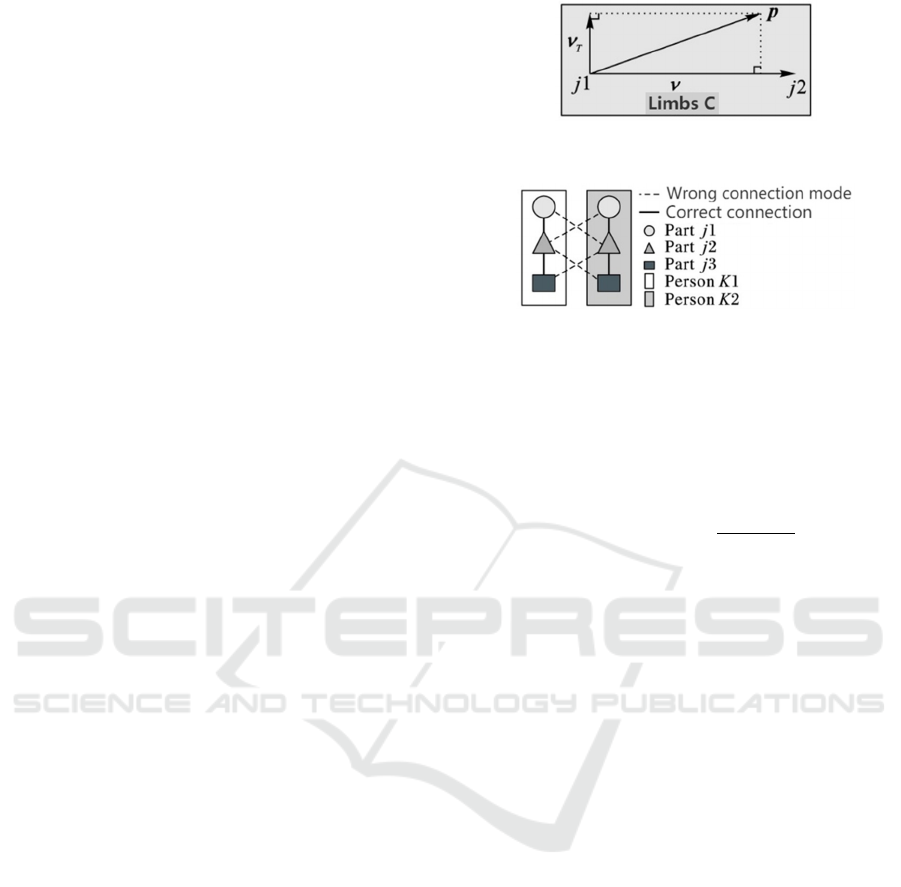
In formula (1), when the candidate key point is on
limb C, if and only if the confidence value of the
candidate key point is relative to the confidence value
of limb C, then the candidate key point is the unit
vector in the direction of limb C; When the point P is
not on the current limb, then the point P is vector 0.
A
𝑝
𝑣, 𝑃𝑜𝑖𝑛𝑡 𝑃 𝑖𝑠 𝑜𝑛 𝐿𝑖𝑚𝑏 𝐶
0, 𝑂𝑡ℎ𝑒𝑟
(1)
As shown in Figure 11, 12, the ν axis is from the
origin of j1 to j2, where j1 and j2 are two different
candidate key points, and | J1-J2 | is the absolute
distance between them. The vT axis is perpendicular
to the ν space vector of a vector. lc is the length of the
current limb C, σ C is the width, and xj1 represents the
spatial coordinate information of j1.
Figure 11: Position judgment method.
Figure 12: Maximum matching method.
Through definite integral, we can calculate all
Localization key points of limb C, Ec of limb c
calculated by current Association, and the unitization
of all points and limb confidence in limb C, which is
conducive to the subsequent calculation, such as
formula (2) ~ (3) (Wang, Li, 2019):
E
𝐴
𝑝𝑢∙
𝑑
(2)
p
u
1 u
∙𝑑
𝑢∙𝑑
(3)
j1 and j2 represent two different candidate key
points, |J1-J2| represents the absolute distance
between them, and P (U) represents any point (0 ≤ u ≤
1) in the existence of | J 1-J 2 | absolute distance.
Through formula (4), (5) (Wang, Li, 2019), each
candidate key point can only be matched with one of
the candidate key points in another type of key points,
so as to prevent the problem that the same node is
selected by multiple nodes in the maximum matching
and form multilateral intersection. Equations (4) and
(5) show that for the random candidate bone point m
from J1 on limb c, only the sum of the confidence
degree of one bone point of J2 can be matched with
the key point of M, and it needs to meet 0 ≤ u ≤ 1
(Wang, Li, 2019). Moreover, the number of matching
key points with M key points is not allowed to be more
than one. In the scheme with zero edge weight vector
between the bone points j1 and j2, the sum of the edge
weight and Ec = 0, and in the scheme with unit weight
vector, the sum of the edge weight and the edge weight
is the unit vector. Therefore, the maximum matching
algorithm obtains the best matching scheme with the
edge weight as the unit vector, and the matching
between the bone points J2 and J3 is the same as the
matching scheme with only the edge weight as the unit
vector.
∑
𝑧
,
,
∈
≤1; ∀𝑚∈𝐷
(4)
Warning of Target Attitude of Crowd in Closed Area Based on CNN and Clustering Algorithm
653
∑
𝑧
,
,
∈
≤1; ∀𝑛∈𝐷
(5)
𝑥
=
(6)
𝑦
=
(7)
In the same frame scene, multiple people's limbs
overlap and objects are covered, which may lead to
incomplete recognition and missing recognition. First,
we need to optimize the algorithm of bone key point
data (6), (7) (Li, Xu, Shi, Zhao, Li, 2021). x. Y is the
coordinate of the bone point, I is the serial number of
the key point, 2 ≤ I ≤ 35. It branches from the neck
bone point, connecting the hand limb, trunk limb and
leg limb, so the neck is an important bone point. If the
pose is incomplete and the data of neck bone points is
missing, the corresponding skeleton will be removed
to reduce the difficulty of overlapping pose
recognition. The number of people in the image will
be reconfirmed according to the adjacent multiple
frames. If the adjacent multiple frames are all missing
neck bone points, the pose skeleton can only be
discarded to improve the efficiency.
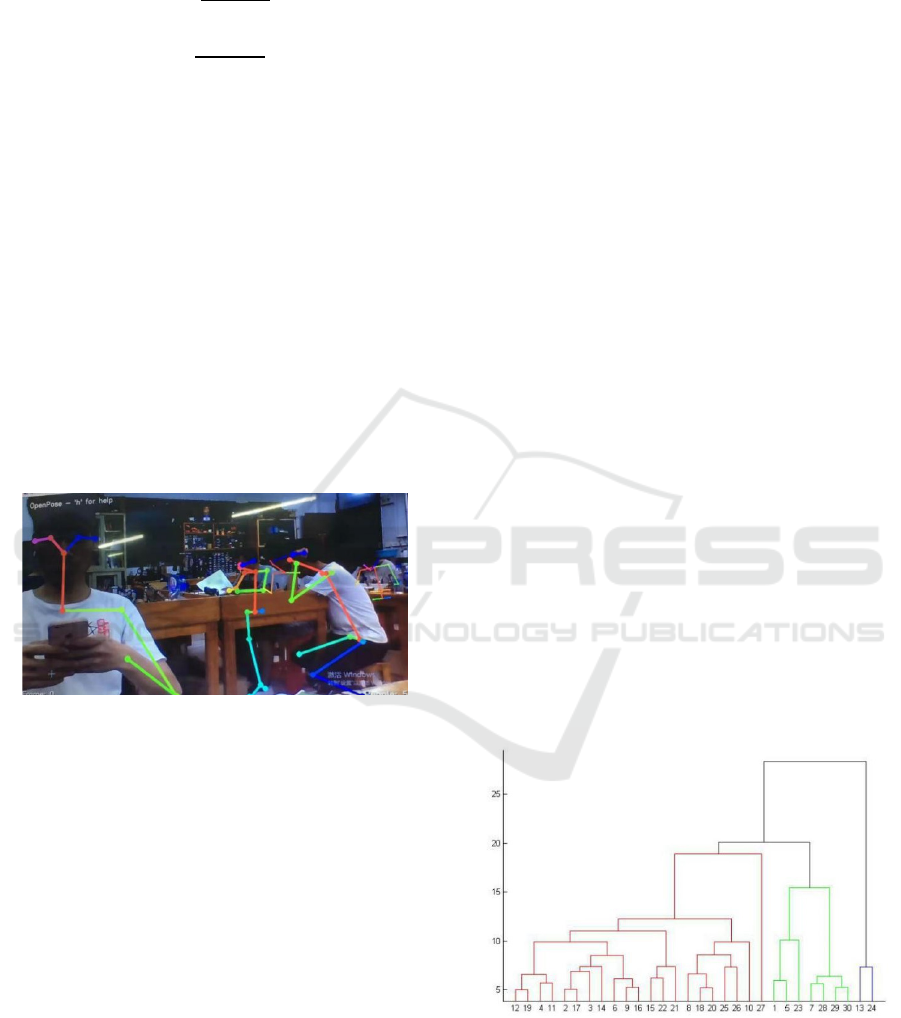
Figure 13: OpenPose Human feature points and skeleton
recognition model.
5 CLUSTER ANALYSIS
5.1 Clustering Algorithm
Clustering analysis plays an important role in
similarity judgment, spatiotemporal location
processing and anomaly class comparison. The
processing steps of most clustering methods are like
this, mainly including data set establishment,
comparison, common point extraction, distance
calculation, determination of data volume and testing
of clustering results. The clustering process of this
paper is as follows (Hou, 2018):
1) Data set building: preprocessing the image data
of human posture, the characteristics of the image data
tend to be the same and the data dimension reduction.
This paper makes a small test set, which mainly
includes standing, slow walking, jogging, sprinting
and a small amount of chaotic posture.
2) Feature selection: extract bone feature points
from different human posture features, and express the
changes of arm limb module and leg limb module in
vector form.
3) Feature extraction: in all kinds of target pose
features, the space coordinates and vector distance of
the limb module are adjusted to form a new feature
standard.
4) Determine the number of data groups: select the
same type of human posture feature for each data
point, compare the differences of data points, calculate
the similarity, and construct the data group by
comparison.
5) Result evaluation.
5.1.1 Hierarchical Clustering Algorithm
Hierarchical clustering is to analyze each layer of the
data in the data set. From small to large, some small
data groups are first combined and analyzed, and then
aggregated. Each time, two data groups with the
shortest similar distance are calculated, and then they
are combined into a large data group according to the
operation, until there is only one large data group
(Chen, Jiang, Wang, 2008)0. The mathematical
structure of the whole data group is like a tree structure
(Figure 14). However, hierarchical clustering requires
a lot of computation and high computing power, and
its results need to continuously cycle all data points.
The larger the data set is, the lower the efficiency of
hierarchical clustering is.
Figure 14: Tree structure data group.
Each data point is independent, and the so-called
similarity is to compare and calculate the point
features through the algorithm. And the data points
with high similarity form a data group by gradually
calculating and clustering. In this paper, the average-
ICPDI 2022 - International Conference on Public Management, Digital Economy and Internet Technology
654
linkage algorithm (Chen, Jiang, Wang, 2008) is used
to test the similar mean of two corresponding data
points in two data groups if and only if each point can
dock with only one data point. In addition to the
average-linkage algorithm, there are single-linkage
algorithm, complete-linkage algorithm and so on.
Among them, the average-linkage algorithm is
relatively efficient, which can divide the number of
data groups and the speed and accuracy of clustering
are relatively nice.
5.1.2 K-Means Clustering Algorithm
K-means clustering algorithm is a special EM
algorithm, which determines the location of data
points according to the expected value of data center
points, and optimizes the data group by clustering
operation (Jin, Liu, Jia, Liu, 2010). It has a very
prominent advantage: fast operation, K-means
algorithm in the T represents the number of iterations.
𝐶
=
∑
𝑥
∈
(8)
𝑆𝐸= 𝑃
𝐶
(9)
Part of K-means algorithm formulaFormula (8)
(Jin, Liu, Jia, Liu, 2010) is to calculate the i-th centroid
(mean value) of the data cluster: CI is the i-th cluster
in the data group, X is the data point of the cluster, Ci
is the i-mean value of Ci, and Ci is the number of
samples in the cluster Ci. Formula (9) ([J / OL].
Computer engineering and application:, 2021) is to
judge the sum of square errors of cluster data points,
where M represents the number of known clusters, and
I and j in Pij represent the i-th and j-th clusters
respectively. And N represents the amount of data, in
which the mean value of the particle center of the ci
data group is determined, and the K-means clustering
algorithm is used to require each data point in the n-th
data group to be as close as possible to the center of
the n-th data group to which they belong, and then the
minimization function is executed, and its time and
space complexity is O (n).
However, in the above clustering calculation, there
is a premise, that is, the element samples and attribute
categories of the data set are independent and
unrelated by default. In fact, in human posture, human
actions are coherent, and there is a necessary
connection between the front and back actions, that is,
they are not independent. Xiang Yixuan et al. ([J /
OL]. Computer engineering and application:, 2021)
proposed the second power processing through the
optimized Q-C-Kmeans algorithm 0, modified the
Pearson correlation coefficient, and obtained the
coupling relationship of the related attributes between
each two data points.
𝐶𝑂𝑅
𝑎
, 𝑎
=
∈
∈
∈
(10)
𝑅
𝐶𝑂𝑅𝑎
, 𝑎
=
𝐶𝑂𝑅
𝑎
, 𝑎
𝑝_𝑣𝑎𝑙𝑢𝑒0.05
0 𝑝_𝑣𝑎𝑙𝑢𝑒0.05
(11)
Formula (10) ([J / OL]. Computer engineering and
application:, 2021) is the Pearson correlation
coefficient calculation: u is the object sample in the
data group, ai and aj represent the corresponding
different attribute columns in the sample data, and the
corresponding μi j is used to represent the data mean
of I and j attribute columns. L is the total number of
data points, and fij (u) corresponds to all attribute
values of attribute I and attribute J in the sample data.
The condition P_ Value of formula (11) ([J / OL].
Computer engineering and application:, 2021)
represents the comparison of i and j data attributes.
5.2 Experiment And Analysis
Through the training of standing, slow walking,
jogging, sprinting and a small amount of chaotic
posture, a small data set with more than 2000 data
points is made as the sample group. In this paper, we
test the average join algorithm of the sample group.
Because the clustering distance of the same type of
attitude data points is similar, we start to merge the
two data points with the shortest distance from bottom
to top, and finally get a cluster, which is roughly the
aggregation form of this type. The training efficiency
of this method can be judged by the aggregation form.
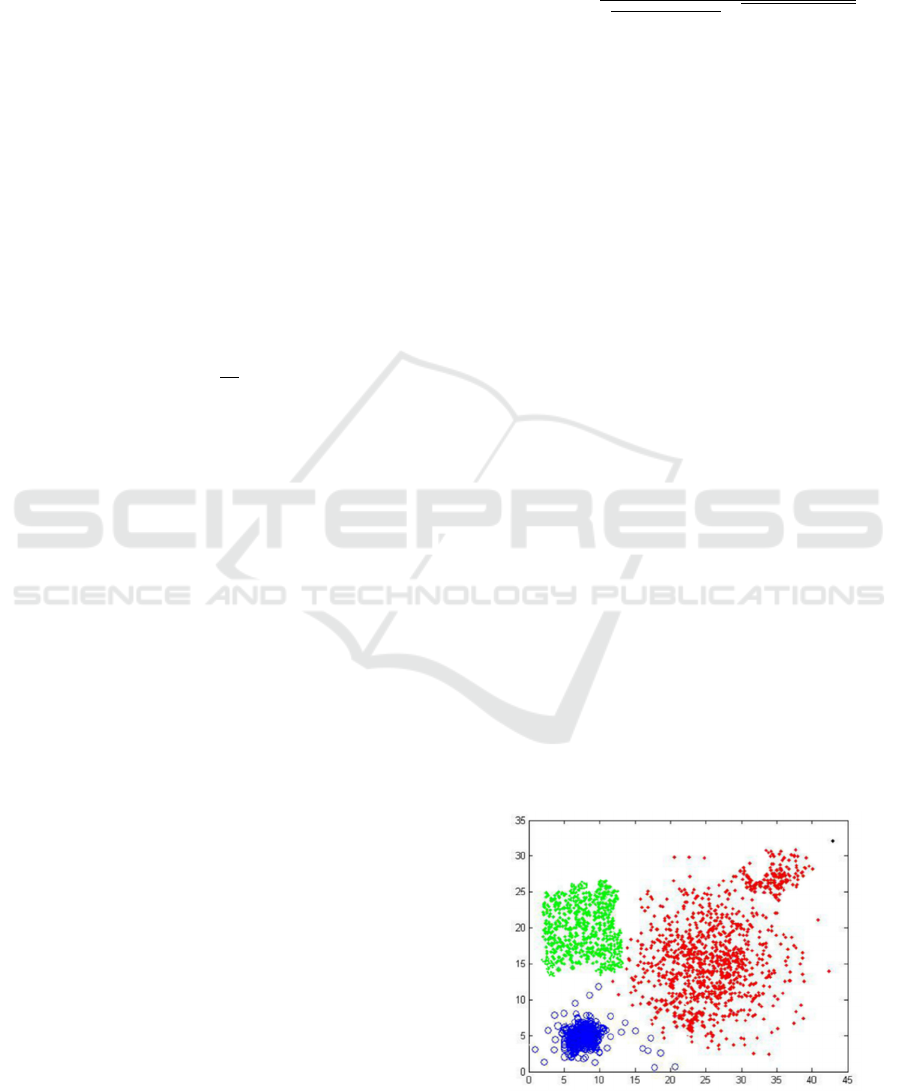
Let the number of data groups be 3, that is, it is
estimated that three results can be obtained (Figure
15).
Figure 15: Hierarchical clustering average-linkage(k=3).
Warning of Target Attitude of Crowd in Closed Area Based on CNN and Clustering Algorithm
655
When k = 3, there are three clusters, but according
to the cluster shape and training data set, there are four
cluster centers. They correspond to standing, slow
walking, jogging, sprinting and a small amount of
chaotic posture.
Because of the poor density of the red data group
and the differentiation of the cluster centers, it shows
that the farthest data points in the data group have less
similarity, and two or more data groups are mixed
together. If k = 4, a new clustering center will be
segmented from the red data group, so as to obtain
more characteristic information of the data set.
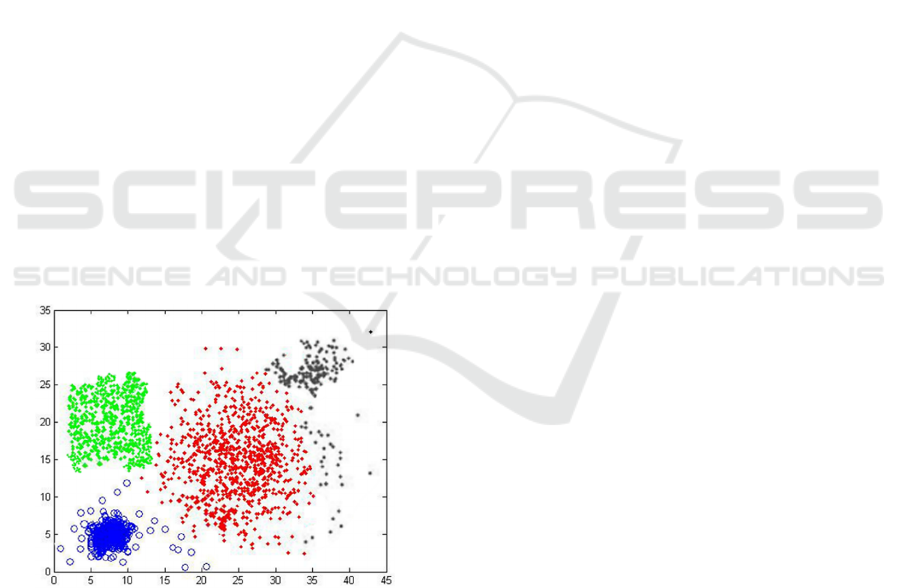
The clustering results are basically consistent with
the training posture information. The green clustering
center is the standing posture, the blue is the slow
walking posture, the red is the jogging posture, and the
black is the sprint posture. The cluster centers of
standing, slow walking and sprint are relatively
concentrated, and the calculation of bone points is
clear. However, slow walking posture changes
greatly, which is similar to the skeletal points of
standing, slow walking and sprinting, so the clustering
is scattered. However, this method is combined with
multi label training, so it has little effect on recognition
efficiency. The scattered black data points below the
black data group are a small amount of chaotic posture
in the data set, so it is difficult to divide the specific K
value, so the main purpose of sharing the black
clustering group is to test the clustering recognition
rate.
Figure 16: Hierarchical clustering average-linkage(k=4).
The training efficiency of this method can be
tested through the test of the data set samples. If it is
necessary to test the local optimum and data centroid
of the data set, it needs to be tested through the K-
means clustering algorithm. Hierarchical clustering
processes data by similarity distance, while K-means
clustering algorithm calculates centroid by locating
data points, which is not necessarily an actual data
point. Speed and efficiency are great advantage of K-
means clustering algorithm. This clustering algorithm
uses the optimized Q-C-Kmeans ([J / OL]. Computer
engineering and application:, 2021) algorithm to
improve the coupling relationship of related attributes
between data points through the second power
processing, which is suitable for the test of low
similarity of different skeletal points. In this way, even
in the test of initial center fuzzification and center
deviation, the algorithm can still improve the internal
cluster structure optimization and the accuracy of data
group classification, and get the preliminary clustering
of data.
For the non-independent identically distributed
data points, the K value of the station, walking and
running attitude tags is tested by the sample group.
The total data points are divided into k = 3 data groups,
the initial centroid is fuzzy, the data points can cluster
by themselves through the distance calculation,
constantly screen and calculate the new centroid and
tend to converge, and finally get the expected optimal
center of a clustering. After several iterations, the
fuzzy result of the initial center of the test cluster is
obtained (Fig. 4). From the clustering results, we can
find that the clustering centers of "standing" and
"walking" posture data are concentrated, while the
centers of "running" are relatively diffuse. The main
reason is that "running" posture includes many kinds
of postures such as jogging and sprinting, and the limb
data gap of bone point calculation is relatively large,
so the center is relatively fuzzy.
The test result of the fuzzy initial center of the
cluster is relatively consistent with the data set.
Combined with the result, the center deviation of the
"running" attitude is tested to test the particle
convergence of the "running" attitude data. Through
the distance calculation of outliers, the centroid is
obtained, and then iteratively divided into "run"
clustering data group. The results show that the center
of outliers is evenly divided, and the segmentation line
is generated iteratively in the convergence region of
centroid. The centroid calculation is not necessarily an
actual data point, and the overall trend is good, which
shows that the center deviation of the data set trained
by this method is small.
ICPDI 2022 - International Conference on Public Management, Digital Economy and Internet Technology
656
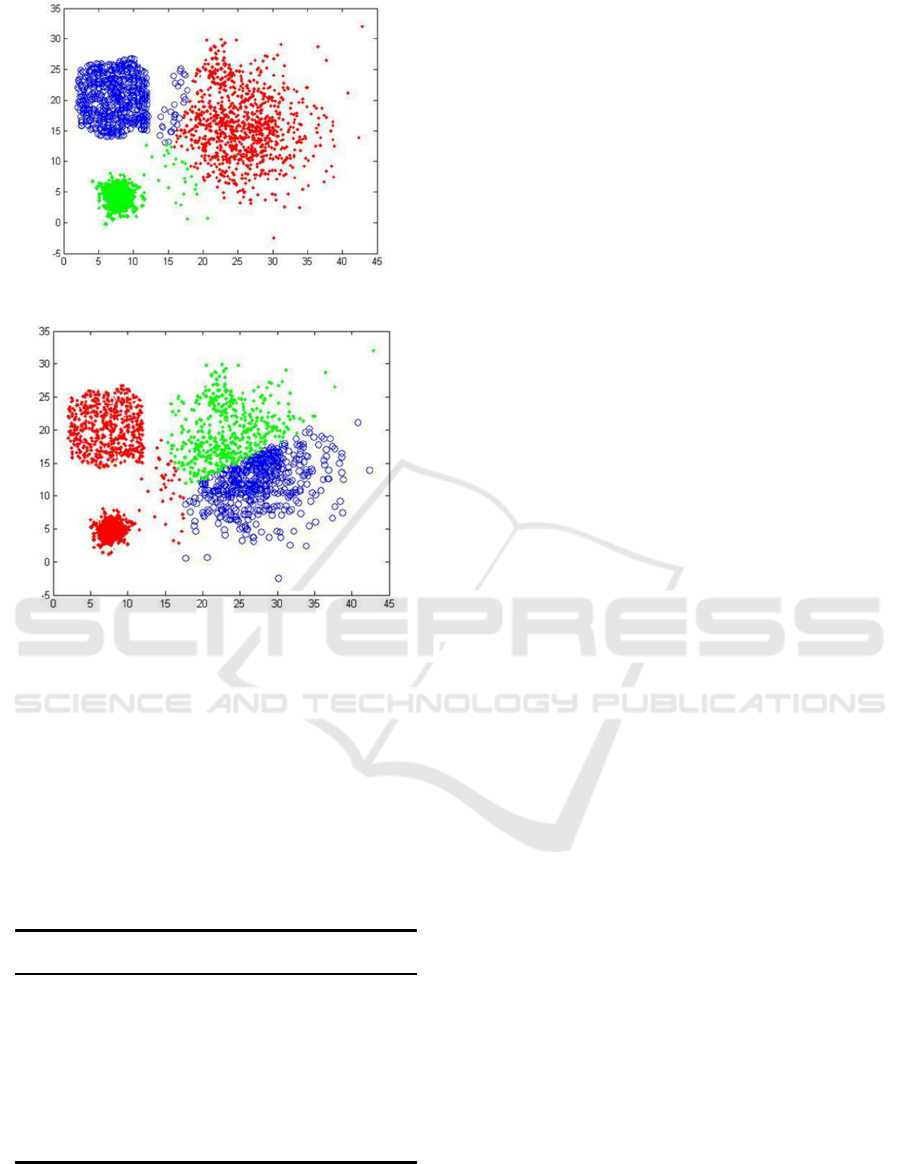
Figure 17: Initial center obscure test.
Figure 18: Initial center deviation test.
In addition to the hierarchical clustering and K-
means clustering to test the proposed method, we also
make a simple comparison with other literature
methods, intercept part of CASIA data set, and carry
out the attitude recognition comparison experiment
between the algorithms in literature (Gao, 2018) and
(Xu, 2017) and the proposed method. After the test,
the attitude recognition rate is obtained, and the
comparison results are shown in table 3.
Table 3: Comparison of recognition results.
Method Test
cate
g
or
y
Total
number
Recognition
rate
literature
(Xu, 2017)
stan
d
150 92. 0%
wal
k
200 82. 5%
run 200 74. 5%
literature
(Gao, 2018)
stan
d
150 94. 7%
wal
k
200 89. 5%
run 200 77. 5%
this method stan
d
150 95. 4%
wal
k
200 91. 5%
run 200 88. 5%
It can be seen from table 3 that this method not
only improves the recognition efficiency of detecting
multiple poses, but also refines the relationship
between different poses by optimizing the label non
independent identically distributed attributes, which
lays a solid foundation for the application of human
pose and object interaction in actual scenes.
6 CONCLUSION
It is an important development direction of intelligent
security to recognize and speculate human posture
behavior. It has research value whether it is used in
public security applications or private space security
applications. But the method based on human posture
feature extraction needs more preparation, the most
important of which is to enrich and diversify the
human posture feature database. Therefore, we need
to improve the classification efficiency of human
behavior posture, the learning efficiency of machine
and robustness. Therefore, this paper combines
convolutional neural network and clustering
algorithm, C3D Two-Stream, OpenPose human
feature points and skeleton recognition model and
YOLOv4 to improve the efficiency of human pose
label classification, machine learning efficiency and
robustness, and improve the accuracy of target pose.
ACKNOWLEDGEMENT
This paper was supported Guangdong Province
Science and Technology Innovation Strategy Special
Fund Project. The project number: pdjh2020b0779;
And Thank you for the project's financial support for
this study, and thank you for the review of the
organizing committee.
REFERENCES
Chen lifeI, Jiang Qingshan, Wang Shengrui. Method for
determining optimal cluster number based on
hierarchical division [J]. Acta Sinica Sinica, 2008 (01):
62-72.
Chu Binbin. Research and implementation of human
behavior analysis technology based on deep learning
[D]. Southeast University, 2017.
Dong Jiale. Design and implementation of regional
pedestrian flow monitoring platform based on big data
[D]. Beijing Jiaotong University, 2018.
Gao Xiang. Analysis of abnormal behavior of pedestrians
in video surveillance [D]. University of Electronic
Science and technology, 2018.
Gao peitao, Wang Yinhe. New method of image
recognition based on structural balance network [J].
Software guide, 2020, 19 (03): 220-224.
Warning of Target Attitude of Crowd in Closed Area Based on CNN and Clustering Algorithm
657

Hou yuanshao. A new clustering algorithm based on deep
learning [J]. Journal of Xinxiang University, 2018, 35
(12): 21-24.
Jin Di, Liu Jie, Jia Zhengxue, Liu Dayou. Data clustering
algorithm based on K-nearest neighbor network [J].
Pattern recognition and artificial intelligence, 2010, 23
(04): 546-551.
[J / OL]. Computer engineering and application: 1-13
[2021-03-25].
Li Qi, Jiang Shasha. Fusion recognition method of attitude
and object for home security system [J / OL]. Chinese
scientific paper: 1-7 [2021-04-15].
Li Menghe, Xu Hongji, Shi Leixin, Zhao Wenjie, Li Juan.
Multi person behavior recognition based on bone key
point detection [J / OL]. Computer science: 1-8 [2021-
04-03].
Liu lulu. Research on human behavior recognition based on
convolutional neural network [D]. University of science
and technology of China, 2017.
Song Jianlin. Research on improvement of K-means
clustering algorithm [D]. Anhui University, 2016.
Wang C Y, Bochkovskiy A, Liao H Y M. Scaled-yolov4:
Scaling cross stage partial network[C]. Proceedings of
the IEEE/cvf conference on computer vision and
pattern recognition. 2021: 13029-13038.
Wang J B, Li Jun. detection method of human bone key
points based on openpose slim model [J]. Computer
applications, 2019, 39 (12): 3503-3509.
Wang Lin. research on improved object detection algorithm
based on Yolo [D]. Jiangnan University, 2020.
Xu Wentao. Research and implementation of key
algorithms for moving target tracking detection and
recognition [D]. Southeast University, 2017.
Yang Yahu, Wang Yu, Chen Tianhua. Remote video
surveillance abnormal image detection based on deep
learning [J]. Telecommunication technology, 2021, 61
(02): 203-210.
Yu Shengbo. Multi label transfer learning based on sample
differences [D]. Chongqing University, 2016.
ICPDI 2022 - International Conference on Public Management, Digital Economy and Internet Technology
658
