
Research on Carbon Futures Forecast and Related Asset Impact
Analysis Based on ARIMA-GARCH and RBF Contribution Analysis
Wenhui Wang
1
, Xinhang Wu
2
and Yifan Wu
3,*
1
School of Finance, Zhejiang University of Finance & Economics, 310018, Hangzhou, China
2
School of Statistics, Southwestern University of Finance and Economics, 611130, Chengdu, China
3
School of Mathematics, Sun Yat-Sen University, 510275, Guangzhou, China
Keywords: Carbon Futures, ARIMA-GARCH Model, RBF Neural Network, Contribution Analysis.
Abstract: To studies the trend of carbon futures price and influencing factors. In this paper, the EU carbon financial
emission market carbon trading settlement price EUA is selected as the research object. Based on the carbon
futures price data from 2008 to 2021, this paper constructs an Autoregressive Integrated Moving Average-
generalized autoregressive conditional heteroscedasticity model to Forecast the price of carbon futures in the
next three months. On this basis, the RBF (Radial Basis Function) neural network is constructed, and seven
indexes such as stock index and crude oil price were selected from the aspects of energy and finance to analyze
the contribution of the carbon price. The results are as follows: The ARIMA-GARCH model predicts that
EUA prices will increase significantly in the next three months. The stock market is the most influential
economic factor, followed by energy. Finally, this paper puts forward corresponding policy suggestions
according to the results.
1 INTRODUCTION
Under the severe form of global warming, carbon
emission has attracted increasing attention from the
international community. The European Emissions
Trading System, established by the European Union
in 2005, is the world's most extensive carbon
emissions trading system, in which carbon futures
have proved to be not only an essential tool for
people to cope with climate change but also an
effective method for producers and consumers to
manage and hedge risks. (Tang, Wang, Li, Yang &
Mi 2020) In 2020, China will strive to achieve the
goal of carbon peak by 2030, achieve carbon
neutrality by 2060, and start constructing a national
carbon trading market. The experience and lessons of
the European Union in carbon finance are of great
reference significance for China to build a tough
carbon finance market.
There is a wide range of studies on carbon
finance, and this paper considers EUA carbon
futures. The main research direction of EUA
literature is the price of EUA spot futures, including
price prediction, market arbitrage, energy prices, and
the impact of economic factors. In terms of price
prediction, Yah Architects et al. (Yahşi, Çanakoğlu &
Ağralı 2019) used an artificial neural network and
decision tree algorithm to predict carbon prices using
Brent crude oil futures, coal, electricity, and natural
gas prices, as well as DAX and Standard & Poor's
indexes as explanatory variables. In the aspect of
market arbitrage, researchers hope to find a pricing
model of the carbon price and explain the underlying
mechanism of the carbon price. Stefan (Trück &
Weron 2016) found that participants were willing to
pay an additional risk premium in the futures market
to hedge against the increasing volatility of EUA
prices. In terms of energy price factors, Dutta (Dutta
& Anupam 2017) assessed the impact of the oil
market on carbon prices and concluded a strong
correlation between implied fluctuations in the oil
market and carbon prices. Qiang et al. (Ji, Zhang &
Jiang-bo, et al. 2018) proved that Brent crude oil
price plays an important role in influencing carbon
price changes and risks. For example, in terms of
economic factors, Yuan (Yuan & Yang 2020), using
generalized autoregressive - dynamic copulas,
connects the model to study financial market
uncertainty and asymmetric risk spillover between
the carbon market. It is concluded that systemic event
occurs, the uncertainty of the stock market than the
uncertainty of the crude oil market in risk transfer to
the carbon market showed a more significant impact.
Wang, W., Wu, X. and Wu, Y.
Research on Carbon Futures Forecast and Related Asset Impact Analysis Based on ARIMA-GARCH and RBF Contribution Analysis.
DOI: 10.5220/0011757600003607
In Proceedings of the 1st International Conference on Public Management, Digital Economy and Internet Technology (ICPDI 2022), pages 731-738
ISBN: 978-989-758-620-0
Copyright
c
2023 by SCITEPRESS – Science and Technology Publications, Lda. Under CC license (CC BY-NC-ND 4.0)
731
To forecast and study the EU carbon futures
EUA, this paper establishes the ARIMA-GARCH
model based on the EUA price data of January 7,
2008, solstice, and May 18, 2021, and carries out the
forecast for the next 12 weeks. The RBF neural
network model is established based on the EUA price
data of March 22, 2010, solstice, and June 3, 2021,
to explore the influence mechanism of economic and
energy factors on carbon futures price and the degree
price change.
2 PRICE ANALYSIS OF CARBON
FUTURES
2.1
Policy Analysis
The fourth phase of the EU's EUETS program begins
in 2021. This phase will bring stricter rules, with a
new target of cutting emissions by 40% by 2030. To
meet the target, the industries covered by the EU's
Emissions Trading Scheme would have to cut their
emissions by 43% from 2005 levels. The total quota
would have to fall by 2.2% a year from 2021 and by
1.74% in the third phase. Industries under the EU's
Emissions Trading Scheme will reduce emissions by
an additional 556m tonnes over the next decade.
Therefore, it is essential to study the factors of carbon
price fluctuation and the degree of change. The study
on the EU carbon futures price in this paper can
enrich the methods of studying the carbon financial
market and provide a good reference for investors to
avoid risks and policymakers to stabilize the carbon
financial market.
2.2 Analysis of Influencing Factors
2.2.1 Energy Price Factors
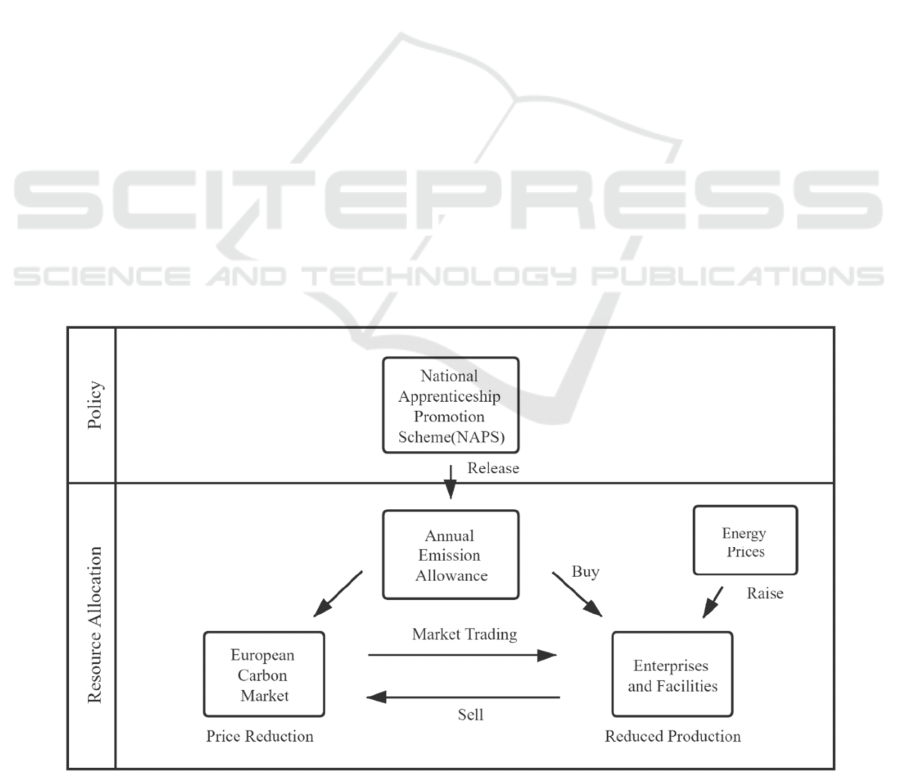
Energy supply and demand will affect companies'
production behaviour, which will affect the carbon
price. From a supply point of view, market
participants can obtain the amount of carbon dioxide
allotted annually from the National Distribution
Plans (NAPS). From the perspective of demand,
enterprises and facilities can choose to pay for the
carbon emission right according to their energy
consumption level and buy and sell the quota
according to their actual emissions. When the price
of energy changes, the price of related products will
also change, and enterprises will adjust their
production level accordingly, affecting carbon
emissions. Actual emissions depend on the type of
energy. The schematic diagram is shown in Figure 1.
Among them, the crude oil price is the continuous
price of Brent crude oil futures. At present, more than
65% of the world's physical crude oil is priced by the
Brent system. Brent, whose main customers include
refineries in northwest Europe, is a good proxy for
the cost of oil for European energy inputs.
Figure 1: Schematic diagram of price impact.
ICPDI 2022 - International Conference on Public Management, Digital Economy and Internet Technology
732

Natural gas price is the natural gas futures price
at the National Equilibrium Point (NBP) in the UK.
The prices of various trading markets in the EU are
correlated and interactive. Among them, NBP is the
most representative market, which can be used to
represent the natural gas cost of energy input in
Europe.
The coal price is based on the spot price of coal
for the next month's delivery in
Antwerp/Rotterdam/Amstor (ARA) at various
European ports. The coal trading price index is
published weekly, representing the cost of imported
coal in northwest Europe.
As the primary source of carbon emissions and
the main entity to purchase carbon emission quotas,
power enterprises will greatly impact the carbon
market. However, the power price factor is not
correlated with carbon emissions as other energy
variables, and the power conversion variable can be
given by Equation (1). P is the cost of carbon
emissions of the balance. 𝑃
and 𝑃
are the
corresponding price of coal and natural gas at the
corresponding time point.𝑀
𝑎𝑛𝑑 𝑀
are the carbon
emissions for each 10
units of electricity
generated by two different power generation
methods.𝐾
and 𝐾
are conversion variables, which
are related to the type of settlement currency, unit
commodity quantity, and power generation
efficiency. The P of the equilibrium point is the target
power conversion.
CG
CG
CG
PP
PM PM
kk
×+ =×+
(1)
2.2.2 Economic Factors
Economic factors will lead to the fluctuation of
carbon futures prices. Carbon emission permits are
the production costs of enterprises with high energy
consumption. The rise and fall of the price of carbon
emission permits may affect a particular industry, and
the prosperity degree of the industry will also affect
the carbon price. For example, the stock market
index mainly reflects the profit expectation of
enterprises and investors' optimism about the
prospect of economic development, which will affect
the production of enterprises and thus affect carbon
emissions. However, different markets have different
paths and degrees of influence.
The economic factors used in this paper include
the CRB index price that reflects the bulk commodity
market. The CRB index includes the price fluctuation
of the core commodity, which is widely used to
observe and analyze the price fluctuation of the
commodity market and the macro-economic
fluctuation and reveal the future trend of the macro-
economy to a certain extent.
The Stoxx 50 Index, which reflects the stock
market, is a weighted average index composed of 50
super blue-chip stocks listed in the capital markets of
12 countries such as France and Germany, which are
members of the European Union. The financial
securities circles regard the index as an indicator of
the overall situation of the share prices of large listed
companies in the eurozone.
The Traxx Europe International Credit
Derivatives Index, which reflects the bond market,
comprises one hundred and twenty-five (125) liquid
European entities with investment-grade credit
ratings. It can be regarded as a benchmark index for
the continental bond market, and investors can use it
to obtain the latest developments in the European
bond market.
3 EUA FORECAST BASED ON
ARIMA-GARCH
𝐴𝑅𝐼𝑀𝐴
𝑝, 𝑑, 𝑞
(summation autoregressive moving
average model) is a method with high short-term
prediction accuracy. It is composed of difference
order, autoregressive model, and moving average
model. The non-stationary time series of the ARIMA
model is transformed into the ARMA model by d-
order difference. The form of the model is:
(2)
),0(~
2
σε
WN
t
(3)
Meanwhile, the data stationarity should be tested
before using the 𝑨𝑹𝑰𝑴𝑨(𝒑, 𝒅, 𝒒) model.
The generalized autoregressive conditional
heteroscedasticity model (GARCH) is mainly aimed
at autocorrelation, which can effectively fit the
current conditional variance with long-term
correlation. 𝑮𝑨𝑹𝑪𝑯(𝒑, 𝒒) model satisfies:
(4)
(5)
(6)
This paper uses the EU carbon futures settlement
price (EUA) to establish an ARIMA-GARCH model
and uses this model to forecast the EUA price in the
next three months.
tt
d
BxB
ε
)()( Θ=∇Φ
ttt
u
ε
σ
=
==
−−
++=
q
i
p
i
itiitit
u
11
22
0
2
σβαασ
)1,0(~ N
iid
t
ε
Research on Carbon Futures Forecast and Related Asset Impact Analysis Based on ARIMA-GARCH and RBF Contribution Analysis
733

Figure 2: RBF Philosophy diagram.
4 RBF NEURAL NETWORK
RBF neural network is a kind of local approximation
neural network, which usually has only one hidden
layer. The process of mapping the data of the input
layer to the hidden layer applies the idea of the kernel
function, which is nonlinear. The transformation of
the hidden space pointing to the output layer is linear.
It is nonlinear for the data itself, but for the
corresponding parameters, it is linear, which will
significantly simplify the solution of the parameters,
so it has a great advantage in the learning speed
compared with the traditional BP neural network.
The hidden node of the RBF neural network uses
the distance between the input mode and the centre
vector as the independent variable of the function and
uses the radial basis function as the activation
function. In most cases, the Gaussian function is used
as the radial basis function. The corresponding
activation functions are as follows:
)
2
1
exp()(
2
2
imim
cxcxR −−=−
σ
(7)
𝒙
𝒊
is the vector corresponding to the original
explanatory variable, while 𝝈
𝟐
is the variance of the
Gaussian function. The expression from the input
layer to the hidden layer is as follows:
)exp(
j
j
j
D
cX
z
−
−=
(8)
In the above formula, 𝑪
𝒋
can be regarded as the
centre vector corresponding to the 𝒋 th hidden layer
neuron, which is composed of the central
components of all 𝒙 in the input layer connected by
the 𝒋 th neuron in the hidden layer. 𝑫
𝒋
is the width
vector of the j th neuron in the hidden layer. The
linear expression from the hidden layer to the output
layer is:
=
=
p
i
jiji
zy
1
ω
(9)
−=
m
j
ijj
cyd
P
2
1
σ
(10)
RBF neural network has a considerable performance
on dealing with the details of related variables, with
a good effect on various financial data with large
time series fluctuations. In this paper, based on the
RBF model, through the contribution analysis of
European economic indicators and energy prices
related to EUA, the influence of seven explanatory
variables on EUA price fluctuation is obtained.
5 RESEARCH ON CARBON
FUTURES FORECAST AND
RELATED ASSETS IMPACT
ANALYSIS BASED ON
ARIMA-GARCH AND RBF
NEURAL NETWORK
5.1 Carbon Futures Forecast Based on
ARIMA-GARCH
Daily EUA carbon futures settlement price is all from
the WIND database, from January 7, 2008, to May
18, 2021, with 3440 samples. The calculated average
value of every five days is taken as weekly data, and.
ICPDI 2022 - International Conference on Public Management, Digital Economy and Internet Technology
734

Table 1: Stationarity test results.
ADF test
Critical value
0.01
Critical value
0.05
Critical value 0.10 P-value Lag order
-18.11 -3.44 -2.87 -2.57 2.54e
-30
3
(a)ACF (b)PACF
Figure 3: ACF PACF Schematic Diagram.
Figure 4: Fitting renderings.
the carbon futures price data are processed for 688
sets of data. Before establishing the ARIMA model,
the ADF test method is used to carry on the
stationarity test to the weekly data. See Table 1.
The results show that after the third-order
difference of the weekly average EUA price data, the
ADF test value of the EUA price sequence is less than
the critical value of 1% confidence interval under the
confidence of 1%, 5%, and 10%. The p-value is much
less than 0.1, showing that the EUA price data is
stable. Autocorrelation diagram (ACF) and partial
autocorrelation (PACF) diagram are used to
determine the Model parameters of the ARIMA
model, which can be seen in Figure 3.
By observing chart (a), it is found that the AR part
of the weekly average EUA price is a trailing order of
order 5, that is, AR (5). By observing graph (b), it is
found that the MA part of the sequence shows a
typical uncensored property. On this basis, this paper
uses the BIC criterion to determine the order of the
ARIMA model accurately. By comparing the BIC
values of ARIMA(4,3,1) , ARIMA(4,3,2) ,
ARIMA(5,3,1), ARIMA(5,3,2) , the final model is
ARIMA(5,3,1) . Confirm the corresponding
parameters and determine the model for forecasting
futures as follows. Meanwhile, the relevant results
can be found in Figure 4.
𝑥
1.1974𝑥
0.5213𝑥
0.5213𝑥
1.2979𝑥
1.2979𝑥
𝜀
7.7025𝜀
(11)
The white noise test was carried out on the
residual data, and the result showed that the residual
sequence was not white noise, indicating that the
information in the data was not fully extracted. On
this basis, GARCH (1,1) model was established for
Research on Carbon Futures Forecast and Related Asset Impact Analysis Based on ARIMA-GARCH and RBF Contribution Analysis
735

the residual sequence in this paper. The model is as
follows:
𝛔
𝐭
𝟐
= 𝟎. 𝟒𝟕𝟑𝟖 + 𝟎. 𝟑𝟒𝟗𝟏𝛍
𝐭𝟏
𝟐
+ 𝟎. 𝟒𝟗𝟕𝟏𝛔
𝐭𝟏
𝟐
(12)
On this basis, the model is used to predict the
carbon futures EUA price in the next 12 weeks, and
the results are shown in Table2.
Table 2: Forecast data for the next 12 weeks.
Week1 Week2 Week3 Week4
20.37 22.81 22.67 22.51
Week5 Week6 Week7 Week8
24.97 24.84 24.69 27.14
Week9 Week10 Week11 Week12
27.02 26.87 26.88 29.33
The RMSE value of the residual sequence of the
relevant data is calculated, and the fitting effect of the
model is judged. The calculated result was
RMSE=2.89, indicating that the fitting effect of the
model was good and the reliability of the prediction
results was extensive. From the forecast results, the
EU carbon futures price is on an upward trend in a
short period, which may be affected by a series of
factors, such as the European political situation, good
EU policy guidance, financial market fluctuations,
etc. Therefore, carbon futures investors and related
enterprises need to make an optimal decision by
considering all aspects of factors when investing.
5.2 Contribution Analysis of Related
Assets Based on RBF Neural
Network
The prices of crude oil, natural gas, coal, and CRB of
commodities, iDraxx of bonds, and STOXX 50 index
of stocks used for contribution analysis are all derived
from the Wind database. There are 2876 observation
time points based on the settlement price and closing
index corresponding to the trading day from March
22, 2010, to June 3, 2021, in which bond-related data
show a tiny proportion of breakpoints and outliers.
Numerous interpolations are carried out by using
multiple interpolation methods and the K-means
clustering method. The SWITCH power conversion
variables are obtained by solving the formula (1).
Descriptive statistics of 7 types of variables can be
found in Table 3.
A relatively optimal RBF network model is
constructed, in which the number of nodes in the
input layer is the number of the input layer is 7 of the
input variables, corresponding to the corresponding
index of the normalized influencing factors, the
output is the EUA price, and the number of nodes in
the output layer is 1. In the model construction, 69.6%
of the data points were selected as the training set.
30.4% of the data points were selected as the test set.
The best performance was achieved when the
Softmax function was selected as RBF, and the
hidden layer had 99 neurons.
The training error and test error corresponding to
the RBF carbon futures price model are less than
0.1%, and the model shows good robustness. The
fitting effect between the measured price and the
predicted price can be seen in Figure5. The scattered
points are concentrated on both sides of the straight
line with a As can be seen from the figure, the slope
of the predicted results are close to 1, indicating the
constructed model can accurately predict the carbon
futures price.
Table 3: Descriptive statistics of explanatory variables.
Variations Symbol Mean Std Min Max Median Skew Kurt
EUA EUA 12.90 0.17 2.7 56.49 8.07 1.50 2.32
Stoxx50 STOCK 3104.1 7.92 1995.01 4088.5 3137.1 -0.31 -0.52
Oil Price OIL 76.20 0.50 19.33 126.65 69.02 0.21 -1.30
Gas Price GAS 50.05 0.28 8.74 77.86 51.13 -0.38 -0.61
COAL Price COAL 78.51 0.40 38.55 131.50 78.55 0.36 -0.44
CRB COMM 232.48 1.15 106.28 370.56 200.87 0.30 -1.28
iTraxx BOND 82.46 0.64 41.26 207.96 71.73 1.14 1.34
Balance P ESWITCH 91.50 0.83 -6.38 185.70 86.05 0.34 -0.5
ICPDI 2022 - International Conference on Public Management, Digital Economy and Internet Technology
736
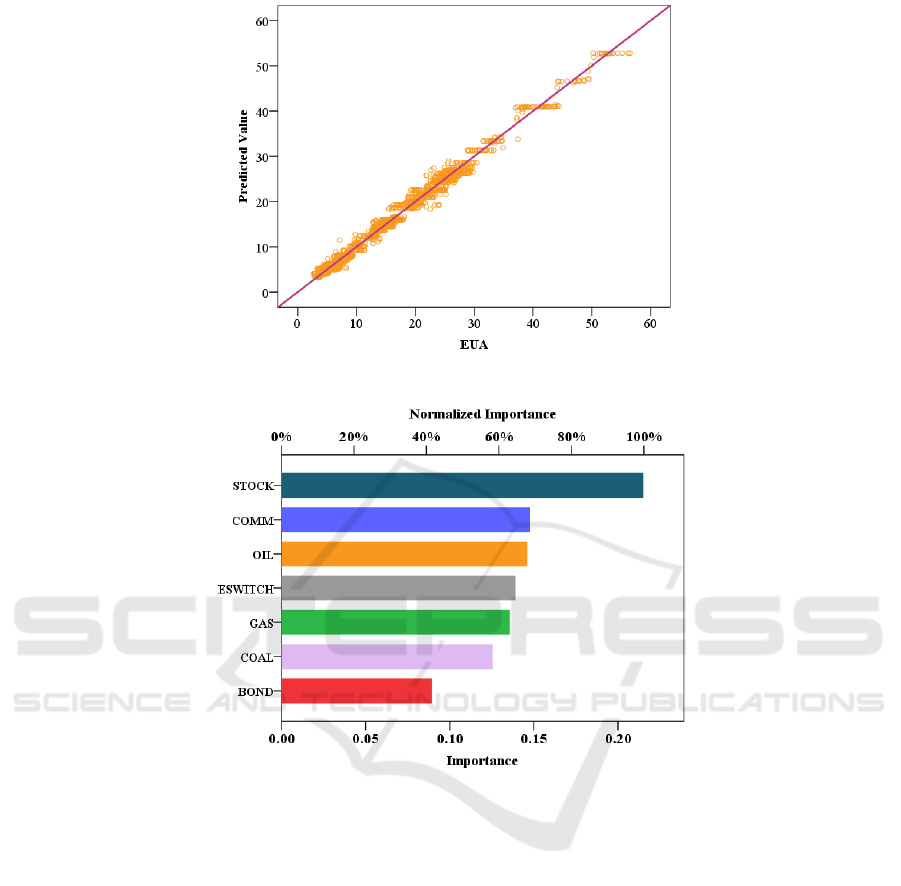
Figure 5: The fitting price corresponds to the EUA scatter diagram.
Figure 6: Contributions of explanatory variables.
The contribution of seven types of related assets can
be vividly analyzed by Figure 6.
(1) from the perspective of various indicators at
the economic level, the stock index has the most
significant impact on the trend of carbon futures
prices, and the rise of the stock index often indicates
that the overall economic trend is developing for the
better, which effectively promotes enterprises to
participate in quota market trading, so carbon futures
price will also be higher. The fluctuation of the
commodity index will also affect the trend of carbon
futures because there is always a direct correlation
between the flow speed of commodities and the
carbon emissions produced by enterprises.
(2) Three different energy prices are of the same
importance to the final carbon futures price in the
energy market. The crude oil price has a significant
positive impact on the carbon futures price. The
fluctuation of this price will often prompt large
chemical enterprises to adjust their quota demand.
Electrical switching variable importance degree on
natural gas and coal, the influence of the lower than
the price of crude oil, but in fact, power conversion
variable is affected by many factors, such as the
maximum power limit of power plant units, the
government's macro-control of national electricity
price and many other factors. It can not carry all the
information about the raw material adjustment of the
power plant according to the carbon futures price
under the ideal condition. The power conversion
variable is directly linked to the overall supply and
demand of carbon emission rights, and its
contribution to EUA price will be more obvious.
Research on Carbon Futures Forecast and Related Asset Impact Analysis Based on ARIMA-GARCH and RBF Contribution Analysis
737

6 CONCLUSION
This paper aims at the trend of European carbon
futures price, and its influencing factors take the EUA
price trend from 2008 to 2021 as the research object,
extracts the information from the residual term of
time series model by constructing ARIMA-GARCH
model, and obtains the prediction result with good
fitting effect. RBF neural network is used to
contribute quantitative analysis. The specific
conclusions are as follows :
(1) This paper uses EUA price data of 2008 and
2021 to forecast the carbon futures price in the next
12 weeks. According to the forecast results, the
settlement price of carbon futures is still in the rising
stage in the short term, which may be affected by a
series of factors such as the supply relationship of
carbon quotas, market arbitrage speculation, and
relevant policies.
(2) The stock market has the most considerable
influence among economic factors, and its
contribution reaches 0.215. Among other factors,
commodity market has a more significant impact on
economic factors, while bond has a minor impact on
economic factors. As for energy, different energy
sources have similar effects on prices, with crude oil
having the most considerable impact. The actual
contribution of the power conversion variable switch
to carbon futures prices is likely to be underestimated
due to many factors.
REFERENCES
Ai Ming, Wang Hailin, Wen Wukang, & Pan Xunzhang.
(2018). Analysis of the factors affecting the price of EU
carbon futures. Environmental Economics Research,
3(03), 19-31.
Dutta, & Anupam. (2017). Modeling and forecasting the
volatility of carbon emission market: the role of outliers,
time-varying jumps and oil price risk. Journal of
Cleaner Production, S095965261732807X.
Mustafa Yahşi, Ethem Çanakoğlu & Semra Ağralı (2019)
Carbon price forecasting models based on big data
analytics, Carbon Management, 10:2, 175-187.
Qiang, Ji, Dayong, Zhang, & Jiang-bo, et al. (2018).
Information linkage, dynamic spillovers in prices, and
volatility between the carbon and energy markets.
Journal of Cleaner Production.
S Trück, & Weron, R. . (2016). Convenience yields and risk
premiums in the EU‐etc—evidence from the Kyoto
commitment period. Journal of Futures Markets, 36(6),
587-611.
Tang, L. Wang, H. , Li, L. , Yang, K. , & Mi, Z. . (2020).
Quantitative models in emission trading system
research: a literature review. Renewable and
Sustainable Energy Reviews, 132, 110052.
Yuan, N., & Yang, L. . (2020). Asymmetric risk spillover
between financial market uncertainty and the carbon
market: a gas–DCS–copula approach. Journal of
Cleaner Production, 259(1), 120750.
ICPDI 2022 - International Conference on Public Management, Digital Economy and Internet Technology
738
