
Melon Diameter Estimation for Sorting System Based on
Image Processing
Syamsiar Kautsar
1
, Budi Hariono
2
, Rizza Wijaya
2
, Aulia Brilliantina
2
, Elok Kurnia Novita Sari
2
,
Risse Entikaria Rachmanita
1
and Muhammad Yunus
3
1
Department of Engineering, Politeknik Negeri Jember, Indonesia
2
Department of Agricultural Technology, Politeknik Negeri Jember, Indonesia
3
Department of Health, Politeknik Negeri Jember, Indonesia
budihariono1966@gmail.com
Keywords: Melon, Image Processing, RGB, Diameter.
Abstract: Human visual perception of melon quality is complex because it depends on many internal and external
factors. One critical internal factor is each farmer's visual perception, which usually varies. Sorting is choosing
between good yields and poor yields. While grading is the grouping of harvested crops that have been sorted.
Sorting and grading depend on market demand. The Sorting Equipment was measured w x l x h = 100cm x
60cm x 100 cm and is made of an aluminum frame and covered by a red polycarbonate board. Inside the
sorting box, two cameras are pointing at a melon cup. The melon cup consists of a circular board connected
to a servo motor so that it can rotate the melon position. It aims to obtain several shooting angles for the test
data. 3 LED lights lead to the melon container at an angle of 45 degrees with a distance of +-60 cm. Based on
the research that has been done, the results of the estimated diameter after testing have a deviation of 1.32 cm.
1 INTRODUCTION
Melon is a fruit plant belonging to the Cucurbitaceae
family, melon fruit comes from the Persian Hot
Valley or the Mediterranean area, which is the border
between West Asia and Europe and Africa, so this
plant can be widely spread to the Middle East and
Europe. In the 14th century, melons were brought to
America by Columbus and are commonly grown in
Colorado, California, and Texas. Finally, melons
spread worldwide, especially in tropical and
subtropical areas, including Indonesia. Melon is an
annual plant that grows creeping, similar to the
cucumber plant. But in its cultivation, melon plants
can be propagated on bamboo poles (ajir) (Kim K
Kim K Kim H and Lee K, 2006).
Human visual perception of melon quality is
complex because it depends on many internal and
external factors. One critical internal factor is each
farmer's visual perception, which usually varies
(Tournier J, 2019).
While the external factor is the object's
composition in relation to light reflection,
environmental lighting, illumination distance and
angle, and viewing position. Postharvest handling
involves collecting, sorting, classifying, packaging
and storing fruit based on predetermined sizes and
quality standards. The steps for each post-harvest
activity are as follows (Droby S and Wisniewski M,
2018):
a) Collection
The melons that have been harvested are collected in
one place to be sorted immediately. Transport from
the farm to the collection point must be carried out
carefully.
b) Sorting and Classing (Grading)
Sorting is choosing between good yields and poor
yields. While grading is the grouping of harvested
crops that have been sorted. Sorting and grading
depend on market demand. The elements to be
considered in sorting/selection (Dewi T Risma P and
Oktarina Y, 2020).
After sorting, melons are then grouped and
weighed for grading based on fruit weight and
physical appearance. The classification of melons is
divided into three classes. Meanwhile, young,
overripe, bruised, deformed and other fruits are
classified as off-grade (outside class). Consumer
Kautsar, S., Hariono, B., Wijaya, R., Brilliantina, A., Sari, E., Rachmanita, R. and Yunus, M.
Melon Diameter Estimation for Sorting System Based on Image Processing.
DOI: 10.5220/0011761700003575
In Proceedings of the 5th International Conference on Applied Science and Technology on Engineering Science (iCAST-ES 2022), pages 295-299
ISBN: 978-989-758-619-4; ISSN: 2975-8246
Copyright © 2023 by SCITEPRESS – Science and Technology Publications, Lda. Under CC license (CC BY-NC-ND 4.0)
295
perception is important to be fulfilled, so the results
of agriculture and plantations must be adjusted to the
standard (Kurnianto M Wibowo M Hariono B Wijaya
R and Brilliantina A, 2020).
2 RELATED WORK
An image is a two-dimensional Value function f (x,y),
where x and y are spatial coordinates and f at a point
(x,y) is the brightness level of an image at a point. An
image is obtained from capturing the strength of the
light reflected by the object. The image as the output
of the recording device can be an analog or a digital
image. Digital image processing is a process that aims
to manipulate and analyze images with the help of
computers. The analysis process in image processing
involves visual perception with input data and output
data obtained in the form of images of the observed
object. Image processing techniques can include
several aspects such as image sharpening,
highlighting specific features of an image, image
compression, and correction of out-of-focus or blurry
images (Chen H, 2021).
The step in digital image processing begins with
capturing or capturing images (image acquisition)
using sensors in the form of cameras, scanners, etc.
Then proceed with the preparation process
(preprocessing), such as the process of changing the
size (image resizing) or quality improvement (image
enhancement) before finally being used for a specific
purpose. The next step is to divide the image into its
constituent parts (segmentation). This process is done
to separate the desired object apart from other objects.
Because the result of the segmentation process is the
boundaries between the object to be observed further
with other objects, it is necessary to make further
observations (representation and description) to show
that the area within the boundary is the actual object
being observed. The last stage of image processing is
recognition and interpretation and interpretation).
Recognition is the process of assigning a label to an
object based on the information provided by its
descriptor. In contrast, interpretation includes giving
meaning to an object, a set of recognizable objects.
Image classification can use various algorithms,
such as KNN (Z E Fitri A Baskara A Madjid A M N
Imron, 2022), or Neural Network (R Y Adhitya A
Khumaidi S T Sarena S Kautsar B Widiawan and F L
Afriansyah, 2020). An artificial neural network
(ANN) is a network of a group of small processing
units modeled based on a human neural network.
ANN is an adaptive system that can change its
structure to solve problems based on the information
flowing in the network. One part that needs to be
considered in using ANN is the selection of training
methods and ANN architecture. An ANN architecture
that is too small will result in poor problem modeling,
while an ANN that is too large will cause over-fitting
and long computation time (Wijaya R Hariono B
Saputra T W and Rukmi D L, 2020).
3 SYSTEM DESIGN
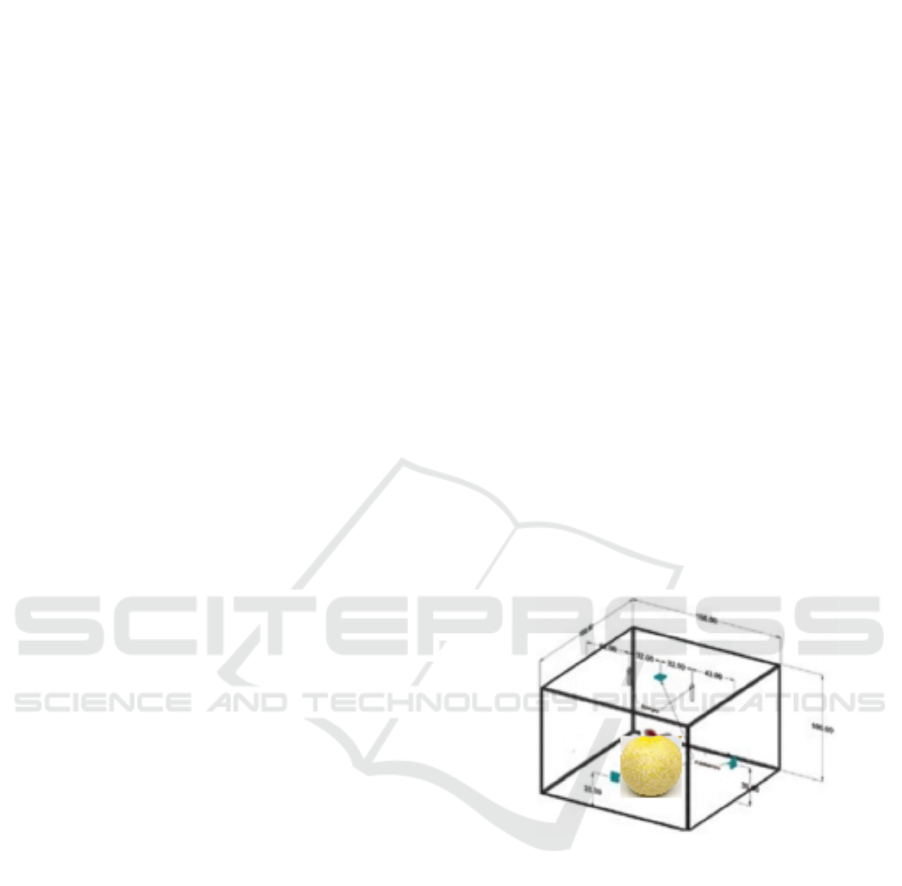
The Sorting Equipment was measured w x l x h =
100cm x 60cm x 100 cm and is made of an aluminum
frame and covered by a red polycarbonate board.
Inside the sorting box, two cameras are pointing at a
melon cup. The melon cup consists of a circular board
connected to a servo motor so that it can rotate the
melon position. It aims to obtain several shooting
angles for the test data. 3 LED lights lead to the melon
container at an angle of 45 degrees with a distance of
+-60 cm. The lamp power supply uses a variable
power supply to regulate the light intensity in the
sorting box. This aims to get the right light for
shooting in an enclosed space. Figure 1 is a sorting
box design.
Figure 1: Sortir system design.
Taking pictures using 2 Logitech C922 cameras
with HD 1080P video specifications at 30Fps/720P at
60FPS. 1 camera to take side view pictures, and
another to take top view pictures. An ATMega328
microcontroller is also connected serially to the
computer to adjust the servo working angle on the
melon dish. The computer for image processing has
1GB of Intel Core i5 graphics specifications and 8GB
of RAM. Figure 2 is a system block diagram of the
sorting system used on this paper.
iCAST-ES 2022 - International Conference on Applied Science and Technology on Engineering Science
296

Figure 2: Block Diagram System.
The captured image has a resolution of 640x480.
Image processing for diameter estimation consists of
several stages. The first is capturing & saving images.
After that, the image will be cropped according to the
melon position in the image. The cropped image is
converted to an HSV image. HSV(Hue, Saturation,
Value) is a component that represents the color of
visible light wavelengths (red, orange, yellow, green,
blue, purple). The advantage of HVS is that it consists
of the same colors that are captured by the human
senses. In comparison, the colors formed by other
models such as RGB result from a mixture of primary
colors. The RGB to HSV conversion process uses
equation 1 (Abdulrahman A A Rasheed M and Shihab
S, 2021) (Suryaningsih W Bakri A Kautsar S Hariono
B Brilliantina A and Wijaya R, 2022).
(1)
Gradient separation is performed based on the
min-max HSV value. It aims to obtain the threshold
value for color cropping. After the HSV limit is
determined, the appropriate pixel classification is
carried out to display the circle shape as an estimate
of the diameter in the main image. Figure 3 is a
programming flowchart in this study. The
programming language used is python with additional
OpenCV features for image processing
(Abdulrahman A A Rasheed M and Shihab S, 2021).
Figure 3: Flow Chart Melon Sortation.
4 RESULT AND DISCUSSION
4.1 Hardware Realization
Figure 4 is the result of making a sorting box used to
identify melons. The choice of red color aims to
obtain a contrasting background with the color of the
melon dominated by green to facilitate image
processing. In the early stages of testing the servo
performance based on the input value from the PC.
An image data retrieval program was created based
on angles of 0
o
, 30
o
, 60
o
, 90
o
, 120
o
, 150
o
, and 180
o
simultaneously. Figure 5 shows the image's data
based on the different servo angles. Based on Figure
5, the servo can work according to the given value.
Figure 4: Machine Hardware.
Figure 5: Capture test result.
Melon Diameter Estimation for Sorting System Based on Image Processing
297
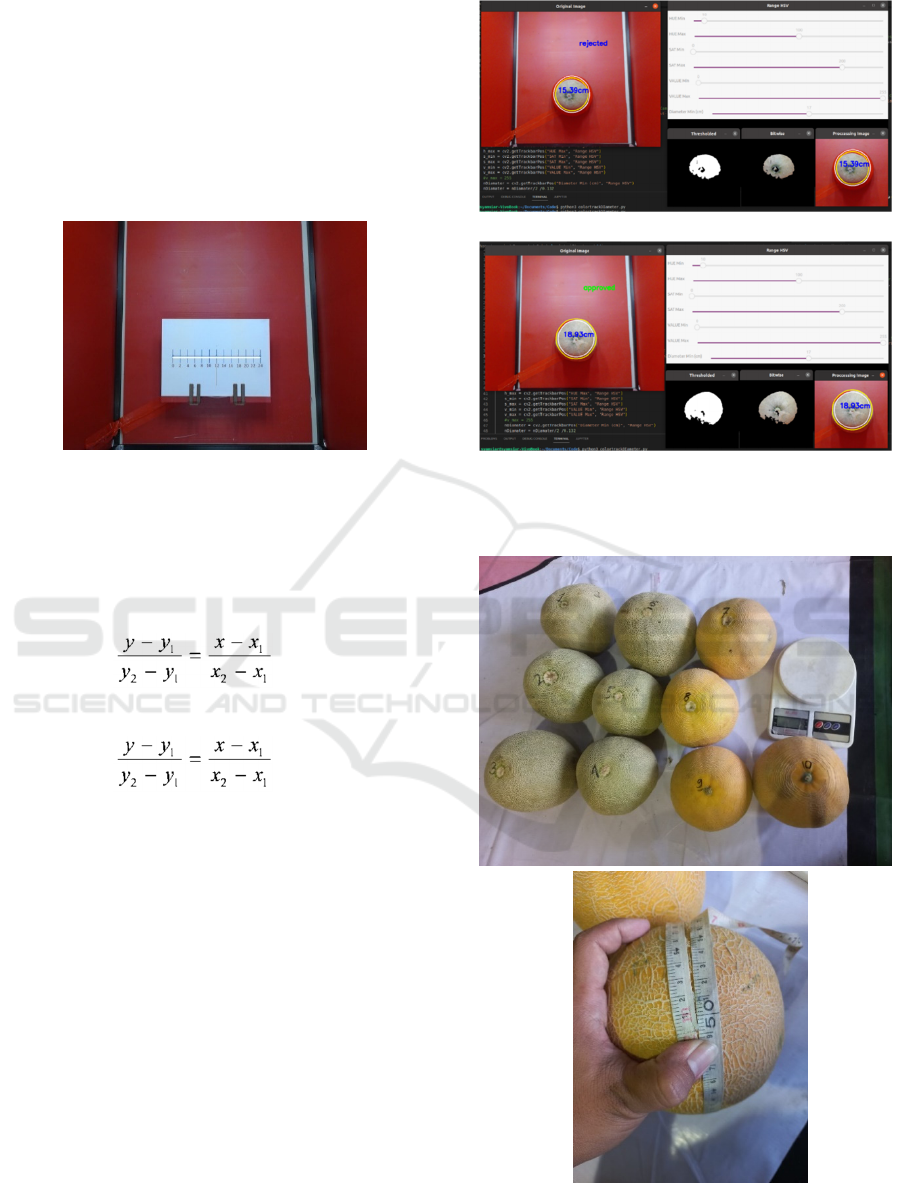
4.2 Calibration
Image calibration is performed. It aims to compare
the pixel size to the actual distance. Calibration of the
image using a board equipped with a line 24 cm long.
The board is placed in the center of the melon cup.
Capture images on each camera and then the
calibration process is carried out. Figure 6 is an image
during the calibration process.
Figure 6: Calibration process.
Based on the obtained pixel value, on the top
camera, 24 cm in actual distance is represented by
182 pixels. Using the linear equation according to
equation 2, we get an equation to calculate the actual
distance to the camera as in equation 3.
(2)
𝑑𝑖𝑎𝑚𝑎𝑡𝑒𝑟 0,132 ∗ 2 ∗ 𝑟𝑎𝑑𝑖𝑢𝑠
(3)
The last stage is creating an if then rule for
determining the diameter of the melon. If the diameter
estimate is less than the threshold, the rejected status
will appear on the screen. Figure 7 is the result of
melon image processing to determine the size of the
melon diameter according to the sorting limit (use the
diameter limit of 17cm). 10 melons were used for
testing (figure 8) with accurate sizes as shown in table
1. Based on the test results, the system can work
according to the settings made in the shortener
application. However, there is a difference in the
diameter estimation through image processing and
direct measurement using a ruler. This is due to the
fruit contour not being fully moon, while image
processing takes the diameter from the outermost
radius point of the melon. However, for the sorting
process, the user can set the minimum diameter size
through the application so that the sorting process can
be done flexibly.
a)
b)
Figure 7: a) melon with diameter <17cm, b) melon with
diameter >=17cm.
Figure 8: Melon for testing.
iCAST-ES 2022 - International Conference on Applied Science and Technology on Engineering Science
298

Table 1: Diameter Estimation Data.
Data Circumfer
ence (cm)
d = Cir / pi
(cm)
Estimation
Diameter (by
p
icture - cm)
Deviation
(cm)
1 53 16,88 17,96 -1,08
2 52 16,56 17,8 -1,24
3 50 15,92 17,76 -1,84
4 48 15,29 15,6 -0,31
5 45 14,33 15,39 -1,06
6 55 17,52 18,93 -1,41
7 50 15,92 17,88 -1,96
8 48 15,29 17,01 -1,72
9 47 14,97 16,09 -1,12
10 49 15,61 17,11 -1,50
average -1,32
5 CONCLUSIONS
Based on the research, the results of the estimated
diameter after testing have a deviation of 1.32 cm.
The algorithm can detect fruit with gradations of
green to yellow (depending on the level of fruit
maturity). However, the error in the estimation of
diameter measurement is even more significant if the
contour of the melon is not ideally round. In future
research, additional algorithms are needed to process
uneven contours.
ACKNOWLEDGEMENTS
The authors would like to acknowledge the financial
support of this work by grants from PNBP, State
Polytechnic of Jember. The author also thanked the
P3M and Information Technology Department, State
Polytechnic of Jember, which has supported and
assisted in completing this research.
REFERENCES
Kim K Kim K Kim H and Lee K, 2006 Risk Assessment
and Symptoms of Musculoskeletal Disorders in Melon
Farm Workers 4, 4 p. 385–397.
Tournier J et al., 2019 for medical image processing and
visualisation MRtrix3 : A fast , flexible and open
software framework.
Droby S and Wisniewski M, 2018 Postharvest Biology and
Technology The fruit microbiome : A new frontier for
postharvest biocontrol and postharvest biology
Postharvest Biol. Technol. 140, March p. 107–112.
Dewi T Risma P and Oktarina Y, 2020 Fruit sorting robot
based on color and size for an agricultural product
packaging system 9, 4 p. 1438–1445.
Kurnianto M Wibowo M Hariono B Wijaya R and
Brilliantina A, The Analysis of Consumer Perception
on Quality of Soybean Milk Used Importance
Performance Analysis Method The Analysis of
Consumer Perception on Quality of Soybean Milk Used
Importance Performance Analysis Method p. 0–7.
Chen H et al., Pre-Trained Image Processing Transformer
p. 12299–12310.
Wijaya R Hariono B Saputra T W and Rukmi D L, 2020
Development of plant monitoring systems based on
multi-camera image processing techniques on
hydroponic system IOP Conf. Ser. Earth Environ. Sci.
411, 1.
Abdulrahman A A Rasheed M and Shihab S, 2021 The
Analytic of Image Processing Smoothing Spaces Using
Wavelet The Analytic of Image Processing Smoothing
Spaces Using Wavelet.
Suryaningsih W Bakri A Kautsar S Hariono B Brilliantina
A and Wijaya R, 2022 Prototype of Integrated Mini
Exhausting System for Fish Canning Process IOP Conf.
Ser. Earth Environ. Sci. 980, 1.
Z E Fitri A Baskara A Madjid A M N Imron, 2022
Comparison of Classification for Grading Red Dragon
Fruit JURNAL NASIONAL TEKNIK ELEKTRO 11, 1 p.
43-49, doi:10.25077/jnte.v11n1.899.2022
R Y Adhitya A Khumaidi S T Sarena S Kautsar B
Widiawan and F L Afriansyah, 2020 Applied Haar
Cascade and Convolution Neural Network for
Detecting Defects in The PCB Pathway International
Conference on Computer Engineering, Network, and
Intelligent Multimedia (CENIM), p. 408-411, doi:
10.1109/CENIM51130.2020.9297996.
Melon Diameter Estimation for Sorting System Based on Image Processing
299
