
Visual Analysis of NBA Player Data
Jiazhi Di, Ben Wang
*
, Hua Hu, Qihang Zhao and Yinggui Wang
School of Information Science and Engineering, Hangzhou Normal University, Hangzhou, Zhejiang, 311121, China
hh@hznu.edu.cn, zqh@stu.hznu.edu.cn, 2276598112@qq.com
Keywords: Visual Analytics, Professional Basketball Leagues, Sports Data, Efficiency Criteria, Radar Chart Analysis.
Abstract: Competitive sports data visualization and analysis is an important technology in sports science research.
Taking the players of the National Basketball Association (NBA) as the research object, this paper focuses on
how to visually design the comprehensive ability of a single player and multiple players. This article uses the
efficiency criterion to analyze whether a player is efficient in a period of time, so as to judge whether the
player is the best. This paper figures out the comprehensive ability of NBA players by data table, line chart,
bar chart, and radar chart, and finds out the weakness of players from the visualization chart. Furthermore,
different aspects of James and Durant are visually analyzed in detail, such as rebounds, assists, shooting rate
and distribution.
1 INTRODUCTION
As an important direction of sports discipline
research, competitive sports data analysis research is
directly related to the development of competitive
sports and the improvement of the sport discipline
system. As one of the most popular competitive
sports, basketball, especially NBA, has a great
influence in the world. All kinds of data analysis
related to NBA aims to fully excavate valuable
content from the huge, complex, chaotic and
disorderly game data information. It assists the coach
and the team to make reasonable judgments for the
team to win. With the continuous accumulation of
game data, how to improve the team’s team analysis
and decision-making ability, and transfer a large
amount of game data into rich knowledge, so as to
help the team make the most effective decision has
become the most worthy research issues in this field.
In various visual analysis of NBA, R.Maheswaran
and other scholars deconstructed the process of
rebounding (Robertson, Card, Mackinlay 1989), and
Rangel defines a method to characterize basketball
players as versatile or expert based on 13 game-
related statistics (Rangel, Ugrinowitsch & Lamas
2019). At same time, P.Maymin explained the
player’s acceleration process (Maymin 2013), and
Maheswaran utilize a heat map to represent the
proportion of offensive rebounds distributed in the
basket area, colour coded of the percentage of
offensive rebounds (Maheswaran, Chang, Henehan
2015). Meanwhile, Bashuk proposed a method to
predict the performance of the game (Bashuk 2012),
and Lorenzo classifies players' performance in the
NBA based on their anthropometric attributes and
game experience (Zhang, Lorenzo, Gómez, Mateus,
Gonçalves, Sampaio 2018).
2 EVENT STREAM DATA
VISUALIZATION
The NBA stadium data analysis method based on the
event stream decomposes the NBA game into an
ordered collection of different events, which is the
NBA event stream. Events are divided into single
player events and multi player events, that are
arranged in order according to the game time.
Through the official event data of NBA, it is found
that the data records are in chronological order. A
corresponding event at each time point is called point
event. There are 16 types of point events in Table 1.
To better describe the nature of time, each event has
its own attributes.
The point attributes include:
• Type of event: The name of the point event.
Time: The time when the point event occurred;.
Di, J., Wang, B., Hu, H., Zhao, Q. and Wang, Y.
Visual Analysis of NBA Player Data.
DOI: 10.5220/0011768800003607
In Proceedings of the 1st International Conference on Public Management, Digital Economy and Internet Technology (ICPDI 2022), pages 835-840
ISBN: 978-989-758-620-0
Copyright
c
2023 by SCITEPRESS – Science and Technology Publications, Lda. Under CC license (CC BY-NC-ND 4.0)
835
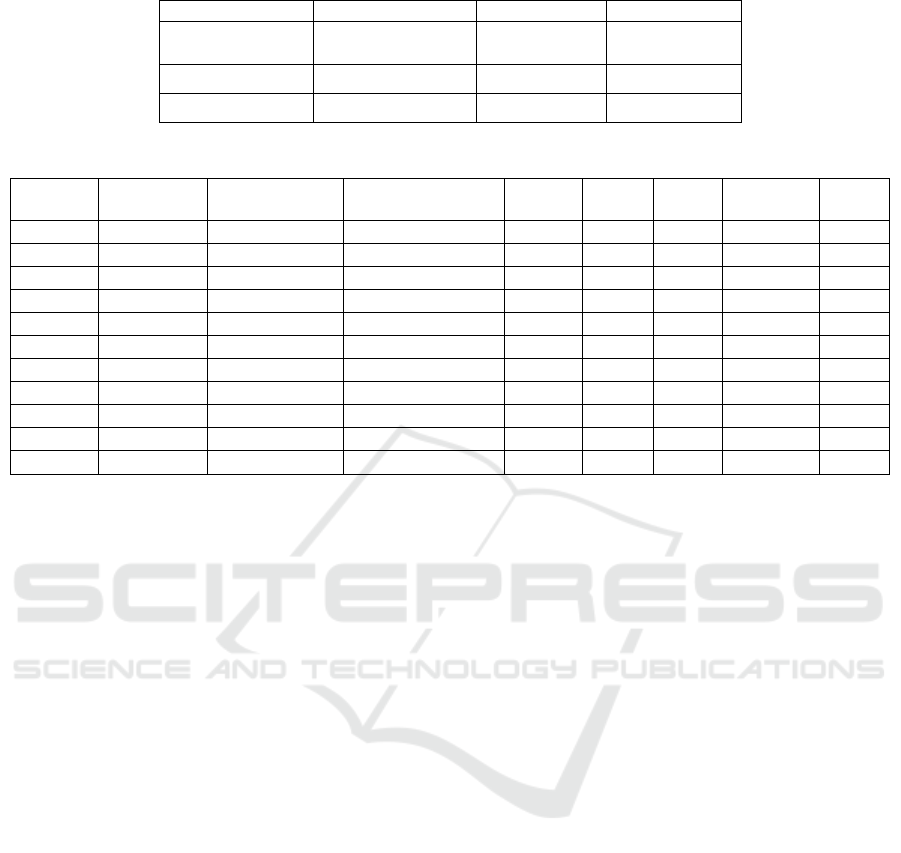
Table 1: POINT event types.
Start of the
g
ame Mistake Sus
p
en
d
Backboar
d
Two-point shot Two-point missed Three-point shot
The three-point
misse
d
Offensive fouls Personal fouls Technical fouls Shooting fouls
Free throw Free throw missed Sent off Timeout
Table 2: Part of The Data About Player James
season
shooting
p
ercenta
g
e
three-point field
g
oal
p
ercenta
g
e
free throw shooting
p
ercenta
g
e
rebound assist steal turnover score
2005 48% 33% 74% 8. 1 5. 8 1. 38 5. 00 30. 8
2006 42% 28% 76% 8. 1 8. 0 1. 70 3. 30 25. 1
2007 41% 26% 73% 7. 8 7. 6 1. 77 4. 15 28. 2
2008 51% 33% 75% 9. 1 7. 3 1. 64 2. 71 35. 3
2009 50% 40% 73% 9. 3 7. 6 1. 73 3. 82 29. 1
2010 47% 35% 76% 8. 4 5. 9 1. 67 3. 14 23. 7
2011 50% 26% 74% 9. 7 5. 6 1. 87 3. 52 30. 3
2012 49% 38% 78% 8. 4 6. 6 1. 78 3. 04 25. 9
2013 57% 41% 81% 7. 0 4. 8 1. 80 3. 05 27. 4
2014 42% 23% 73% 11. 3 8. 4 1. 65 4. 10 30. 1
2015 53% 34% 66% 9. 5 7. 6 2. 33 3. 57 26. 3
• Coordinates: The coordinate point at which
the event occurred. For example, player shot
charts;Normally, the stadium is a coordinate
map.
• Players: Players in point events.
• Description: A detailed description of the
point event.
The stream event attributes include:
• Type of event: Possession of the ball.
• Start time: The time when the flow event
occurred.
End time: The time when the stream event ends
3 NBA PLAYER DATA ANALYSIS
3.1 Data Acquisition
There are many websites recording sports data at
home and abroad. For instance, the Espn.com website
records the detailed data of NBA games. In addition,
Basketball-Reference.com, China.NBA.com official
website, Hupu.com websites have rich records of
relevant game data. Therefore, most of the
competition data can be obtained on the public
website, and the data in the web page can be stored
locally through a simple tool. In this paper, the
Python based HTML parsing tool with lxml library
and XPath has been implemented to grab the relevant
data from the Hupu.com website and store it locally.
3.2 Data Analysis
3.2.1 Single Player Analysis
Single-player analysis is designed to analyze a
player's performance and trends over a period of time.
It analyzes whether a player has been effective on the
court over a period of time, or whether he can help
the team score on offense and reduce the opponent's
score on defense. Certain player characteristics, such
as points, turnovers, blocked shots, assists, and
rebounds, will be focused in the experiments. The
player’s characteristics fall into two main categories:
offensive characteristics (point, turnover, assist) and
defensive characteristics (steal, block).
In time period analysis, specific characteristics
can be selected to analyze a player's performance
during that time period. In addition, the player's
efficiency rule can be used to describe its
performance in this period, and it can be displayed in
the player performance view. Efficiency rule include
points, rebounds, assists, steals, blocks, shots, field
goals, free throws, free throws made, turnovers, and
the number of games a player finished. The efficiency
rule is defined below:
efficiency rule=[(points + rebounds + assists + steals
+ blocks) - (shots-field goals)
- (free throws-free throws made) - turnovers] / time
As shown in Table 3, James from the Lakers team
is selected and the efficiency rule technical indicator.
ICPDI 2022 - International Conference on Public Management, Digital Economy and Internet Technology
836
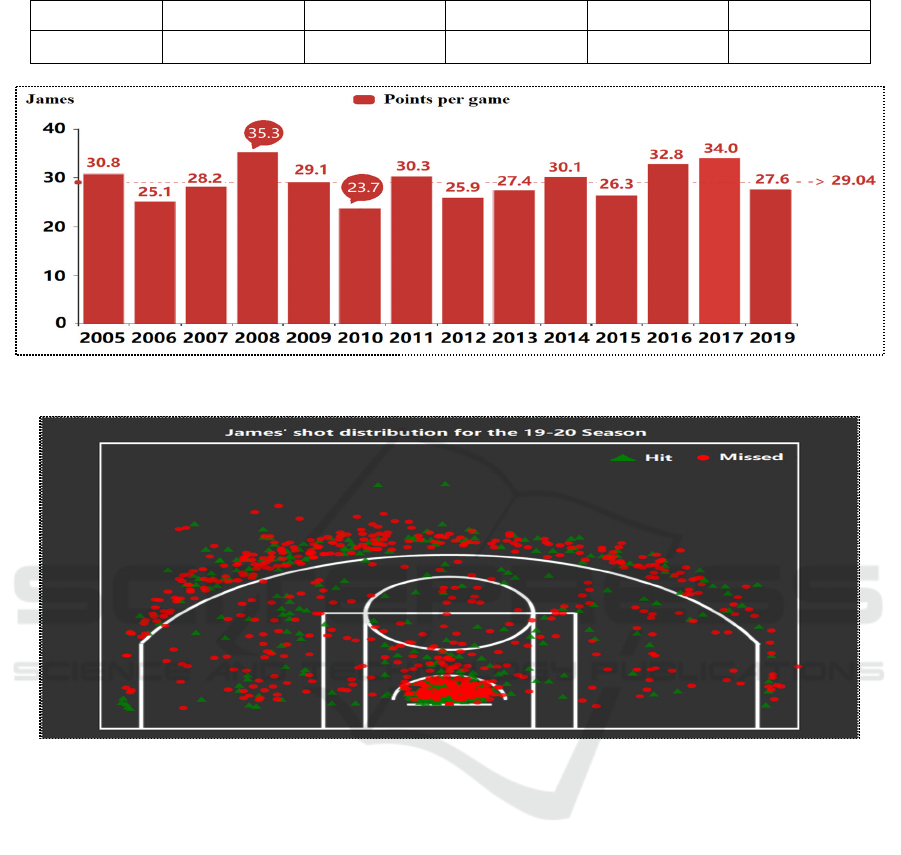
Table 3: James's efficiency rule trend.
time 2021-03-17 2021-03-19 2021-03-21 2021-05-01 2021-05-03
efficiency rule 1.081 1.290 1 0.656 0.714
Figure 1: James's scoring trend.
Figure 2: James' shot distribution for the 19-20 season.
(ERTI) is selected. The line chart shows his
efficiency rule chart for the last five games in 2021.
According to the chart, James' efficiency rule
fluctuated in the five major games between March
and May. At that period, the Lakers have five new
players in the rotation this season, and the playoffs are
the shortest in history, leaving little time for players
to fit in and rest. Figure 1 shows James' average points
per game in the playoffs each year. From the official
website, the NBA league average is 10.4 points per
game. As shown in the chart, James' playoff scoring
per game per year is much higher than the league
average. In 2008, he scored his best points per game,
35.3 points. Other years fluctuated around 29.04
points. and the range of fluctuating tends to be stable,
which shows James has a high scoring ability
Figure 2 shows the distribution of James' shooting
statistics for the 19-20 season. James' shooting
percentage of 49.8% for the 2019-2020 season
remains normal. Also shooting 34.9% from 3-point
range is normal. The chart shows that James is hitting
more shots from long range than from mid range, and
confirms that scoring further and further away from
the basket is the way James is scoring now.
3.2.2 Multi-player Analysis
Basketball is a team sport, which requires
consideration of the collective performance of
multiple players. At the same time, coaches and NBA
analysts can select multiple players and skills to
compare different players for visual analysis. The
segmentation and selection of event segment in single
player analysis is further extended in multi-player
visual comparative analysis. Furthermore, coaches
and analysts can select a time period of interest to
Visual Analysis of NBA Player Data
837
Figure 3: James hitting vs Durant hitting.
look at individual versus multiple skill
comparisons, and see how different players
performed in a particular skill during that time period.
Figures 3 shows a comparison between James and
Durant in three aspects: shooting percentage, three-
point field goal percentage, and free throw shooting
percentage. As James was in the league four seasons
before Durant, he was a first-round pick in 2003, and
Durant was a top pick in 2007. So in terms of time,
for a better comparison we have chosen the years
2009-2017 when James and Durant shared stats. In
terms of free throws, Durant's shooting percentage in
the eight years has basically stabilized at more than
80%, but James' free throws may not be his strong
point. Especially in 2016, James only got 66%. in
terms of shooting. At the same time, Durant is on a
steady upward trend, with the highest shooting
percentage of 55.6% in 2016.
Rebounding refers to the ball that rebounds from
the backboard or hoop after a miss. In fact,
rebounding is a more complicated technique, which
is composed of positions, take-offs, air grabs and
actions after the ball is obtained. Rebounding is an
important part of offensive and defensive tactics in
basketball games. Figure 4 is a histogram of the
changes in rebounds between James and Durant from
2009 to 2018. The figure shows clearly that James is
much better than Durant in rebounding. James has a
stable average rebounding score of 9.09 in the past
nine years, while Durant has only 7.66. Normally,
rebounding is an important way to control the ball and
it has a direct impact on the outcome of the game.
James can get more rebounds means that his team can
get more ball rights, so that the team has a greater
winning percentage.
Figure 5 shows the data of time, games, scoring,
fouls, turnovers, blocks, steals, assists, rebounds, free
throw percentage, three-point shooting percentage,
and field goal percentage since James and Durant
played in the NBA. Figure 5 is a radar chart drawn by
radar analysis method, which is an effective method
for systematic analysis of business operations. This
method analyzes the company's operating results
from five aspects: its operating profitability, safety,
liquidity, productivity, and growth. The relevant data
of these five aspects are expressed by ratios and filled
in an equal scale graph which can show the
relationship of their ratios. After connecting the nodes
of their ratios with colored pens, it is like a radar chart.
From the figure, we can see the whole picture of the
player’s skills, directly find out his weak links, and
lay the foundation for the next step of improvement
(Zhang, Jia 1990). Through the comparison, Durant's
weak links are mainly assists, steals and rebounds,
and James’s weak links are free throw shooting
percentage, cap, and foul.
Actually, James' defense is very strong. So far in
his career, James has been selected to the all-
defensive team for 5 times. However, Durant has a
very physical advantage. He has the height and
wingspan of a center and the speed of a defender.
Offensive players have thought that it is not a simple
matter to break through Durant. Generally speaking,
Durant is relatively thin and a bit worse in defense. In
terms of leadership ability, James is better than
Durant. James is able to connect the entire team, and
the team are arranged around him. Durant's ability to
lead the team is relatively insufficient. In Thunder
team, he was talented but failed to win the
championship. Durant's job in the Warriors was just
scoring, not to lead the team.
ICPDI 2022 - International Conference on Public Management, Digital Economy and Internet Technology
838

Figure 4: James rebound vs Durant rebound.
Figure 5: Comprehensive comparison.
4 CONCLUSIONS
Competitive sports data analysis is an important part
of sports research. In this paper, NBA data
visualization uses figures to represent abstract
competitive data. The application of visual effects
helps people to enhance the cognition and
understanding of abstract information. With the
development of visualization technology, the visual
system will be more effective and efficient. The
visualization system for professional analysts can not
only realize the real-time reproduction of the game
process, but also automatically analyze and present
the time period of interest to professional users. The
analysis of single player, multiple players and the
cooperation among players can find the strengths and
weaknesses of players. In addition, the system not
only helps to analyze the opponent's strategy, but also
can predict the internal instability of the team. Visual
analysis system will become an indispensable tool in
the field of professional sports.
ACKNOWLEDGMENTS
This paper was funded by projects: Zhejiang Province
(lgf19f020011, Y202044936); Hangzhou
(20191203b14). And it utilized the research platform
and data in our teams (Chen, Wang, Wang, Wang
2021, Wang, Wang. Huang 2020).
Visual Analysis of NBA Player Data
839

REFERENCES
Bashuk, M. (2012). Using cumulative win probabilities to
predict NCAA basketball performance. In: Proceedings
of the MIT Sloan Sports Analytics Conference. Boston.
pp. 1-10.
Chen, L.Q., Wang, B., Wang, Y.G., Wang, X.Y. (2021).
Exploratory Data Analysis on the Usage of COVID-19
Vaccine. In: Proceedings of the 6th ISCIPT Symposium
on Computer and Information Processing Technology.
Changsha. pp. 101-105.
Maymin, P. (2013). Acceleration in the NBA: Towards an
algorithmic taxonomy of basketball plays. In: MIT
Sloan Sports Analytics Conference. Boston.
Maheswaran R, Chang, Y.H., Henehan, A. (2015)
Deconstructing the rebound with optical tracking data.
In: MIT Sloan Sports Analytics Conference. Boston.
Robertson, G., Card, S.K., Mackinlay, J. D. (1989). The
cognitive coprocessor architecture for interactive user
interfaces. In: Proceedings of the 2nd annual ACM
SIGGRAPH symposium on User interface software
and technology. Boston. pp. 10-18.
Rangel, W., Ugrinowitsch, C., & Lamas, L. (2019).
Basketball players' versatility: Assessing the diversity
of tactical roles. International Journal of Sports Science
& Coaching. 14(4): 552-561.
Wang Y.G., Wang. B., Huang, Y.X. (2020). Comprehensive
analysis and mining big data of smart ecommerce user
behavior. Journal of Physics, 1616(1):1-7.
Zhang, S., Lorenzo, A., Gómez, M.A., Mateus, N.,
Gonçalves, B., Sampaio, J. (2018). Clustering
performances in the NBA according to players’
anthropometric attributes and playing
experience. Journal of sports sciences. 36(22): 2511-
2520.
Zhang, H.J., Jia, C.M. (1990) The Chinese Dictionary of
Auditing. LiaoNing People's Publishing House, The
ShenYang.
ICPDI 2022 - International Conference on Public Management, Digital Economy and Internet Technology
840
