
Monitoring System of Biogas Production Volume and Digester
Pressure Control
Shalma N. Hida, Sephian Prabowo, Mukhammad Kirom and Asep Suhendi
Telkom University, Indonesia
mramdlankirom@telkomuniversity.ac.id, suhendi@telkomuniversity.ac.id
Keywords: Biogas, Biogas-Volume, Digester, IoT, Pressure-Control.
Abstract: In this paper, an IoT-based biogas production volume monitoring system and digester pressure control have
been developed. This system uses a fixed dome type digester with a semi-continuous filling method. A
mixture of stale rice and water in a ratio of 1:2 was used as a substrate with a refill time of every 2 days. The
pressure and volume of gas in the digester are measured using a pressure sensor and a flow sensor. In order
to produce optimal gas volume, the pressure in the digester is controlled using the on-off method. The biogas
pressure and volume data are displayed on the LCD screen and then sent to the IoT platform so that it can be
monitored remotely via a smart phone. Pressure in the digester can be maintained between 0.326 psi to 0.652
psi. The system that has been designed can produce an average gas volume of 10.37 liters. Data transmission
to the platform is carried out with an interval of 10 minutes with a delay in the travel time of sending data for
one transmission of 8 seconds.
1 INTRODUCTION
Biogas is one of the alternative energies that can be
used to help save petroleum energy use, because
biogas processing comes from organic matter that
does not take long to become available. Biogas is a gas
produced from the process of decomposition of
organic materials by the activity of microorganisms in
the absence of oxygen or anaerobic condition
(M. C. T.
Atmodjo, 2018)
Biogas formation process must take
place in a place that is free of oxygen, called a digester.
The shape and size of the digester can vary, according
to the needs and available materials to make the
digester (
E. Randjawali and A. Waris, 2016). In general,
biogas consists of methane (50-75%), carbon dioxide
(25-50%), as well as small amounts of other gases
such as nitrogen (0-10%), hydrogen (0-1%), hydrogen
sulfide (0-3%), and oxygen (0-2%) (S. Ford, 2007).
This gas mixture will be used as fuel.
The biogas production process involves four
successive biological processes: hydrolysis,
acidogenesis, acetogenesis and methanogenesis. If
one of these processes is negatively affected in any
way, it can affect the other process and the biogas
production process can become unstable. Process
monitoring can help to understand what's going on in
biogas installations and help keep the process stable.
The possible disadvantage is that if the biogas system
is completely damaged, it may have to be emptied and
replenished with a new substrate. This leads to time
and financial losses (B. Drosg, 2013).
Some related studies that researched to sanitize the
influence of pressure control on biogas production.
The conclusion obtained that the production of gas
produced with the largest amount is at a pressure range
of 60% of the maximum pressure (F. R. Silmi et al.,
2017). However, monitoring the parameters cannot be
remotely, it can only be seen onsite on the LCD with
volume measurements using no electronic
instruments. Another study researched to incubation
system to enhance biogas and methane production.
The conclusion obtained that the filling time of the
substrate is for two days(
F. Liberi et al., 2019).
In an on-off control system, the control signal has
only two specific positions, namely on and off or 1 and
0. On-off controllers are relatively simple and
inexpensive, they are widely used in industrial and
domestic systems (Y. Kanda, 1991). In this case, the
actuator can produce a variable value or controlled
magnitude in a state of full power or no power at all.
This research utilizes data from previous research
and is integrated into a biogas volume monitoring and
pressure control system produced on the digester by
Hida, S., Prabowo, S., Kirom, M. and Suhendi, A.
Monitoring System of Biogas Production Volume and Digester Pressure Control.
DOI: 10.5220/0011816500003575
In Proceedings of the 5th International Conference on Applied Science and Technology on Engineering Science (iCAST-ES 2022), pages 493-498
ISBN: 978-989-758-619-4; ISSN: 2975-8246
Copyright © 2023 by SCITEPRESS – Science and Technology Publications, Lda. Under CC license (CC BY-NC-ND 4.0)
493

utilizing the IoT concept as the monitoring process.
Measurement results by flow sensors and pressure
sensors will be processed and then displayed on the
LCD and delivered to the IoT platform so that gas
production can be monitored through platforms or
applications that have been connected to the system.
The pressure control process uses the solenoid valve
as an actuator with a specified pressure value range.
2 METHODOLOGY AND
SYSTEM DESIGN
2.1 System Design
The system consists of three main components,
namely digesters, panel boxes, and gas storage
containers. Digesters are used in the form of
containers with fixed dome and semicontinuous
feeding types. This digester is equipped with an open-
close valve that is above and on the bottom side, this
valve is used for the entry and output of the substrate.
The panel box serves as a placement container of
various system components. The biogas produced in
the digester will be flowed to the panel box and
measured in volume and pressure, as well as pressure
control commands sourced from this panel box. After
that, the biogas that has been measured will be flowed
and stored in plastic containers.
Figure 1: System Design.
2.2 Device Design
The hardware used to build biogas digesters includes
a ±5 liters gallon with a tap that has been installed, a
¾ inch pipe, two ball valves. The installed pipe serves
as the entrance of the substrate during the feeding
process, while the two taps attached to the pipe are
intended to hold the biogas formed in the digester so
that it is not wasted into the air when the feeding
process is carried out. The faucet that has been
installed in the lower area of the gallon is the place
where the substrate outputs.
Figure 2: Biogas Digester Design.
Electronic hardware stored in the panel box
includes arduino uno+wifi R3, LCD, RTC, SD card
module, relay, and sensor flow. While there is a
pressure sensor and a solenoid valve that is installed
outside the panel box because of its use that is closer
to the biogas digester. For online monitoring, data
processed in the microcontroller is sent to the
ESP8266 chip via serial communication. This
ESP8266 chip will read the data and then send the
data to the IoT platform, Antares. The platform is
integrated with android-based applications, so remote
monitoring can be done on the Antares platform as
well as android applications.
The program on Arduino IDE begins with the
initialization of pins connected to various
components and variables that will be processed later.
After that it is continued with the value reading for
the flow sensor and pressure sensor. For volume
readings, the accumulation of readable volumes is
carried out, while for pressure readings, accumulation
is not carried out. For volume accumulation data and
pressure values are displayed on the LCD in real time
as an onsite monitor. Data is sent to an SD card every
20 seconds as a temporary data store, and then sent to
the IoT platform every 10 minutes as an online
monitor.
Figure 3: Schematic Electronics System.
The readable pressure value is seen as a
movement parameter of the solenoid valve. Pressure
iCAST-ES 2022 - International Conference on Applied Science and Technology on Engineering Science
494
control with set point at pressure 0.652 psi and reset
point at pressure 0.326 psi, this value will be
discussed in the next chapter. When the readable
pressure is above 0.652 psi, the solenoid valve will
open, when the readable pressure is below 0.326 psi,
the solenoid valve will be closed. Meanwhile, if the
pressure value is read between the two points, then
the state of the solenoid valve depends on the
previous condition. If the previous condition is open,
it will remain open. And if the previous condition is
closed, it will remain closed.
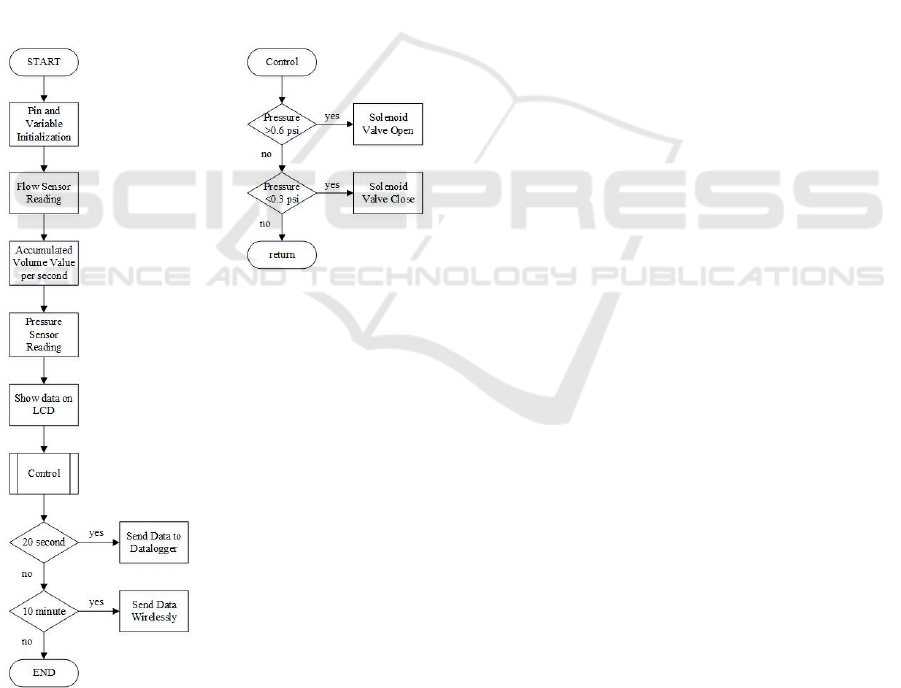
2.3 Software Design
The simple program flow of the system begins with
the readings of the volume and pressure values of
each sensor. Then the readings are distributed for
onsite monitoring on LCD, online monitoring on The
IoT platform, backup data storage on the SD card, and
determining the control of the solenoid valve.
Figure 4: Flowchart Program of Monitoring and
Controlling Biogas System.
As in Figure 4, the program begins with the
initialization of pins connected with various
components and variables that will be processed later.
After that, it is continued with the value readings for
the flow sensor and pressure sensor. For volume
readings, the accumulation of readable volumes is
carried out, while for pressure readings, accumulation
is not carried out. For accumulated volume data and
pressure values are displayed on the LCD in real time
as an onsite monitor. Data is sent to an SD card once
every 20 seconds as a temporary data store and sent
to the IoT platform once every 10 minutes as an
online monitor. The following image shows the
system software flowchart.
The readable pressure value is seen as a movement
parameter of the solenoid valve. Pressure control with
a set point at a pressure of 0.652 psi and a reset point
at a pressure of 0.326 psi, this value will be discussed
in the next chapter. When the read pressure is above
0.652 psi, the solenoid valve will open, when the read
pressure is below 0.326 psi, the solenoid valve will be
closed. Meanwhile, if the pressure value is read
between the two points, then the state of the solenoid
valve depends on the previous conditions. If the
previous condition was in an open state, it will remain
open. And if the previous condition was in a closed
state, it will remain closed.
3 RESULT AND DISCUSSION
The purpose of this study is to create a system that
can measure, monitor, and control parameters in the
biogas process with the help of IoT as its monitoring
system and solenoid valve as a control actuator.
3.1 Sensor Testing
Calibration is performed to get an equation of the
relationship between the voltage emitted by the
sensor and the actual value. The readable voltage
value in the microcontroller will be compared with
the readable gas flow discharge value in the MF-5721
flowmeter. Also, when calibrating the pressure, the
voltage read in the microcontroller will be compared
with the readable pressure value in the pressure gauge.
From the results of the comparison formed a graph
and equation that states the relationship between the
two. This equation will be included in the program in
the microcontroller to calculate the appropriate
physical magnitude.
Monitoring System of Biogas Production Volume and Digester Pressure Control
495
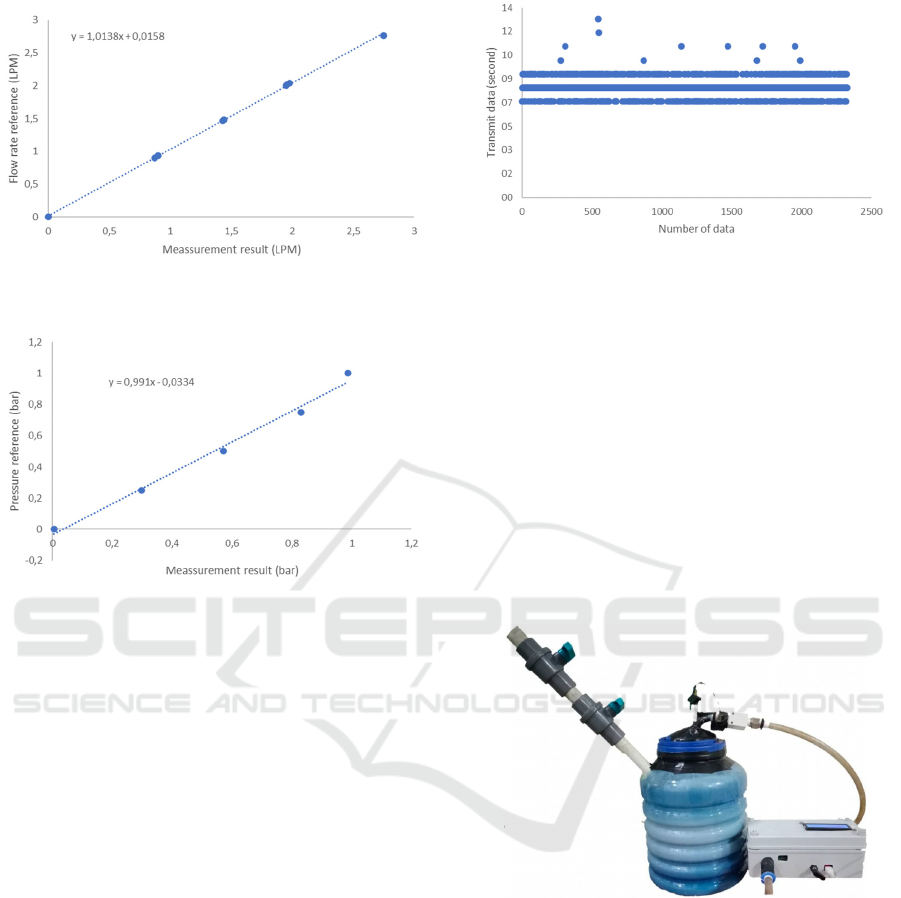
Figure 5: Relation Between Flow Measurement Value and
Reference Value as Flow Sensor Validating.
Figure 6: Relation Between Pressure Measurement Value
and Reference Value as Pressure Sensor Validating.
Testing is done in the same scheme as when
performing calibration. The difference is the
parameters that will be compared in the actual form
with those read on the microcontroller. A comparison
of the two for sensor flow test results can be seen in
Figure 5, while the comparison for the pressure sensor
can be seen in Figure 6.
From the data on Figure 5. can be calculated
average error value of the sensor to be used 2.768%.
From the data on Figure 6., this sensor has an average
error value of 11.342%.
3.2 Communication Module Testing
Communication module testing aims to see the
required data transmission time. The test was
conducted at the Telkom University Faculty of
Electrical Engineering Building room P117 on
Monday, November 22, 2021, at 12:47:35 to 17:59:27
WIB. Data is transmitted with an esp8266 chip that
has been integrated on a microcontroller board and
will be sent to the IoT platform, Antares. Data
transmission is programmed with an interval of one
second each data. Data delivery testing can be viewed
on Figure 7.
Figure 7: Relation Between Number of Data and Time
Transmit Data as Communication Module Testing.
On Figure 7. data that can be sent as much as 2328
data. From this data obtained the average travel time
of data transmission from device to IoT platform is
eight seconds.
3.3 Device Profile
Most components are included in the 80x180x70 mm
panel box to protect against environmental
disturbances thereby reducing the risk of interference
during the reading process. Some components are not
included in the panel box because of their function
and placement more with the digester.
Figure 8: Biogas Digester and Panel Box of Electronics
System.
Measurements are carried out on biogas digesters
with a continuous filling scheme carried out in
Tegalluar Village, Bojongsoang District, Bandung
Regency. The digester used is ±5 liters that are
equipped with a faucet. The gas produced in the
biogas digester is flowed to the sensor flow sensor to
read the flow value of the gas passing through the
sensor. Then the gas is flowed to a container in the
form of plastic measuring 50x120 cm with a thickness
of 0.8 micrometers as a biogas storage area.
iCAST-ES 2022 - International Conference on Applied Science and Technology on Engineering Science
496

Figure 9: Panel Box of Electronics System.
3.4 Measurement Result
Measurements were taken for 20 days from February
19, 2022, to March 10, 2022, with the initial seven
days used to determine the set point and reset point
that will be the pressure limit set on the digester. For
the first seven days there is no pressure control, with
the valve constantly closed. The pressure generated
during the first seven days can be seen in figure 10.
Figure 10: Average Pressure per Day as Deadband Value
Determination.
On Figure 10. The highest pressure for the first
seven days was 1,087. determination of the pressure
value left on the digester is 30% to 60% of the highest
pressure. Then obtained the reset point value at a
pressure of 0.3261 psi and a set point value at a
pressure of 0.6522 psi.
The control program is used after entering the set
point value and reset point that has been obtained. The
measurement process with control is carried out by
continuously replenishing the substrate for two days.
The pressure obtained until the 20th day can be seen
in Fig. 11.
Figure 11: Result of Pressure Control.
Viewed on Figure 11. When the pressure has
reached the set point value, the pressure will decrease
again. This is due to the condition of the solenoid
valve that changes. This pressure control system
produces an average error of 4.875%.
When the condition of the solenoid valve opens,
biogas will be released and passed through the flow
sensor and then measured the volume value. The
measured daily volume value of biogas can be seen in
figure 12.
Figure 12: Volume Biogas Obtained During Pressure
Control per Day.
Based on Figure 12, the volume of biogas
produced tends to increase. The accumulated value of
biogas volume produced during the control process is
as much as 10.37 liters.
3.5 Presentation of Information
Data information can be viewed or monitored directly
in real time on the LCD that has been installed panel
box such as figure 13. It can also be viewed or
monitored remotely on android-based mobile
applications or directly on the IoT platform used,
namely Antares as in Figure 14. The data displayed
online is updated every 10 minutes.
Monitoring System of Biogas Production Volume and Digester Pressure Control
497
Figure 13: Onsite Monitoring View on LCD.
Figure 14: Online Monitoring View on Android.
4 CONCLUSION
In this research, a system that can measure and
monitor the yield volume and biogas pressure has
been created in the digester. The experiment was
carried out using a digester measuring ±5 liters and
the substrate was a mixture of stale rice and water
with a ratio of 1: 2. Substrate filling was carried out
continuously every two days. The parameters
measured were volume and pressure with an average
error value of 2.768% and 11.342% for each sensor.
The volume of gas produced and the pressure in the
digester can be monitored on the LCD screen and on
the Android application and the Antares IoT platform
with data transmission times of 10 minutes. Pressure
control is carried out at the reset point and setpoint at
values of 0.326 and 0.652 psi, this pressure control
system produces an average error of 4.875%. The
total volume of gas produced for 20 days is 10.37
liters.
REFERENCES
M. C. T. Atmodjo, “The Biogas from Biomass Waste,”
International Journal of Scientific & Engineering
Research, vol. 9, pp. 706-711, 2018.
E. Randjawali and A. Waris, “Design and Testing of Mini-
size Biogas Plant,” Journal of Physics, 2016.
S. Ford, Advances in Biogas, Leatherhead: Pira
International Ltd, 2007.
B. Drosg, Process Monitoring in Biogas Plants, Austria:
IEA Bioenergy, 2013.
F. R. Silmi, M. R. Kirom and A. Qurthobi, “Analysis of the
Infuence of Internal Pressure Control to the Total Gas
Production in Anaerobic Digester,” EPIC, 2017.
F. Liberi, V. Pistolesi, et.all, “An Incubation System to
Enhance Biogas and Methane Production: A Case
Study of an Existing Biogas Plant in Umbria, Italy,”
Processes, 2019.
Y. Kanda, "Piezoresistance Effect of Silicon, Sensors and
Actuators," A Physical, vol. 28, pp. 83-91, 1991.
iCAST-ES 2022 - International Conference on Applied Science and Technology on Engineering Science
498
