
Analysis of Energy Needs in the Small and Medium Enterprise (SME)
Businesses Base on the Photovoltaic Cell
Harry Miswar, A Tossin Alamsyah and Asrizal Tatang
Electrical Engineering Master's Program Politeknik, Negeri Jakarta, Indonesia
Keywords: Analysis, Energy, SME, Photovoltaic Cell.
Abstract: World's business is rapidly growing, impacting the volume of energy usage that strongly related to money
budget. This study aims to carry out load analysis and PV planning towards low-energy buildings at PT PSI.
The methods used for this research are energy/load survey, documentation data and literature study. Primary
data related to 2020 Electricity Bill, is used to calculate the load requirement of the bending tool. The result
showed that the power requirement of the bending tool was 7.4 kwd or 59.888 kwm. Electrical energy savings
is IDR 891,048 monthly or IDR 10,692,576 annually within 47 PV units of 385 wp capacity.
1 INTRODUCTION
From year to year, energy consumption has increased
- mostly fossil energy - that followed by increasing
number of residents. The growth of MSME still relies
on electrical supply from PLN while fossil energy
prices are sky-rocketed, and is not balanced by the
usage of Renewable Energy. This cause a
disadvantage for MSME. Thus to cover that,
renewable clean energy resources are essential
(Ariodarma, 2016).
One of the widely used renewable energy is solar
energy, commonly applied for houses and buildings-
-a building that entirely supplied by solar energy is
called Zero Energy Building. For preparing and
mantaining the building in proper energy efficacy, it
is necessary to analyse the PV usage and the existing
load. (Effendi. A., 2016).
This study aims to design an proper use of PV and
to analyse load input to DC equipment resulted a
more efficient load usage.
2 MATERIALS AND METHODS
The methods used in this research are energy/load
survey, documentation data and literature study.
Based on complete data, a thorough analysis applied
in order to preview the efficacy level of PLTS on
bending tools at PT. (Gunawan W, 2018).
2.1 Analysis and Comprehension of
Electrical Energy Data
Table 1: Installed.
88.021 Average Electricity
Consumption
Average
Bills 2020
9
KVA kWh
3
09.204.843
Table 1 depicted: installed power of PT PSI set on 69
KVA with average electricity consumption of
188.021 kwh and monthly cost IDR 309,204,843--
the building categorized as B3 (business) for its quite
large installed power due to heavy equipments
operation e.g. cutting machine. Apart for its assembly
panels space, there are also spaces for non-formal
education activities, a study center for electrical
training. However, in specific moment like pandemic
times, some installed powers are used partly or in low
usage. (Garcia Martinez, 2018).
2.2 Existing Condition
Currently, 4 units PVs are installed, each of 380 wp
with total power output of 1,520 watt, operating by
grid system with inverter (no batteries). The inverter
used directly connected to incoming supply from
PLN, it can optimaly absorbs 7-8 watt of power. Due
to its usage during working hour, the inverter might
reserves up to 1,520 watt, but only 1,512 watt be
ready to utilized.
Miswar, H., Alamsyah, A. and Tatang, A.
Analysis of Energy Needs in the Small and Medium Enterprise (SME) Businesses Base on the Photovoltaic Cell.
DOI: 10.5220/0011816800003575
In Proceedings of the 5th International Conference on Applied Science and Technology on Engineering Science (iCAST-ES 2022), pages 507-511
ISBN: 978-989-758-619-4; ISSN: 2975-8246
Copyright © 2023 by SCITEPRESS – Science and Technology Publications, Lda. Under CC license (CC BY-NC-ND 4.0)
507
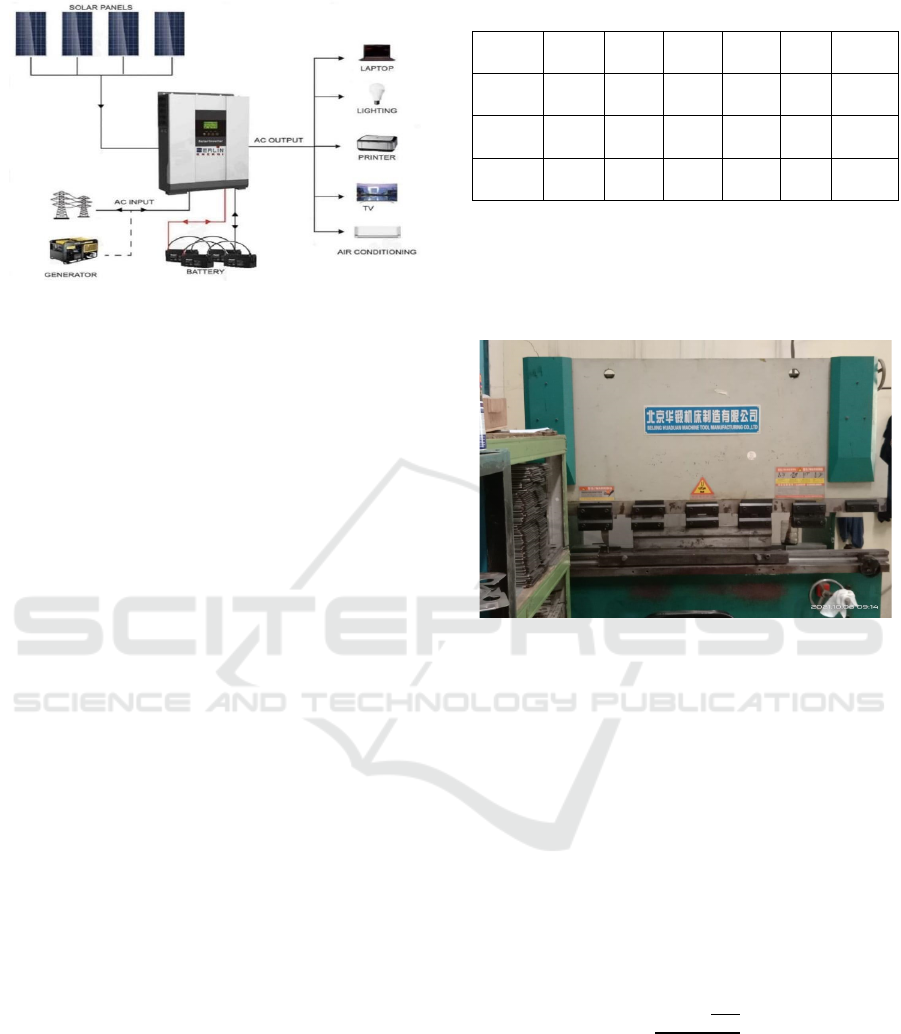
Figure 1: Existing PLTS.
2.3 Lighting-AC Power Requirements
Power consumption average for 4 lamps (in the
training room) is approx. 400 watt, so there is still a
plenty of energy reserved (1,112 watt). The 4 PVs are
installed only to support power for workshop
activities in training room. This is an evidence of how
a small power may efficiently generating power for a
room lighting. Further, the reserved 1,112 watt will
support energy for 1 unit air conditioner (1 pk)
utillized on training course every Saturday. The total
power load of entire activities is 1,060 watt, means
there is still 452 watt remaining that accumulated as
power surplus or power savings. Quite a cost-saving
for monthly bill.
2.4 AC Power Requirements
From the remaining power generated of 1,112 w, it is
also used for the needs of 1 room ac with a
specification of 1 pk. The use of this air conditioner
is only when training is carried out, generally it is
used on Saturdays every week. From the total
assumption that the power generated is 1,512 watts
with a total load of 1,060 watts of power usage, there
is a difference of 452 watts. The remaining power is
automatically accumulated by PLN as a power
surplus, meaning that there is a power saving of 452
watts, thus quite helpful in lowering monthly bills
even though it is not significantly large.
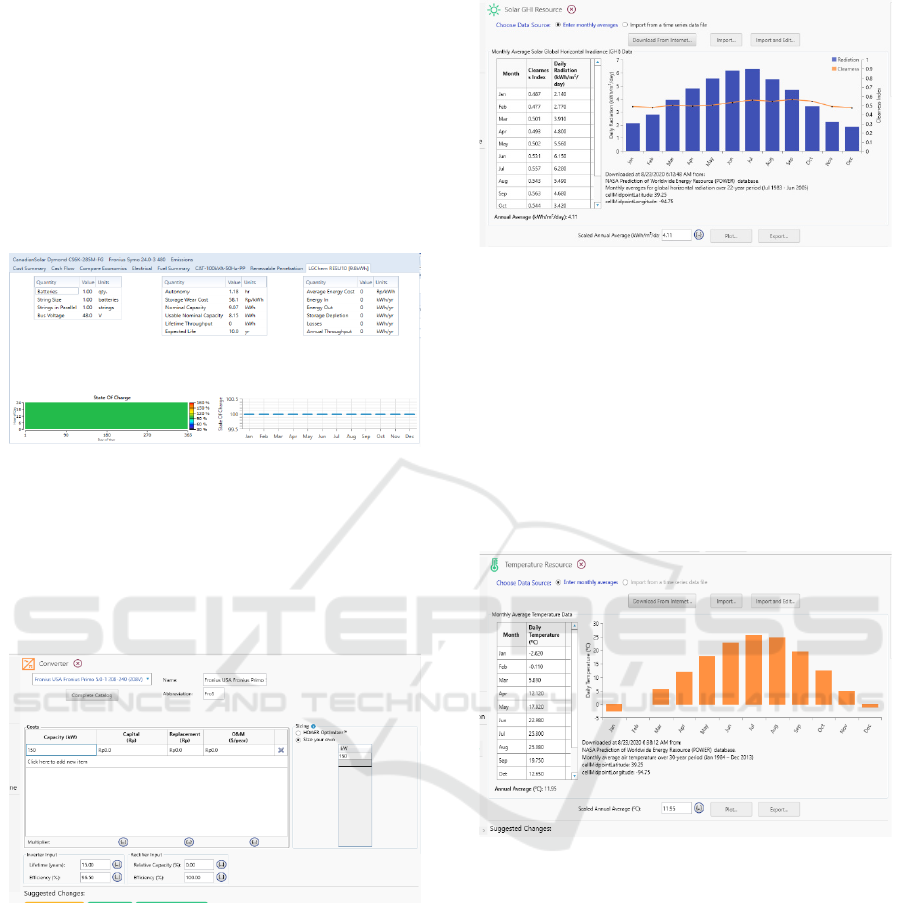
2.5 Bending Tool
The bending tool has a base-load of 59.9 kwd or 1,797
kwm. The average of power, voltage and current of
the bending tool are specified on Table 2.
Table 2: Average current requirement.
Item I II III IV
Day
V
Avera
g
e
Power
(w)
4750 3000 5400 4400 5600 4630
Voltage
(v)
378 377 378 368 378 376
Current
(
I
)
12,56 7.95 14.28 11.95 14.81 12
Table 2 depicted: the average power 4,630 watt,
voltage 376 volt and average current 12 ampere per
day. The data was obtained from the measurement of
5 consecutive working days of the bending tool.
Figure 2: Bending tool.
PV mini-grid configuration generally requires
three elements: PV, baterry and inverter. The inverter
used is an off-grid inverter.
2.6 Photo Voltaic
To determine the amount of PV required for the
bending tool, see the following detailed calculation:
Wp: watt peak
E0: energy to produce
Psh: peak sun hour (3-5 hours for tropics)
Ef: system efficacy (0.67-0.75)
Cf: temperature correction factor (1.1 - 1.5)
𝑊𝑝 =
,
.
1.1 (1)
Wp = 17,877
The required PV is 47 units of 385 wp each.
2.7 Solar Cells
This simulation uses Canadian solar cell 260CS6P-
260M-EA with 385 wp per unit. The design is to
iCAST-ES 2022 - International Conference on Applied Science and Technology on Engineering Science
508
installed 47 unit solar cells with total capacity of 18
kwp for 30-year lifespan, required total cost of IDR
16,093,637 (or approx. IDR 2,299,091 per panel).
2.8 Batteries
PLTS system design uses 8 unit of LGChem RESU10
batteries with 9.8 kwh capacity for 10-year lifespan,
estimated cost of IDR 13,200,000 (or approx. IDR
1,650,000 per unit. (Hilton all, 2015).
Figure 3: Battery settings window.
2.9 Converter
The schematic PV mini-grid system uses 5 unit
converters Fronius Primo USA 5.0-1 208-240 (208
volt) with capacity of 150 kw for 15-year lifespan,
with estimated cost around IDR 5,906,363
Figure 4: Converter setting window.
2.10 Solar Radiation Converter Settings
Window Sun
exposure data is obtained from the NASA website
through an online website. Data that used is the
average solar radiation per month in a year
Figure 5: Air temperature.
The image above shows the air temperature. The
average air temperature caused by solar radiation for
a year ranges from -2 to 25℃. The resulting air
temperature is not more than the nominal temperature
value of the solar cell used. The nominal temperature
of the solar cells used is 45℃. The value of air
temperature resulting from the intensity of sunlight
must not exceed the nominal value of the solar cell
temperature. If this happens, it will cause damage to
the solar cell. (Jovanovic et al., 2017).
Figure 6: Solar radiation.
setting window Image of solar radiation setting
window in HOMER software. The average solar
radiation in a year ranges from 2 to 6 kWh/m2
/
day.
The largest solar radiation is in July, which is 6,280
kWh/m2
/
day and the smallest in December is 2,550
kWh/m2
/
day.
2.11 Load
Electrical load data used in this study was obtained
from PLN with an average usage in 2020. After the
electrical load data was obtained, it was then inputted
into the Homer software. (Kabir all, 2018).
Analysis of Energy Needs in the Small and Medium Enterprise (SME) Businesses Base on the Photovoltaic Cell
509

Figure 7: Load setting window.
After the electrical load is input into the homer
system, then load settings are carried out for every
hour or every day. However, before setting the hourly
load usage, it is necessary to do a calculation to find
out the average load usage in a month.
Figure 8: Hourly load regulation window in a year.
3 DISCUSSION
3.1 Analysis of Solar Cell Usage
Parameter Effect on Hybrid
results of this simulation aim to determine the
efficiency level of solar cells while operating. Where,
the optimization results are obtained when the
simulation process is finished running. (Mikita all,
2016).
Figure 9: Simulation display of solar cell production.
The energy produced by solar cells depending on
the solar radiation each month.
Figure 10: Graph of electrical energy generated by PLTS
per month in a year.
Based on the picture above, it can be explained
that the energy produced by solar cells in July is the
highest, while the lowest is in December. This is
because the solar radiation in July is the highest while
in December it is the lowest (Djunaedy all, 2019).
The average electrical energy produced per month
from the lowest to the highest is between 5.59 kW
(December) -12.33 kW (July) and the maximum daily
electrical energy produced per month in a year from
the lowest to the highest is between 22 ,28 kW
(December) - 41.95 kW (July). Meanwhile, the
maximum annual electrical energy produced per
month from the lowest to the highest is between
45.83kW (in December) - 50.22 kW (November).
Figure 11: Daily graph of electrical energy generated by PV
per month in a year.
3.2 Payback Period
To be able to find out payback period, first calculate
the amount of income per year from the simulation
system. (Nawaitulah & Natsir, 2018). Annual income
can be determined by calculating the amount of
electrical energy produced at the current selling price
iCAST-ES 2022 - International Conference on Applied Science and Technology on Engineering Science
510

of electrical energy. The selling price of renewable
electricity for the Cilengsi area as a whole is Rp.
1,644.52 per kWh, so that the annual revenue
generated by the generator is:
Revenue = Total energy production (kwh)
× electricity selling price
= 542× 1,644.52 x 12
= Rp.10,692,576 per year
. (2)
The total investment is Rp. 127.163.640 obtained
from the price of PV, Batteries and inverters. After
knowing the income earned per year, then calculate
the value of the payback period. The time required for
the return of capital costs incurred on the construction
of this PV is 11 years and 8 months. With the
calculation of 127.163.640 /10.692.576 = 11.8.
4 CONCLUSIONS
Based on the results of the analysis and discussion,
the following conclusions are drawn from this
research: the power requirement for bending tools is
59.9 kw/day or 1.797 kw per month, 7 PLTS designs
with a capacity of 385 wp/unit produce 18.06 kw/day
or 542 kw/month. and electricity savings per month
of Rp.891,048.
REFERENCES
Ariodarma, D., (2016). Analysis of Plth Potential (Solar &
Wind) for Electrical Energy Supply in Ketapang Island.
Effendi, A., 2016. Evaluation of the Intensity of Electrical
Energy Consumption Through the Initial Audit of
Electrical Energy at Rsj. Prof. Hb. Saanin Padang.
Journal of Electrical Engineering-ITP, 5(2).
García Martínez, M., 2018.Microxarxa D'alimentació
Híbrida, Amb Support Fotovoltaic I Generació Dièsel,
Per A Install Lacions D'ús Públic Amb Xarxa Elèctrica
Feble(Bachelor's Thesis, Universitat Politècnica De
Catalunya).
Gunawan, W., 2018. Reducing Energy Consumption By
Auditing And Energy Management In The Control
Room (Case Study At Pt Pwi).Journal of Industrial
Services,4(1).
Hilton, P., Armstrong, N., Brennand, C., Howel, D., Shen,
J., Bryant, A., ... & Homer, T., 2015. Patient Interview
Study. InInvestigate-I (Invasive Evaluation Before
Surgical Treatment of Incontinence Gives Added
Therapeutic Effect?): A Mixed-Methods Study To
Assess The Feasibility of A Future Randomized
Controlled Trial Of Invasive Urodynamic Testing Prior
To Surgery For Stress Urinary Incontinence In Women.
Nihr Journals Library.
Jovanovic, J., Sun, X., Stevovic, S., & Chen, J. 2017.
Energy-Efficiency Gain By Combination Of Pv
Modules And Trombe Wall In The Low-Energi
Building Design. Energy And Buildings, 152, 568-576.
Kabir, E., Kumar, P., Kumar, S., Adelodun, AA, & Kim,
KH, 2018. Solar Energy: Potential And Future
Prospects.Renewable And Sustainable Energy
Reviews,82, 894-900.
Mikita, M., Kolcun, M., onka, Z., Vojtek, M., & pes, M.,
2016. Sizing Of Small Grid-Off Renewable Sources
Hybrid In Conditions Of North-Eastern Slovakia.
Power And Electrical Engineering, 33, 31-34.
Muhammad, AH, Djunaedy, E., Sujatmiko, W., & Utami,
ARI, 2019. Analysis of the Effect of Ottv on the
Intensity of Energy Consumption in Various Types of
Buildings. Eproceedings Of Engineering, 6(2).
Myson, M., 2018. Opportunities for Efficiency in Energy
Use in the Hospitality Sector in Jambi City. Journal of
Civronlit Unbari, 3(1), 37-45.
Nawaitulah, N., & Natsir, A., 2018. Analysis of Energy
Efficiency in Buildings to Support Energy
Conservation Programs. Dielectrics, 5(1), 1-7.
Analysis of Energy Needs in the Small and Medium Enterprise (SME) Businesses Base on the Photovoltaic Cell
511
