
The Effect of Service Innovation and Self Service Technology on
Customer Satisfaction PT Bank Negara Indonesia (Persero) Tbk Kc
Medan
Mufida Sari
Master of Management Science, Faculty of Economics and Business, University of North Sumatra, Medan, Indonesia
Keywords: Service Innovation, Self Service Technology, E-Satisfaction.
Abstract: This study aims to identify and analyze service innovation and self service technology on e-satisfaction at PT
Bank Negara Indonesia (Persero) Tbk during February to April 2022. Currently, the banking industry is
competing to develop technology-based products and services. In order to compete, survive, and thrive, the
banking industry must make new innovations to provide convenience to customers in meeting customer needs.
Innovation in the banking industry can be done by adopting various self service technologies (SST). Service
innovations such as service concept, customer interface, service development and delivery, and technological
options are taken into consideration in measuring customer satisfaction. Self service technology such as
functionality, enjoyment, security/privacy, design, convenience, customization, and assurance are also
considered in measuring customer satisfaction. This research is a quantitative research with causal associative
research. The population in this study are customers of PT Bank Negara Indonesia (Persero) Tbl who have
used BNI mobile banking. The sampling technique used was random sampling so that there were 100
customers who were the samples in this study. The results showed that service innovation and self service
technology had a positive and significant effect on e-satisfaction.
1 INTRODUCTION
Technological developments affect companies in
carrying out their functions in order to survive in the
current market. The invention of increasingly
sophisticated technology is intended to provide
positive benefits for life while simplifying human
work. Almost all daily human activities are supported
by this technology, not least in running the business
that occurs in the company, including in the banking
sector. Currently, the banking industry is competing
to develop both technology-based products and
services . In order to compete, survive, and thrive, the
banking industry must make new innovations to
provide convenience to customers in meeting
customer needs. This is in line with what Lovelock
(2012) stated that the service sector is the sector that
experiences the biggest changes due to the rapid
changes experienced by other factors such as
technological changes which directly increase the
competitive climate in the banking industry.
The banking industry needs to innovate in
combining digital technology with customer
interaction, in this case the findings of these new
technologies must make it easier and provide
convenience for customers in accessing banking
services. According to Kotler & Keller (2009)
innovation is related to new things that are created as
a form of breakthrough to products, services, ideas,
and perceptions from someone which can be in the
form of new products, development of new products,
design changes, technical innovations, and so on. new
business ideas or new processes. Innovation in the
banking industry can be done by adopting various
kinds of self service technologies (SST) (Orel and
Kara, 2013). Meuter et al (2000) define self service
technologies as technological interfaces that allow
consumers to produce a service independently of the
direct involvement of company employees. Self
service technologies are expected to provide
customer satisfaction through information
technology-based services such as performance,
information, security and sensation in using e-
banking.
According to Kotler and Keller (2009)
satisfaction is a person's feelings of pleasure or
Sari, M.
The Effect of Service Innovation and Self Service Technology on Customer Satisfaction PT Bank Negara Indonesia (Persero) Tbk Kc Medan.
DOI: 10.5220/0011823100003460
In Proceedings of the 4th International Conference on Social and Political Development (ICOSOP 2022) - Human Security and Agile Government, pages 383-390
ISBN: 978-989-758-618-7; ISSN: 2975-8300
Copyright
c
2023 by SCITEPRESS – Science and Technology Publications, Lda. Under CC license (CC BY-NC-ND 4.0)
383

disappointment arising from comparing the perceived
performance of the product (or outcome) against their
expectations.
The digitalization trend that demands speed and
convenience makes PT Bank Negara Indonesia
(Persero) Tbk continue to innovate to meet the needs
of its customers. Especially in services through self-
service technology which is expected to be easier,
faster, and more reliable to use in transactions. In
order to meet the different needs of each customer, PT
Bank Negara Indonesia (Persero) Tbk always makes
efforts to improve customer mobile banking
transactions . The following is a table of BNI mobile
banking users from January to March 2022 in Medan
City.
Table 1: Number of BNI Mobile Banking Users in Medan
City January – March 2022.
Month Number of Users
January 83%
February 19%
March 63%
Source: https://trends.google.com.
Table 1. shows that BNI mobile banking users
from January to March 2022 in Medan City
fluctuated. This indicates customer.
Previous research conducted by Sakun Boon Itt
(2015) showed that self-service technology positively
affects e-satisfaction. Meanwhile, research by Evan
Setiawan (2016) reveals that self-service technology
leads to reduced interactions between company
employees and customers to create results from
services. According to McCollough in Evan Setiawan
(2016) the relationship between service failure and
customer satisfaction can be explained by looking at
initial disconfirmation and recovery disconfirmation .
Previous research on the effect of service innovation
on e-satisfaction was conducted by Rew (2020) which
showed that innovation in service companies
positively affects customer satisfaction. Research
conducted by Simon (2020) found that not all
dimensions of innovation affect satisfaction.
Based on the description above, in connection
with the importance of knowing the effect of service
innovation and self service technology in increasing
customer satisfaction, the authors are interested in
conducting research with the title:
"The Influence of Service Innovation and Self
Service Technology on Customer Satisfaction of PT
Bank Negara Indonesia (Persero) Tbk KC Medan".
2 LITERATURE REVIEW
2.1 Service Innovation
According to Drucker (2012), innovation is a specific
tool for companies where innovation can explore or
take advantage of changes that occur as an
opportunity to run a different business. Innovation is
related to new things that are created as a form of
breakthrough to products, services, ideas, and
perceptions from someone which can be in the form
of new products, development of new products,
design changes, technical innovations, to new
business ideas or new processes. (Kotler & Keller,
2009). According to (Delafrooz et al, 2013) service
innovation can make consumers very satisfied with
the services provided. With this innovation, there will
be continuous quality improvement so that consumers
will feel more satisfied and reluctant to switch to
other products or companies:
Hertog (2010) defines service innovation in a
four-dimensional model as follows:
1. Service Concept
Creation of new concepts in services in specific
markets.
2. Customer Interface
Refers to the process of interface interaction
between service providers and consumers because
this process is included in the process of creating
services and value. The interface can be face-to-
face, or through electronic media.
3. Service Development and Delivery
Service development and delivery. These
activities involve infrastructure, processes, and
employees to produce and deliver services to
consumers.
4. Technological Options
Choice of technology used, especially
information technology. This is important for
services because it allows for greater efficiency
and effectiveness.
2.2 Self Service Technology (SST)
The term "SST" was first used by Meuter et al (2000).
SST is defined as a technology interface that allows
consumers to produce a service independently from
the direct involvement of company employees.
Continuous progress from traditional service delivery
to modern SST is essential for all service industries.
Moreover, many customers turn to internet-based
services because they find it easy to use, fun, and
convenient (Meuter et al., 2000).
ICOSOP 2022 - International Conference on Social and Political Development 4
384

According to Hsieh et al (2006) there are seven
dimensions of self-service technology (SST) quality,
namely:
1. Functionality
This dimension represents the functional
characteristics of self-service technology (SST),
namely:
a. Reliability (reliability)
Is the power to provide guaranteed services
reliably and on target.
b. Responsiveness (responsiveness)
Is the ability of SST devices to respond to
commands entered into the system by
customers.
c. Simple and easy to use
Is the SST device can be operated easily and
requires little effort.
d. Respond to requests quickly
Is the service on the SST device can be
completed in a short time.
2. Enjoyment
It is the perception of pleasure and interest that the
user encounters while using and after using the
SST device.
3. Security/Privacy
Refers to freedom from risk or doubt that the user
will feel. The facilities provided by the SST
device in building a sense of security and comfort
for consumers in their operation.
4. Design
Covers the overall look of the SST, which gives it
a good aesthetic appearance. The beauty of the
shape and arrangement of the SST device to create
an attractive appearance for the user.
5. Assurance
Describing confidence because of the reputation
and competence of the SST device that prioritizes
trust because of the reputation and competence of
the SST provider. Assurance can create a sense of
security for its consumers.
6. Convenience Dimension of convenience
Describes the accessibility of SST services, with
the ease and convenience of SST services to use.
7. Customization
This is the dimension in which SST devices can
be changed to suit consumer preferences and
desires. Aims to understand and meet user needs
without being fixated on the structure of the
system.
2.3 E-Satisfaction
The word satisfaction comes from the Latin "satis"
(meaning good enough, adequate and "facio" to do or
make). Satisfaction, according to Oliver (1997) is "a
summary of the psychological states that result when
emotions around unconfirmed expectations are
combined with consumers' prior feelings about the
consumer experience." From his point of view,
"satisfaction is perhaps best understood as the
ongoing evaluation of the surprise inherent in the
product acquisition and/or consumption experience."
The dimensions of satisfaction by Hawkins and
Looney in Tjiptono (2011) are reviewed from 6
aspects as follows:
1. Overall Customer Satisfaction (Overall Customer
Satisfaction)
Considering the level of customer satisfaction of
the company's services and compare them with
competitors ' services as a whole.
2. Dimensions of Customer Satisfaction
By identifying the dimensions that are the core of
customer satisfaction based on specific items that
most influence overall customer satisfaction .
3. Conformance of Expectations (Confirmation of
Expectation)
Obtained on the basis of conformity or
discrepancy between customer expectations
regarding the quality of products or services from
the company.
4. Repurchase Intent (Repurchase Intent)
Customer satisfaction or not is obtained from
seeing whether there will be a repeat purchase of
a product from the same customer .
2. Willingness to Recommend (Willingness to
Recommend)
Here can be seen customer loyalty to promote
either directly or indirectly the company's services
to others.
3. Customer Dissatisfaction (Customer
Dissatisfaction)
Aims to re-examine what aspects of customer
dissatisfaction.
In this study, to evaluate customer satisfaction, the
indicators used according to Tjiptono (2014) are as
follows:
1. Conformance of expectations
2. Interest in visiting or repurchasing
3. Willingness to recommend
2.4 Relationship of Service Innovation
to E-Satisfaction
E-Satisfaction is a measuring tool for companies to
survive in a competitive market environment. In the
research of Rew, et al. (2020) explains that customer
satisfaction can be generated from the customer's
experience in using the service, besides the system
The Effect of Service Innovation and Self Service Technology on Customer Satisfaction PT Bank Negara Indonesia (Persero) Tbk Kc Medan
385

used by consumers in running the service can increase
consumer satisfaction. So with service innovation, it
can encourage customers to play an active role in the
service process. Innovation explicitly increases the
company's opportunities to meet very high customer
needs, so companies can easily create customer
satisfaction. In the banking sector, service innovation
measures the effectiveness provided to customers and
can create customer satisfaction and loyalty. Thus, the
hypotheses related to service innovation on e-
satisfaction are as follows:
H1: Service Innovation has a positive effect on E-
Satisfaction
2.5 Relationship of Self Service to
E- Satisfaction
Self service technology is defined as an interface
technology that allows consumers to produce a
service independently of the direct involvement of
company employees (Meuter et al, 2000). Sakun
Boon Itt's research (2015) shows that self-service
technology positively affects e-satisfaction. E-
Satisfaction comes from customer expectations, in
this case self service technology will meet customer
expectations in its service. Manual service sometimes
creates problems, given the inevitably long queues.
So it appears, there is a gap between expectations and
the reality of the service received by customers. Self
service technology actually fills this gap. Customers
who want fast and accurate service will greatly
benefit from responding to the application of
technology. So that self-service technology will have
a positive effect on e-satisfaction. So the hypothesis
related to self service technology on e-satisfaction is
as follows:
H2: Service Innovation has a positive effect on E-
Satisfaction
Service
Innovation
(X1)
Self service
technology
(X2)
Figure 1. Conceptual Framework.
3 RESEARCH METHOD
For the mutual benefit and protection of Authors and
Publishers, it is necessary that Authors provide
formal written Consent to Publish and Transfer of
Copyright before publication of the Book. The signed
Consent ensures that the publisher has the Author’s
authorization to publish the Contribution.
The copyright form is located on the authors’
reserved area.
The form should be completed and signed by one
author on behalf of all the other authors.
3.1 Types of Research
The type of research used in this study is causal which
aims to analyze how one variable affects other
variables. This study was to analyze the effect of
service innovation and self service technology on e-
satisfaction . This research was conducted at PT Bank
Negara Indonesia (Persero) Tbk starting from
February to April 2022.
3.2 Population and Sample
The population in this study are people who have used
BNI mobile banking . The sampling technique in this
study used a random sampling technique , namely a
sampling technique in which all individuals in the
population either individually or together are given
the same opportunity to be selected as sample
members.
In determining the sample, if the population is
large and the number is unknown, then according to
Widianto (2008:35) the formula is used:
H2: Service Innovation has a positive effect on E-
Satisfaction
n
𝑍
4 𝑀𝑜𝑒²
Information :
n = number of samples
Z = Z value with 95% confidence level
then the value of Z = 1.96 (distribution table
normal)
Moe = margin of error or maximum error
is 10%. By using a margin of error of 10%,
the minimum number of samples that can be
taken is:
n = 1.962 / 4 (0 .10 ) ²
n = 96 .04 which is rounded to 97
In order for this study to be more fit, in this study
a sample of 100 people was taken. The reason the
sample is rounded up to 100 people is because if one
E-Satisfaction
(Y)
ICOSOP 2022 - International Conference on Social and Political Development 4
386
of the questionnaires contains data that is not valid, it
can use the more filling in the questionnaire. The
number of respondents as many as 100 people is
considered representative because it is greater than
the minimum sample limit.
4 RESULTS AND DISCUSSION
4.1 Validity and Reliability Test
4.1.1 Validity Test
The validity test was carried out with the aim of
testing the validity of each question item on the
questionnaire that had been designed. A question
item is said to be valid if the correlation value (R h
count) of the question item > R table (0.361) . Table
4. 1 presents the results of the validity test for each
question item from the questionnaire.
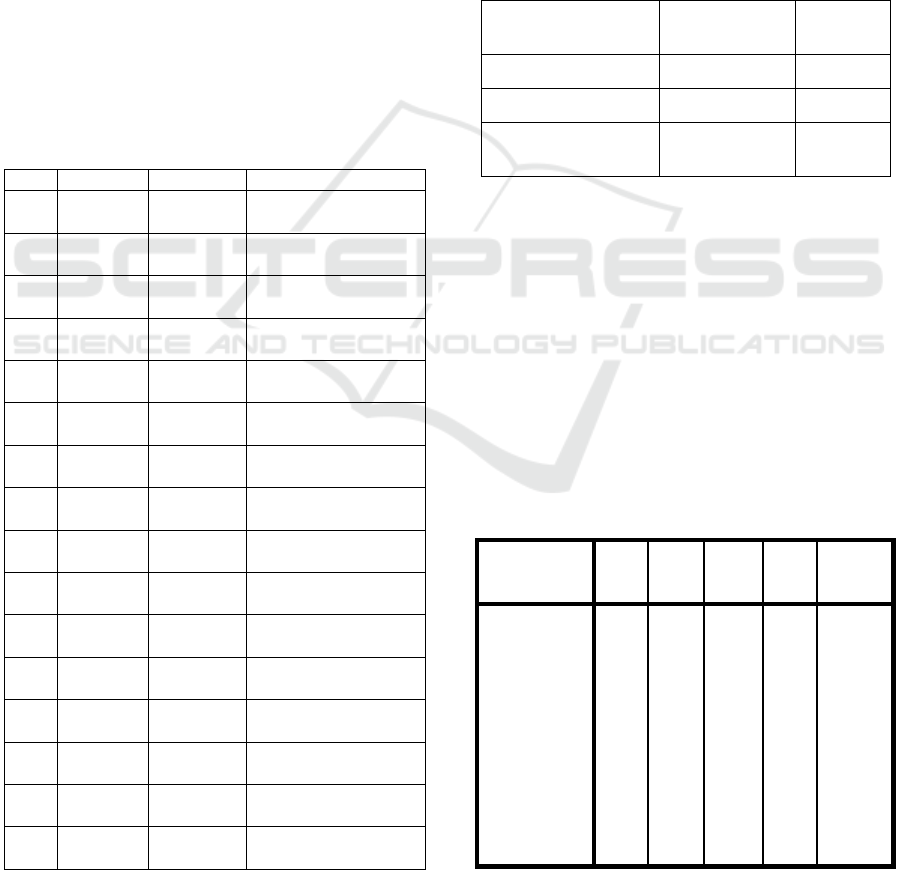
Table 4.1 Validity Test of Questionnaire Question Item
P R Count R Table Results
Y11 0.769 0.361
Valid (R Count > R
Table
)
Y12 0.618 0.361
Valid (R Count > R
Table)
Y13 0.78 0.361
Valid (R Count > R
Table)
Y14 0.863 0.361
Valid (R Count > R
Table
)
X11 0.815 0.361
Valid (R Count > R
Table
)
X12 0.877 0.361
Valid (R Count > R
Table)
X13 0.888 0.361
Valid (R Count > R
Table
)
X14 0.763 0.361
Valid (R Count > R
Table
)
X15 0.849 0.361
Valid (R Count > R
Table)
X16 0.877 0.361
Valid (R Count > R
Table)
X17 0.855 0.361
Valid (R Count > R
Table
)
X18 0.882 0.361
Valid (R Count > R
Table)
X21 0.762 0.361
Valid (R Count > R
Table)
X22 0.761 0.361
Valid (R Count > R
Table
)
X23 0.65 0.361
Valid (R Count > R
Table)
X24 0.804 0.361
Valid (R Count > R
Table)
A question is said to be valid if the value of R
count> 0.3 61 (R table ). It is known that all calculated
R values are > 0.3 61 (R table ). So it can be
concluded that all of the questionnaires are valid.
4.1.2 Reliability Test
Reliability testing must be done only on questions
that already have or meet the validity test, so if it
doesn't meet the validity test requirements then it
doesn't need to be continued for reliability testing .
The following are the results of the reliability test on
valid question items.
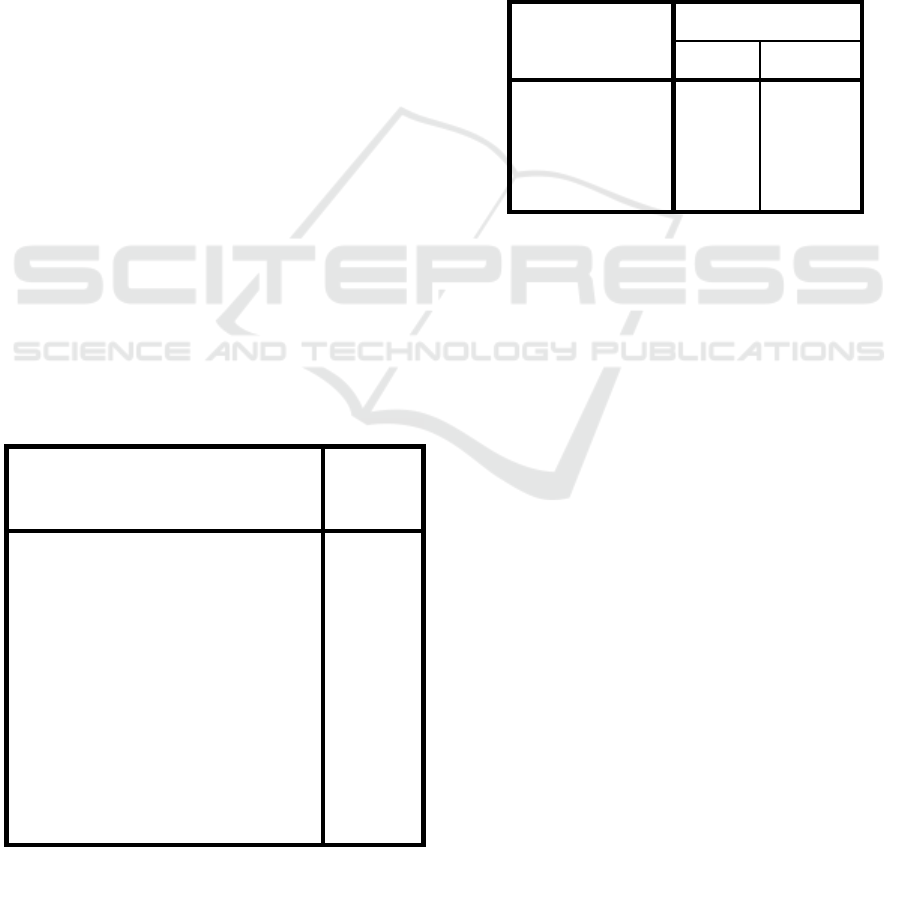
Table 4.2 Reliability Test
Variable
Cronbach's
Alpha Results
E-Satisfaction (Y) 0.882 Reliable
Self Service (X1) 0.959 Reliable
Service Innovation
(X2) 0.88 Reliable
If the value of Cronbach's Alpha greater than 0.6,
then the research questionnaire is reliable. It is known
that the questionnaire is reliable, because all values of
Cronbach's Alpha greater than 0.6.
4.2 Descriptive Statistical Analysis
In the descriptive analysis section, the minimum,
maximum, average and standard deviation values are
presented based on e-satisfaction, self service
technology and service innovation.
Table 4.3 Descriptive Statistics
Descri
p
tive Statistics
N
Minim
um
Maxim
um Mean
Std.
Deviation
E-Satisfaction
(Y)
100 2.75 4.75
3.807
5
.45762
Self Service
(X1)
100 1.38 5.00
3.730
0
.70526
M-
Payment(X2)
Innovation
100 1.25 5.00
3.595
0
.66646
Valid N
(listwise)
100
The Effect of Service Innovation and Self Service Technology on Customer Satisfaction PT Bank Negara Indonesia (Persero) Tbk Kc Medan
387
Based on Table 4.3 , it is known that the minimum
value of e-satisfaction is 2.75, while the maximum
value of e-satisfaction is 4.75. The average e-
satisfaction is 3.8075, with a standard deviation of
0.45762. It is known that the minimum value of self-
service is 1.38, while the maximum value of self-
service is 5. The average value of self-service is
3.7300, with a standard deviation 0.70526. It is
known that the minimum value of m-payment
innovation is 1.25, while the maximum value of m-
payment innovation is 5. The average value of m-
payment innovation is 3.5950, with a standard
deviation of 0.66646.
4.3 Classical Assumption Test
4.3.1 Normality Test
The normality test aims to test whether in the
regression model, the confounding or residual
variables have a normal distribution. Test tand
Fassume that the residual value follows a normal
distribution. In this study, the normality test of the
residuals using the Kolmogorov-Smirnov test. The
level of significance used is α=0,05. The basis for
making decisions is to look at the probability numbers
p, with the following conditions.
the probability value is p≥0.05, then the assumption
of normality is met.
If the probability < 0.05 then the assumption of
normality is not met.
Table 4.4 Normality Test
One-Sample Kolmogorov-Smirnov Test
Unstandard
ized
Residual
N 100
Normal Parameters
a,,b
mean .0000000
Std. Deviation .39233875
Most Extreme
Differences
Absolute .046
Positive .045
negative -.046
Kolmogorov-Smirnov Z .459
asymp. Sig. (2-tailed) .984
a. Test distribution is Normal.
b. Calculated from data.
Note that based on Table 4.4, the probability value
por Asymp is known. Sig. (2-tailed) of 0.984. Due to
the probability value p, which is 0.984, greater than
the level of significance, which is 0.05. This means
that the data is normally distributed 1.
4.3.2 Multicollinearity Test
To check whether there is multicollinearity or not, it
can be seen from the value of the variance inflation
factor (VIF). A VIF value that is more than 10
indicates that an independent variable has
multicollinearity (Ghozali, 2013).
Table 4.5 Multicollinearity Test
Model
Collinearity Statistics
Tolerance VIF
1 (Constant)
Self Service (X1) .998 1.002
Service
Innovation (X2)
.998 1.002
Note that based on Table 4.5, it is known that the
VIF value of self service technology is 1.002, while
the maximum value of service innovation is 1.002.
Because all VIF values < 10, it is concluded that there
is no multicollinearity.
4.3.3 Heteroscedasticity Test
Detection of the presence or absence of
heteroscedasticity can be done by looking at the
presence or absence of certain patterns on the scatter
plot graph between SRESID on the Y axis, and
ZPRED on the X axis ( Ghozali, 2013). Ghozali
(2013) states that the basis of the analysis is that if
there is a certain pattern, such as the points that form
a certain regular pattern, it indicates that
heteroscedasticity has occurred. If there is no clear
pattern, and the points spread above and below the
number 0 on the Y axis, then there is no
heteroscedasticity.
4.4 Hypothesis Test
4.4.1 Simultaneous Significance Test (F
Test)
The F test aims to test the effect of the independent
variables together or simultaneously on the dependent
variable e-satisfaction.
ICOSOP 2022 - International Conference on Social and Political Development 4
388
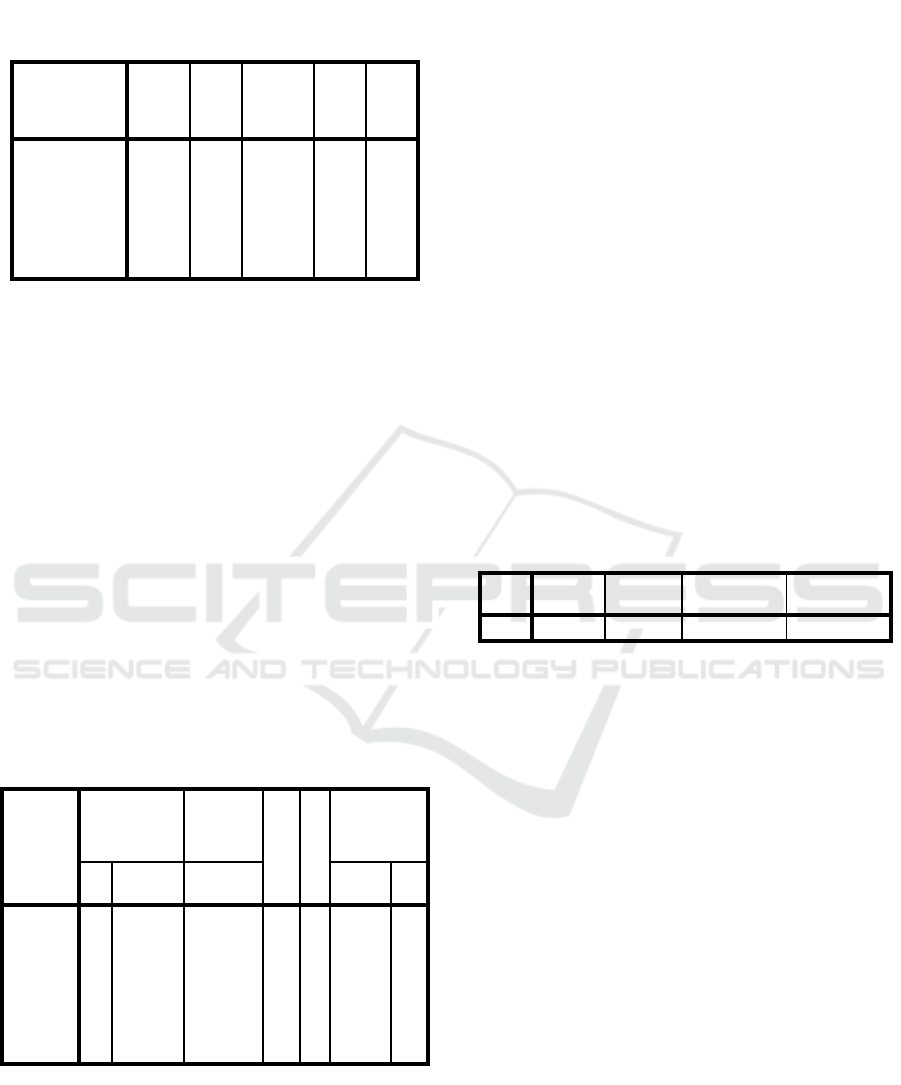
Table 4.6 Simultaneous Effect Test (F Test)
ANOVA
b
Model
Sum of
Square
s Df
Mean
Square F Sig.
1 Regressio
n
5.493 2 2,746 17,48
2
.000
a
Residual 15,239 97 .157
Total 20.732 99
a. Predictors: (Constant), Service Innovation(X2), Self Service
Technology (X1)
b
. Dependent Variable: E-Satisfaction (Y)
Based on Table 4.6, it is known that the calculated
F value is 18 .966 and the Sig value. is 0.000. It is
known that the calculated F value is 17 ,482 > F table
3 , 09 and the Sig value is 0.000 < 0, 05 , then self
service technology and service innovation together or
simultaneously have a significant effect on e-
satisfaction.
4.4.2 Test of Partial Significance (t Test)
Statistical t test was used to determine the level of
significance of the effect of each independent variable
on the dependent variable. Table 4.7 presents the
value of the regression coefficient, as well as the
value of the t statistic for partial effect testing.
Table 4.7 Test of Significance of Partial Influence (Test t)
Coefficients
a
Model
Unstandardized
Coefficients
Standardiz
ed
Coefficient
s
t
Sig
.
Collinearity
Statistics
B Std. Erro
r
Beta
Toleranc
e VIF
1 (Constan
t)
200
8
.311
6.45
9
.00
0
Self
Service
(X1)
.200 .057 .308 353
7
.00
1
.998 1.00
2
Service
Innovatio
n (X2)
.293 .060 .427 4.89
9
.00
0
.998 1.00
2
a. Dependent Variable: E-Satisfaction (Y)
Based on the results in Table 4.7, the following
regression equation is obtained.
Y = 2.008 + 0.200X1 + 0.293X2 + e
Based on the results in Table 4.7:
1. Self service technology has a positive effect
on e-satisfaction, with a regression
coefficient value of 0.200, and significant,
with a t-value = 3.537 > 1.98 and a Sig value.
= 0.001 < 0.05. So it can be concluded that
self service technology has a positive and
significant effect on e-satisfaction.
2. Service innovation has a positive effect on e-
satisfaction, with a regression coefficient
value of 0.293, and is significant, with a t-
count value = 4.899 > 1.98 and a Sig value.
= 0.000 < 0.05. So it can be concluded that
service innovation has a positive and
significant effect on e-satisfaction.
4.4.3 Analysis of the Coefficient of
Determination
The coefficient of determination (R
2
) is a value (the
value of the proportion) that measures how much the
ability of the independent variables used in the
regression equation to explain the variation of the
dependent variable.
Table 4.8 Coefficient of Determination
Model Summary
b
Model R R Square
Adjusted R
Square
Std. Error of
the Estimate
1 .515
a
.265 .250 .39636
a. Predictors: (Constant), Service Innovation(X2), Self Service
Technology(X1)
b. Dependent Variable: E-Satisfaction (Y)
Based on Table 4.8, it is known that the
coefficient of determination (R-Square ) is 0.265.
This value can be interpreted that the variable of self
service technology and service innovation is able to
influence e-satisfaction by 26.5 % , the remaining
100% - 26.5 % = 73.5% is explained by other
variables or factors.
5 CONCLUSIONS
Based on the results of the study, it can be concluded
that:
1. Self service technology and service innovation
are able to influence e-satisfaction by 26.5% ,
the remaining 100% - 26.5 % = 73.5% is
explained by other variables or factors.
2. Self service technology and service innovation
together or simultaneously have a significant
effect on e-satisfaction.
The Effect of Service Innovation and Self Service Technology on Customer Satisfaction PT Bank Negara Indonesia (Persero) Tbk Kc Medan
389

3. Self service technology has a positive effect on
e-satisfaction , with a regression coefficient
value of 0.200, and significant, with a t-count
value = 3.537 > 1.98 and a Sig value. = 0.001 <
0.05. So it can be concluded that self service
technology has a positive and significant effect
on e-satisfaction.
4. Service innovation has a positive effect on e-
satisfaction , with a regression coefficient value
of 0.293, and is significant, with a t-count value
= 4.899 > 1.98 and a Sig value. = 0.000 < 0.05.
So it can be concluded that service innovation
has a positive and significant effect on e-
satisfaction.
REFERENCES
Delafrooz , nNarges et al. (2013). The Impact Of Service
Innovation On Consumer Satisfaction . 3 (2).Smith, J.,
1998. The book, The publishing company. London, 2
nd
edition.
Demirici, Orel & Kara, Ali. (2013). Supermarket Self
Checkout Service Quality, Customer Satisfaction, and
Loyalty: Empirical Evidence from an Emerging
Market. Journal of Retailing and Consumer
Service.Smith, J., 1998. The book, The publishing
company. London, 2
nd
edition.
D en Hertog, P. , van der Aa , W. and de Jong, MW (2010),
"Capabilities for managing service innovation: towards
a conceptual framework", Journal of Service
Management , Vol. 21 No. 4, pp. 490-514.Smith, J.,
1998. The book, The publishing company. London, 2
nd
edition.
Drucker, PF (2012). Innovation and Entrepreneurship .
Jakarta: Erlangga.
Evan Setiawan (2016) “The Effect of Failure and Self
Service Technology Recovery on Online Shopping
Experience, Satisfaction and Repurchase Intention: An
Overview from a Critical Sdl Perspective” Baabu Al-
Ilmi Vol. 1 No.2Smith, J., 1998. The book, The
publishing company. London, 2
nd
edition.
Fandy, Tjiptono. 2011. Service Management Realizing
Excellent Service . Edition 2. Yogyakarta: Andi.Smith,
J., 1998. The book, The publishing company. London,
2
nd
edition.
Fandi, Tjiptono. 2014. Service, Quality & Satisfaction.
Edition 3. Yogyakarta: Andi Publisher.Smith, J., 1998.
The book, The publishing company. London, 2
nd
edition.
Ghozali, Imam. 2013. Application of Multivariate Analysis
with IBM SPSS 21 Update PLS Regression Program.
Semarang: Diponegoro University Publishing Agency.
Kotler and Keller. 2009. Marketing Management . Volume
I. 13th Edition. Jakarta: Erlangga
Lin, JC and Hsieh, P. (2006), "The role of technology
readiness in customers' perception and adoption of self-
service technologies", International Journal of Service
Industry Management , Vol. 17 No. 5, pp. 497-517
Lovelock, Christopher, et al. 2012. Marketing Services.
Volume I Seventh Edition. Translation by Dian
Wulandari & Devri Barnadi Putera. 2010. Jakarta:
Erlangga
McCollough, M.A , Berry. LL, & Yadav, MS An empirical
investigation or customer satisfaction after service
failure and recovery. Journal of service research , 3(2),
2000.p.121- I 37Smith, J., 1998. The book, The
publishing company. London, 2
nd
edition.
Meuter, ML, Ostrom, AL, Roundtree, RI, & Bitner, MJ
(2000). Self-service Technologies: Understanding
Customer Satisfaction with Technology-Based Service
Encounters. Journal of Marketing, 64(3), 50–64.
Oliver, Riscrd L, (1997), Satisfaction A Behavioral
Perspective On The Consumer. McGraw-Hill
Education, Singapore.
Rew, D. , Jung, J. and Lovett, S. (2021), "Examining the
relationships between innovation, quality, productivity,
and customer satisfaction in pure service companies",
The TQM Journal , Vol. 33 No. 1, pp. 57-70.
Sakun Boon-itt, (2015) "Managing self-service technology
service quality to enhance e-satisfaction", International
Journal of Quality and Service Sciences, Vol. 7 Issue:
4, pp.373-391
Simon, A. and Honore Petnji Yaya, L. (2012), "Improving
innovation and customer satisfaction through systems
integration", Industrial Management & Data Systems ,
Vol. 112 No. 7, pp. 1026-1043.
ICOSOP 2022 - International Conference on Social and Political Development 4
390
