
Integrated Clean Water Service Management in Klungkung Regency
(Mainland) with Downstream River Utilization
I Gusti Lanang Made Parwita
1
, IGB Sila Dharma
2
, Mawiti Infantri Yekti
3
, I P Gustave Suryantara
3
and IGAG Suryanegara
1
1
Civil Department Polytechnic State of Bali, Jimbaran, Bali, Indonesia
2
Faculty of Marine and Fisheries, Udyanan University, Bali, Indonesia
3
Civil Department Faculty of Enginering Udayana University, Bali, Indonesia
Keywords: Clean Water, Klungkung District, Integrated.
Abstract: Klungkung Regency on the mainland actually has sufficient water sources. The problem with the development
of clean water services in the district is that it is constrained by limited infrastructure so that a lot of water is
wasted in the downstream of the river. On the other hand, the need for water continues to increase due to
population growth and the development of various sectors. The research method uses quantitative analysis by
juxtaposing the availability and demand for water in the future. The results showed that the service coverage
of the regional clean water company (PDAM) in Klungkung Regency was 77.43%. The clean water supply
system of PDAM Klungkung Regency has a production capacity of 382.8 Lt/second with sources of water
production coming from 7 units of springs and 18 units of wells. Until 2040, Klungkung Regency needs clean
water with a capacity of 444.08 liters/second. Based on the existing water shortage, several strategies for
fulfillment have been carried out, including the construction of the Sarbagikung Dam with a capacity of
around 75 liters/second and through the use of water at the mouth of the Unda River with a capacity of around
150 liters/second.
1 INTRODUCTION
Klungkung Regency is one of the regencies that has
sufficient water potential because topographically it
is fed by rivers that flow throughout the year, namely
the Jinah and Unda rivers. The utilization of existing
water has been dominantly used for irrigation
purposes and the rest is used for the fulfillment of
clean water through the regional drinking water
company (PDAM) of Klungkung Regency. The water
sources of PDAM Klungkung are mostly dominated
by groundwater sources through PDAM wells
scattered throughout the region. At this time the
service coverage of PDAM Klungkung Regency is
77.43% with a total of 35,750 customers or 152,893
residents with a percentage of water loss due to
leakage of 35.56% (BARI Bali 2020)
The development of the population and the need for
water for other allocations, such as for tourism needs,
requires a larger water source that must be managed
by the local government. In other parts of the mouth
of the Unda river and the Jinah river, the existing
water can still be utilized. The water of the Unda and
Jinah rivers in the estuary is currently allowed to flow
into the sea in the southern part (BARI Daerah Bali
2020) (Penida 2020). Therefore, it is very necessary
to conduct comprehensive research that can provide
an overview of the current potential, the pattern of
demand and total demand for clean water and
strategies for meeting water in the future. The
problems faced are how much water potential exists
in the mainland part of Klungkung Regency, what is
the current clean water supply system, and what is the
clean water supply system in the future. The research
method is carried out quantitatively related to the
potential, needs, and services as well as the
fulfillment of water in the future. The purpose of this
study is to determine the potential, needs, and
strategies for meeting water in the future by utilizing
water in downstream that is not utilized for irrigation.
Parwita, I., Dharma, I., Yekti, M., Suryantara, I. and Suryanegara, I.
Integrated Clean Water Service Management in Klungkung Regency (Mainland) with Downstream River Utilization.
DOI: 10.5220/0011845300003575
In Proceedings of the 5th International Conference on Applied Science and Technology on Engineering Science (iCAST-ES 2022), pages 601-607
ISBN: 978-989-758-619-4; ISSN: 2975-8246
Copyright © 2023 by SCITEPRESS – Science and Technology Publications, Lda. Under CC license (CC BY-NC-ND 4.0)
601
2 LITERATURE REVIEW
2.1 Integrated Water Resources
Management
2.1.1 Water Scarcity
The development of the number of humans has led to
an increase in the amount of water both in quantity
and quality. On the other hand, water sources that are
not evenly distributed have led to greater water
scarcity. Water is transformed into an item of
economic value that influences the development of a
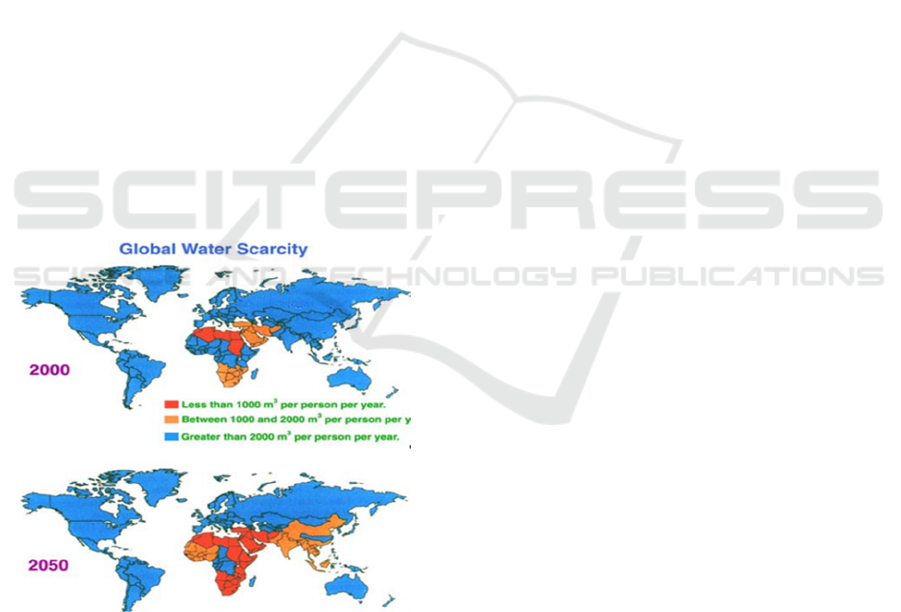
country. By 2020, most of the world's population will
enjoy adequate water services, except in Africa and a
few parts of Asia, which experience water shortages.
However, in 2050 it is estimated that most African
countries and several countries in Asia will
experience problems related to clean water. In 2050,
water use in Africa and Asia will experience a decrease
in water consumption between 1000 and 2000 m3 per
person per year, even in some areas with water
consumption below 100 m3 per person per year. water
scarcity maps show most countries in Africa and Asia
experiencing water shortage problems. Water scarcity
maps show most countries in Africa and Asia
experiencing water shortage problems. More details
can be seen in Figure 1, (Xie 2006):
Figure 1: Distribution of Scarcity of Water Resources (Xie,
2006).
Water scarcity in various parts of the world increases
fulfilment efforts that lead to integrated cross-sectoral
fulfilment. Integration was originally intended purely
for water supply but in its development later it involved
other sectors which were supported by adequate water
availability (Baldwin and Hamstead 2014).
2.1.2 Integrated Water Management
Concept
The availability of water on earth is not always evenly
always distributed in every place and as expected,
thus causing humans with various interests in water
to try to fulfil in various ways from various
competencies they have as well as in various ways of
legitimacy and participation in an integrated manner
(Fulazzaky 2014). The water resources management
approach in the past has not been sufficient to meet
the challenges of global water management. A largely
sectoral management approach, where each sector
(household use, agriculture, industry, environmental
protection, etc.) has been managed separately, with
limited coordination between sectors. This approach
leads to fragmented and uncoordinated development
of water resources. Many uses of water have spillier
effects on other uses and sometimes have unintended
social and environmental consequences. This is
especially true for watersheds where water and land
practices upstream have a direct impact on the
quantity and quality of water downstream. As water
becomes scarcer, it becomes increasingly inefficient
to manage water without acknowledging the
interdependencies between institutions, sectors, and
between geographic areas. (Xie 2006)
The concept of integrated water resource
management has been a necessity for a long time and
is growing according to current and future
developments (MERLA et al. 2005). The United
Nations has tried to encourage the development of
water resource management that can be carried out in
an integrated manner between watersheds and
between regions since 1977 through the integrated
water resources management (IWRM) program.
Since 1992 the IWRM concept has begun to be
massively adapted to almost all countries in the world
with the common goal of achieving equitable access
to water use, which was marked by the existence of a
global water partnership (GWP) program in 1996.
The main mission of GWP is processes that promote
the coordinated development of water, land, and
related resources to maximize equitable and
sustainable economic and social outcomes (Norken
2003).
The availability of water in the hemisphere is not
always evenly distributed in every place and at all
times as expected, thus causing humans with various
interests in water to try to fulfil in various ways from
various competencies they have and in various ways
of legitimacy and participation in an integrated
manner (Cole, Stroma, 2012). The water resources
management approach in the past has not been
iCAST-ES 2022 - International Conference on Applied Science and Technology on Engineering Science
602
sufficient to meet the challenges of global water
management. A largely sectoral management
approach, where each sector (household use,
agriculture, industry, environmental protection, etc.)
has been managed separately, with limited
coordination between sectors. This approach leads to
fragmented and uncoordinated development of water
resources. Many uses of water have spill over effects
on other uses and sometimes have unintended social
and environmental consequences. This is especially
true for watersheds where water and land practices
upstream have a direct impact on the quantity and
quality of water downstream. As water becomes
scarcer, it becomes increasingly inefficient to manage
water without acknowledging the interdependence
between institutions, sectors, and between geographic
areas (Xie 2006).
The concept of integrated water resource
management has been a necessity for a long time and
is growing according to current and future
developments (MERLA et al. 2005). The United
Nations has tried to encourage the development of
water resource management that can be carried out in
an integrated manner between watersheds and
between regions since 1977 through the integrated
water resources management (IWRM) program.
Since 1992 the IWRM concept has begun to be
massively adapted to almost all countries in the world
with the common goal of achieving equitable access
to water use, which was marked by the existence of a
global water partnership (GWP) program in 1996.
The main mission of GWP is a process that promotes
the coordinated development of water, land and
related resources to maximize economic outcomes
and social welfare in a fair and sustainable manner.
and maintenance and evaluation and monitoring
(Durán-Sánchez, lvarez-García, and del Río-Rama
2018).
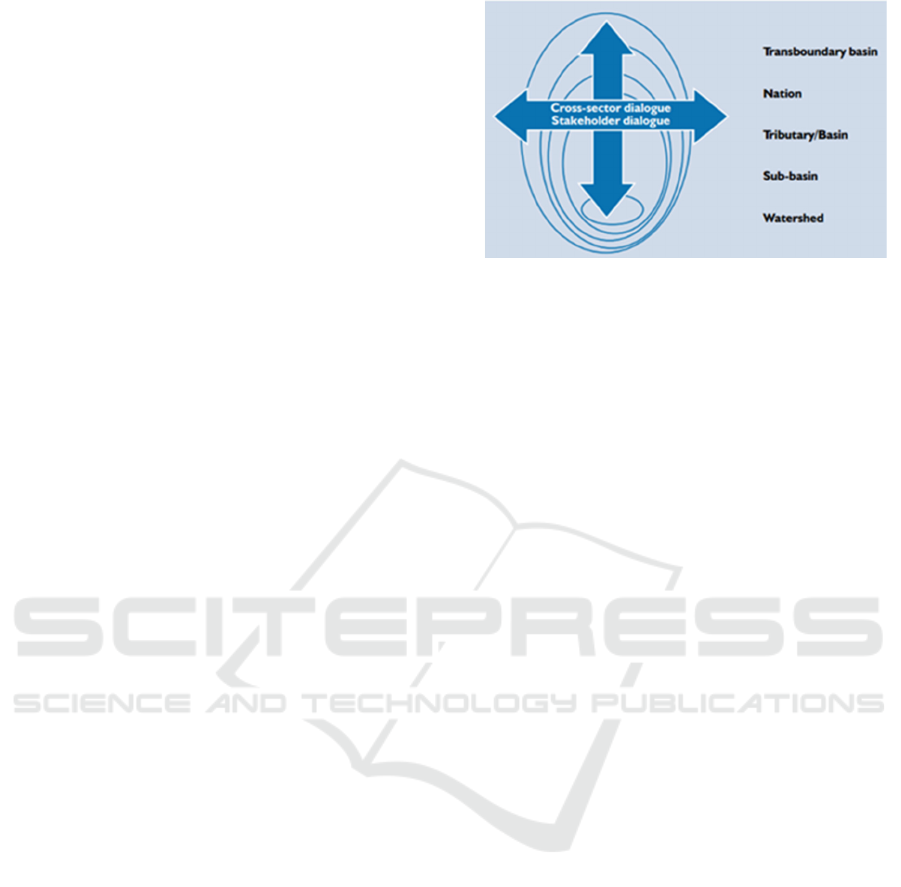
In relation to the concept of integration of water
resources management, it is necessary to carry out
cross-sectoral and cross-stakeholder coordination
which includes integration between watersheds,
regions/countries, and between sub-watersheds.
Experience has repeatedly shown that successful
IWRM demands vertical integration across levels,
from local to cross-border, as well as horizontal
integration across sectors at all levels. With cross-
sectoral dialogue, it is hoped that the concept of
integration with the principle of one river one
management will emerge, as shown in Figure 2
below: (Clausen and Smith 2015).
Figure 2: Concept of Integration in Watershed-Based
Natural Resources Management (Clausen and Smith,
2015).
2.2 Water Potential
Water potential is the amount of water that exists in
nature that has not been utilized. The water potential
is on the ground surface and below the ground surface
(Cole 2012). Water potential is analysed by
converting rain into water potential and then
juxtaposed with empirical measurements.
2.3 Water Availability
Availability of water is water that can be used directly
through infrastructure buildings that have been
developed such as reservoirs, weirs and pipelines (Lu
2007).
2.4 Water Needs
2.4.1 Clean Water Usage Pattern
The use of clean water in an area will never be the
same as in other areas due to the characteristics
possessed by the area concerned. The pattern of clean
water usage is largely determined by climate,
population characteristics, environmental issues,
industry and trade, fees for water, city size and water
conservation needs. (Asian Development Bank
2016).
2.4.2 Climate
The pattern of water use for household activities such
as bathing, washing, watering the garden, air
conditioning, and other activities will be greater for
areas with warm and dry climates than in areas with
humid climates. In areas with very cold climates,
water may be wasted in the taps to prevent the
freezing of clean water pipes (Vairavamoorthy 2007).
Integrated Clean Water Service Management in Klungkung Regency (Mainland) with Downstream River Utilization
603

2.4.3 Population Characteristics
Water use will be affected by the economic status of
the water users as well as the size of the city. The
water demand for small cities with low standard
housing ranges from 90 to 150 litres/person/day,
while for large and modern cities the use of clean
water can reach 600 litres/person/day. The higher the
welfare, the more complete the household appliances
which result in the greater the need for water
(Widhiyastuti, Daerobi, and Samudro 2017).
2.5 Instantaneous Discharge
Instantaneous discharge measurements are carried
out to determine the amount of water flowing in a
certain time unit. Measurement of instantaneous
discharge is carried out using a tool in the form of a
Current Meter to get the value of water velocity. This
water velocity value is calculated on several flow
paths at several water depths (Twort 2003).
2.6 Population Projection
The fulfilment of domestic water needs is calculated
based on the use of water by the population so it is
necessary to make a projection of the existing
population. Projection of the population can be done
by several methods which are determined based on
the characteristics of the population. The method of
determining the population can be done using
arithmetic, geometric and exponential methods (Fang
et al. 2014).
2.7 Clean Water Supply Strategy
The clean water supply strategy is a way of providing
clean water which has explained the potential, water
availability, water needs, water balance, and water
supply schemes in the future (Baldwin and Hamstead
2014).
3 RESEARCH METHOD
The research method uses quantitative analysis by
calculating the availability of existing water
compared to water needs and solutions for meeting
water in the future with fulfilment from various
sources. Primary data is obtained by direct
measurement and secondary data is obtained from the
relevant agencies.
3.1 Research Design
The research was conducted by collecting both
primary and secondary data from related agencies
such as PDAM Klungkung Regency, Bali Penida
River Council, Balinese traditional water user
organizations (Subak), water user communities, and
other parties.
3.2 Advanced Data Collection
This follow-up data collection includes field surveys,
data collection, especially from factual field
conditions. Further data collection includes PDAM
Klungkung data collection, data collection for clean
water management infrastructure, and measurement
of deviant discharge in several rivers.
3.3 Analysis
The analysis carried out is a quantitative analysis
consisting of population projection analysis, water
demand analysis, analysis of water services by
PDAM and analysis of the fulfilment of clean water
needs. The stages of the research in more detail can
be seen in Figure 3:
Figure 3: Research flowchart.
4 RESULTS AND DISCUSSION
4.1 Projected Population
Based on the analysis carried out, the population in
the mainland of Klungkung Regency in a row for
iCAST-ES 2022 - International Conference on Applied Science and Technology on Engineering Science
604
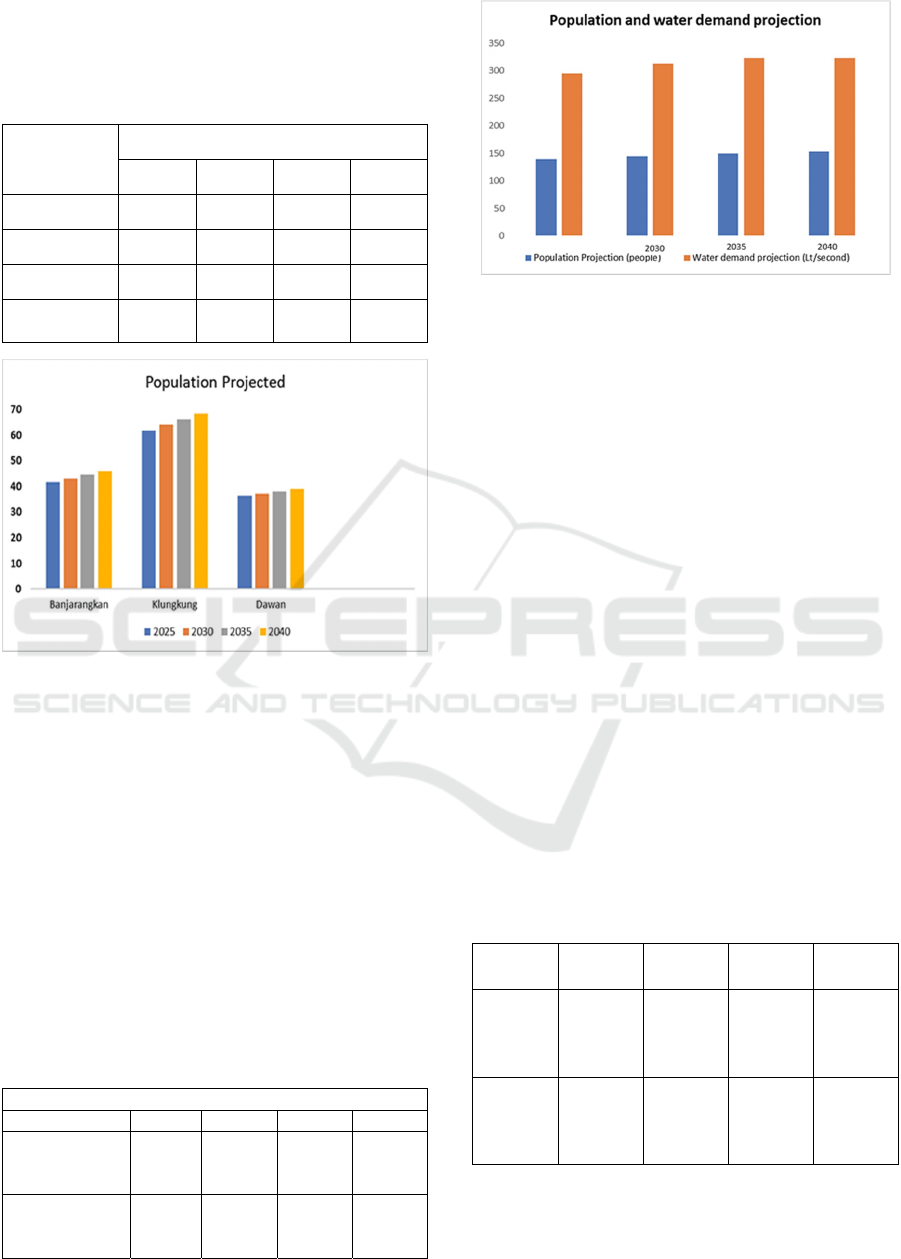
2025, 2030, 2035, and 2040 as shown in Table 1 and
Figure 4 below:
Table 1: Population Projection of Klungkung Regency
(mainland).
Sub District
Year
2025 2030 2035 2040
Banjarangkan 41,641 43,102 44,563 46,024
Klungkung 61,841 64,002 66,163 68,324
Dawan 36,181 37,142 38,103 39,064
Klungkung
Regency
139,663 144,246 148,829 153,412
Figure 4: Projected population growth.
4.2 Water Requirement
The water demand in Klungkung Mainland, which
covers Banjarangkan, Dawan and Klungkung sub-
districts, is 332.40 liters/second. The sub-district that
needs the most water is Klungkung District, while the
one that needs the least water is Dawan District. At
peak hours, Klungkung Mainland requires 668.95
litres of water/second. The maximum day water needs
to reach 128.43 liters/second. Water needs in all sub-
districts in Klungkung Regency are around 130
litres/person/day. The water demand in Klungkung
Regency is shown in table 2 and the figure 5:
Table 2: Recap of Total Clean Water Needs of Klungkung
Regency (Mainland).
Klungkung (land)
Year 2025 2030 2035 2040
Population
Projection
(people)
139,66 144,25 148,83 153,41
Water demand
projection
(Lt/second)
294,76 312,53 322,47 322,40
Figure 5: Water demand projection.
4.3 Water Potential of Klungkung
Regency
Klungkung Regency has 3 rivers that have the
potential to be utilized. The river that has the lowest
capacity is the Cau River with a capacity of 30.70
liters/second. The river that has the largest capacity is
the Jinah River with a capacity of 674.45
liters/second. In addition to the three rivers,
Klungkung Regency is also traversed by the Unda
River which has a capacity of more than 1000
liters/second and originates in Karangasem Regency.
The utilization of Unda River water can be carried out
downstream by utilizing the remaining capacity after
utilization for irrigation.
4.4 Water Availability
PDAM production in Klungkung Mainland currently
has a capacity of 115.3 liters/second, which is smaller
than the demand in 2025 of 294.76 liters/second. This
gap will become even greater in 2030, 2035, and 2040
as shown in Table 3 and Figure 6:
Table 3: Comparison between Water Demand and
Availability.
2025 2030 2035 2040
Demand
(Liter/
second)
294,76 312,53 322,47 332,40
Supply
(Liter/
second)
115,30 115,30 115,30 155,30
Integrated Clean Water Service Management in Klungkung Regency (Mainland) with Downstream River Utilization
605
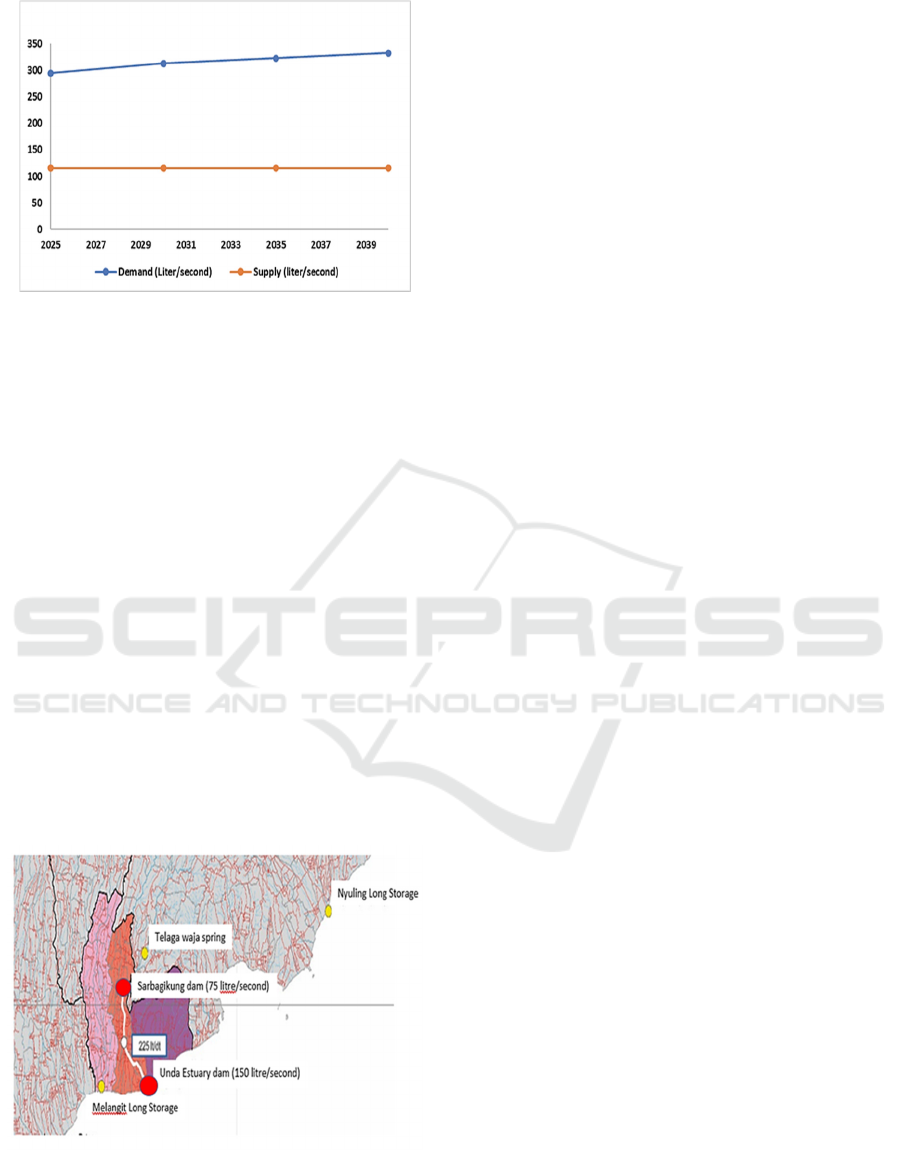
Figure 6: Comparison between water demand and supply in
Klungkung Regency (mainland).
4.5 Integrated Water Resource
Management
To meet the water needs of Klungkung Regency
(mainland) in the future, this is done by utilizing
existing sources in Klungkung Regency or by
utilizing other sources in the surrounding Regency,
namely in Gianyar Regency in the west (through the
Melangit long storage scheme) or Karangasem
Regency in the North (Telaga Waja springs and
Nyuling Long Storage). Sources in Klungkung
Regency are carried out by utilizing the capacity of
the Sarbagikung Dam development on the Unda river
located in Akah village which is allocated 75
liters/second and through the Unda River Estuary
Reservoir construction scheme of 150 liters/second.
If this scheme can be implemented, by 2040 there is
no need to ask for water from Karangasem and
Gianyar Regencies, this scheme is as shown in Figure
7:
Figure 7: Integrated clean water service development
strategy.
Apart from the Sarbagikung dam and the Muara Unda
reservoir, there are also several rivers with potential
for water development including: Cau River with a
capacity of 30.70 liters/second, the Jinah River with a
capacity of 674.45 liters/second and the Unda River
which has a capacity of more than 1000 liters/second.
5 CONCLUSION
Based on the results of the analysis, the water supply
is carried out by Klungkung water company with a
discharge of 115.30 liters/second which is smaller
than the demand in 2025 of 294.76 liters/second. This
gap will become even greater in 2030 (312.53
liters/second), 2035 (322.47 liters/second), and 2040
(332.40 liters/second). To meet the water needs of
Klungkung Regency (mainland) in the future, this is
done by utilizing existing sources in Klungkung
Regency or by utilizing other sources in the
surrounding Regency.
Sources in Klungkung Regency are carried out by
utilizing the capacity of the Sarbagikung Dam
development on the Unda river located in Akah
village which is allocated 75 liters/second and
through the Unda River Estuary Reservoir
construction scheme of 150 liters/second.
The water potential that can be developed comes
from river water downstream which is the rest of
irrigation water. There are three rivers that have
potential for water use, namely the Cau River with a
capacity of 30.70 liters/second, the Jinah River with a
capacity of 674.45 liters/second and the Unda River
which has a capacity of more than 1000 liters/second.
ACKNOWLEDGMENT
On this occasion, the authors would like to thank
PDAM Klungkug Regency, Bali Penida River
Council, and all parties who have assisted in
completing the research.
REFERENCES
Asian Development Bank. 2016. Asian Development Bank
Indonesia Country Water Assessment Indonesia
Country Water Assessment. www.adb.org.
Baldwin, Claudia, and Mark Hamstead. 2014. “Integrated
Water Resource Planning.” Integrated Water Resource
Planning.
iCAST-ES 2022 - International Conference on Applied Science and Technology on Engineering Science
606

BARI Daerah Bali. 2020. Masterplan Penyediaan Air
Bersih Di Provinsi Bali. Denpasar: Badan Riset dan
Inovasi Daerah Bali.
Clausen, Torkil Jønch, and Mark Smith. 2015. “Integrated
Water Resource Management : A New Way Forward
Mark Smith Governor, World Water Council Member
of the World Water Council Task Force on IWRM
Director-Global Water Programme, International
Union for Conservation of Nature (IUCN) Chair of the
World.” World Water Council. http://www.worldwater
council.org/sites/default/files/2017-10/7th_world_wate
r_forum_-_Daegu-Gyeongbuk_-_Republic_of_Korea_
-_Integrated_Water_Resource_Management_0.pdf.
Cole, Stroma. 2012. “A Political Ecology of Water Equity
and Tourism. A Case Study From Bali.” Annals of
Tourism Research 39(2): 1221–41.
Durán-Sánchez, Amador, José Álvarez-García, and María
de la Cruz del Río-Rama. 2018. “Sustainable Water
Resources Management: A Bibliometric Overview.”
Water (Switzerland) 10(9).
Fang, Hong Bin, Tie Song Hu, Xiang Zeng, and Feng Yan
Wu. 2014. “Simulation-Optimization Model of
Reservoir Operation Based on Target Storage Curves.”
Water Science and Engineering 7(4): 433–45.
http://dx.doi.org/10.3882/j.issn.1674-
2370.2014.04.008.
Fulazzaky, Mohamad Ali. 2014. “Challenges of Integrated
Water Resources Management in Indonesia.” Water
(Switzerland) 6(7): 2000–2020.
Lu, Tingyi. 2007. “Research of Domestic Water
Consumption : A Field Study in Harbin , China By.” A
research project report submitted in partial fulfilment
of the requirements for the award of the degree of
Master of Science of Loughborough University
(September): 1–89. http://www.switchurban
water.eu/outputs/pdfs/W3-
1_GEN_PHD_Research_of_domestic_water_consump
tion_-_a_field_study_in_Harbin_China.pdf.
MERLA, Andrea et al. 2005. Strategic Action Program for
the Integrated Management of the Pantanal and the
Upper Paraguay River Basin Implementation of
Integrated River Basin Management Practices in the
Pantanal and Upper Paraguay River Basin
ANA/GEF/UNEP/OAS Strategic Action Program for
the Integrated Management of the Pantanal and the
Upper Paraguay River Basin.
Norken, I Nyoman. 2003. “Pengembangan dan Pengelolaan
SDA Secara Terpadu dan Berkelanjutan.” In Denpasar:
Prosiding Seminar Nasional HATHI, 2003.
Penida, Balai Wilayah Sungai Bali. 2020. Penyediaan Air
Baku di Wilayah Sungai Bali Penida Dewnpasar.
Twort. 2003. Water Supply. 5th ed. IWA.
Vairavamoorthy, K. 2007. “Challenges For Urban Water
Supply.” Urban Water (June).
Widhiyastuti, Rahmah Risqi, Akhmad Daerobi, and Bhimo
Rizky Samudro. 2017. “Community-Based Water
Management: An Institutional Study In PAMDes
Sumberagung, Bantul, DIY.” Eko-Regional Jurnal
Pengembangan Ekonomi Wilayah 12(2): 37–42.
Xie, Mei. 2006. “Integrated Water Resources Management
(IWRM) – Introduction to Principles and Practices 1.”
Water: 1–15.
Integrated Clean Water Service Management in Klungkung Regency (Mainland) with Downstream River Utilization
607
