
Solar Energy Data for Three Consecutive Days
at Bakas Tourist Village, Klungkung, Bali
Anak Agung Ngurah Gde Sapteka
a
, I Wayan Suasnawa
and Anak Agung Ngurah Made Narottama
b
Department of Electrical Engineering, Politeknik Negeri Bali, Badung, Indonesia
Keywords: Bakas, Klungkung, Bali, Solar Irradiance, Solar Irradiation, Solar Power Plant.
Abstract: Bakas is a tourist village in Banjarangkan District, Klungkung Regency, Bali Province, Indonesia. Research
on solar irradiance in Bakas Village was conducted to determine the amount of solar energy per unit area (per
unit area) that arrives at the surface at a certain angle measured in watts per square meter, W/m
2
. This study
collected solar irradiance data for horizontal surfaces from June to July 2022. The solar irradiance value is
then integrated into the unit of time to obtain the solar irradiation value. We analyze the sum and average
value of three consecutive days. The sum value of solar energy at Bakas Village in July 2022 appears more
scattered with lower values than in June 2022. The average value of solar energy at Bakas Village in July
2022 also appears to fluctuate with lower values than in June 2022.
1 INTRODUCTION
Due to the geographical aspect, as modeled by
Tambunan et al., the monthly maximum solar
irradiance was in December 2014. In contrast, the
maximum solar daily irradiance was on December 17
for Java and Bali islands. It is based on the National
Aeronautics and Space Administration (NASA)
predictions of the global energy resource (POWER)
database (Tambunan et al., 2020).
Solar PV is planned to be the most dominant
technology in terms of installed capacity, with 45
GWp in 2050, which would be 10.1% of the total and
26.8% of renewable capacity. For this, the roofs of up
to 30% of government buildings and up to 25% of
developed residential housing should be occupied by
solar PV (Langer et al., 2021).
For the installed capacities, there are two open
parameters in the basic system, i.e., the installed solar
panel capacity and the installed storage capacity.
These two parameters depend on each other. The
larger the installed solar panel capacity, the smaller
the storage capacity, and vice versa. There is a system
configuration for which the solar panel capacity is at
a
https://orcid.org/0000-0001-7919-1847
b
https://orcid.org/0000-0002-8239-0422
its minimum at the cost of large storage (Günther,
2018).
Sianturi stated that Indonesia's annual average of
daily solar radiation in 2018 ranged from 3.0 to 5.6
kWh/m
2
. The highest potential is observed over the
southern part of Indonesia, particularly in Bali and
Nusa Tenggara islands (Sianturi, 2018).
A review of solar energy potential in Indonesia
based on the solar resource data is presented by
Fathoni et al. Estimation of solar resources in
Indonesia was done using solar radiation data from
NASA Surface Meteorology and Solar Energy (SSE).
Retscreen software was used for all of the
calculations in the study. It is found that the proposed
system can generate electricity annually, varying
from 0.46 GWh/year in Denpasar to 217 GWh/year in
Pontianak (Fathoni et al., 2014).
Another researcher, Saskara et al., stated that the
HOMER application simulation results show that the
energy potential in the two pilot projects is 3% and
39% greater than the actual energy. In addition, the
solar panel rooftop on both pilot projects has a 20°
slope solar panel, while the calculation results show
an optimal slope is 15° (Saskara et al., 2018).
Our previous research concluded that the 150-
Watt peak solar panel in Denpasar City, Bali has a
614
Sapteka, A., Suasnawa, I. and Narottama, A.
Solar Energy Data for Three Consecutive Days at Bakas Tourist Village, Klungkung, Bali.
DOI: 10.5220/0011857600003575
In Proceedings of the 5th International Conference on Applied Science and Technology on Engineering Science (iCAST-ES 2022), pages 614-617
ISBN: 978-989-758-619-4; ISSN: 2975-8246
Copyright © 2023 by SCITEPRESS – Science and Technology Publications, Lda. Under CC license (CC BY-NC-ND 4.0)
maximum received wattage of 0.76 kW/day in
October (Narottama et al., 2018). However, due to a
lack of ground observation, we observe the solar
energy potential in Bakas Village, Klungkung
Regency, Bali Province, Indonesia, from June to July
2022. The results of observations are then used as the
basis for forming a rooftop solar power plant.
2 METHODOLOGY
We collect the solar irradiation data at Bakas Village
(-8.52173360274 lat, 115.364125576 lon). The map
of Bakas Village is shown in Figure 1.
Figure 1: Map of Bakas Village.
The solar irradiation data was collected using
Lutron SPM-1116SD device from June to July 2022
on a minute basis. We put the device in a position not
blocked by buildings or trees at 6 meters from the
ground. Furthermore, we process the data to obtain
daily solar energy data. In this study, we analyze the
sum and average of three consecutive days of solar
energy at Bakas Tourism Village.
3 RESULT AND DISCUSSION
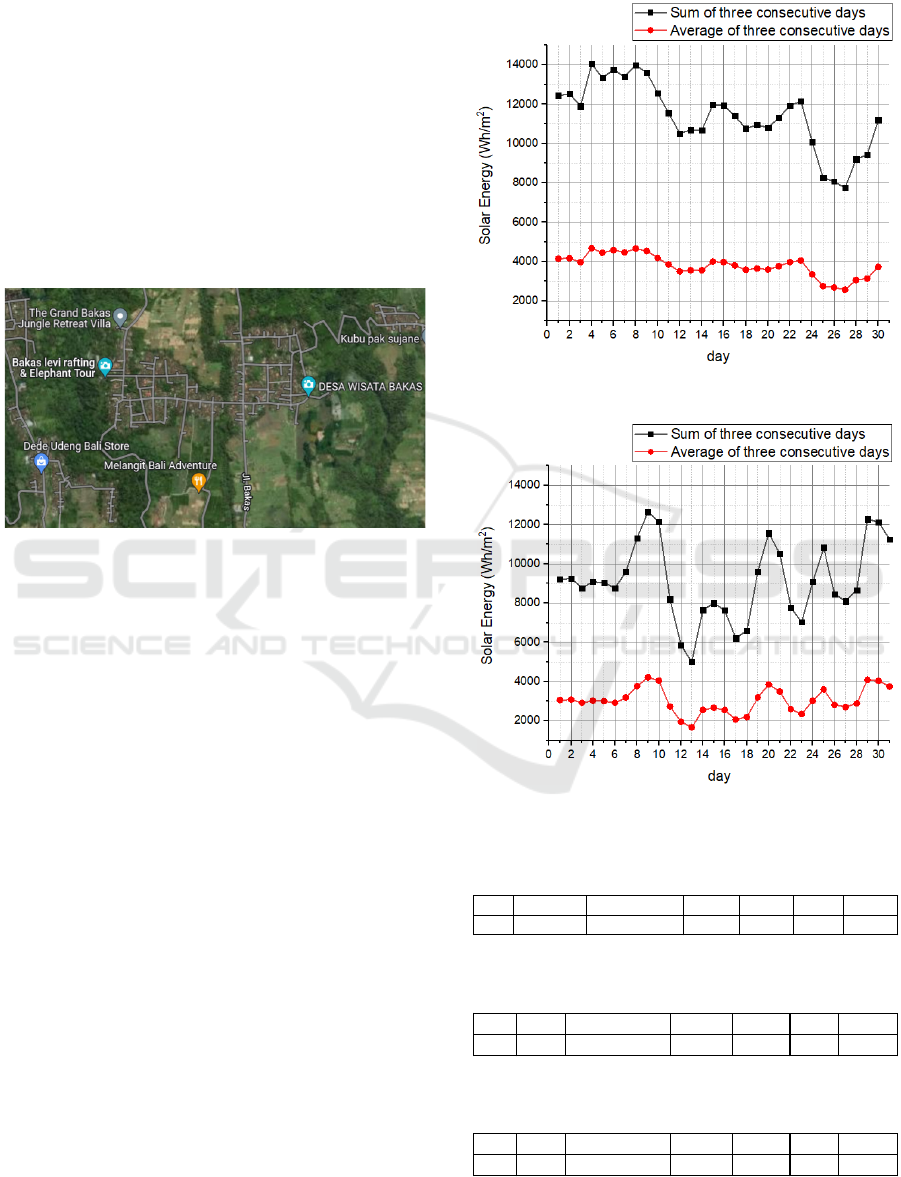
The solar energies at Bakas Village in June and July
2022 are shown in Figures 1 and 2. On June 2022, the
sum and average of solar energy for three consecutive
days have descriptive statistics as shown in Tables 1
and 2. Meanwhile, on July 2022, the sum and average
of solar energy for three consecutive days have
descriptive statistics as shown in Tables 3 and 4.
Tables 1 and 3 show that the standard deviation in
July is greater than in June. It shows that in July, the
sum value of solar energy for three consecutive days
is farther away from the mean or more spread out,
although it has a lower maximum and minimum value
than June 2022. The mean value in June is 11407.69
Wh/m
2
, while in July is 9104.79 Wh/m
2
. Bakas
Village gets a higher sum value of solar energy for
three consecutive days in June.
Figure 2: Solar energy at Bakas Village on June 2022.
Figure 3: Solar energy at Bakas Village on July 2022.
Table 1: Sum of solar energy for three consecutive days on
June 2022.
Table 2: Average solar energy for three consecutive days
on June 2022.
Table 3: Sum of solar energy for three consecutive days on
July 2022.
N total Mean Standard Deviation Sum Minimum Median Maximum
30 11407,69 1708,01 342230,72 7742,04 11485,67 14037,39
N total M ean Standard Deviation Sum M inimum M edian M aximum
30 3802,56 569,34 114076,91 2580,68 3828,56 4679,13
N total M ean Standard Deviation Sum M inimum M edian M aximum
31 9104,79 1984,65 282248,46 5017,42 9039,91 12645,52
Solar Energy Data for Three Consecutive Days at Bakas Tourist Village, Klungkung, Bali
615
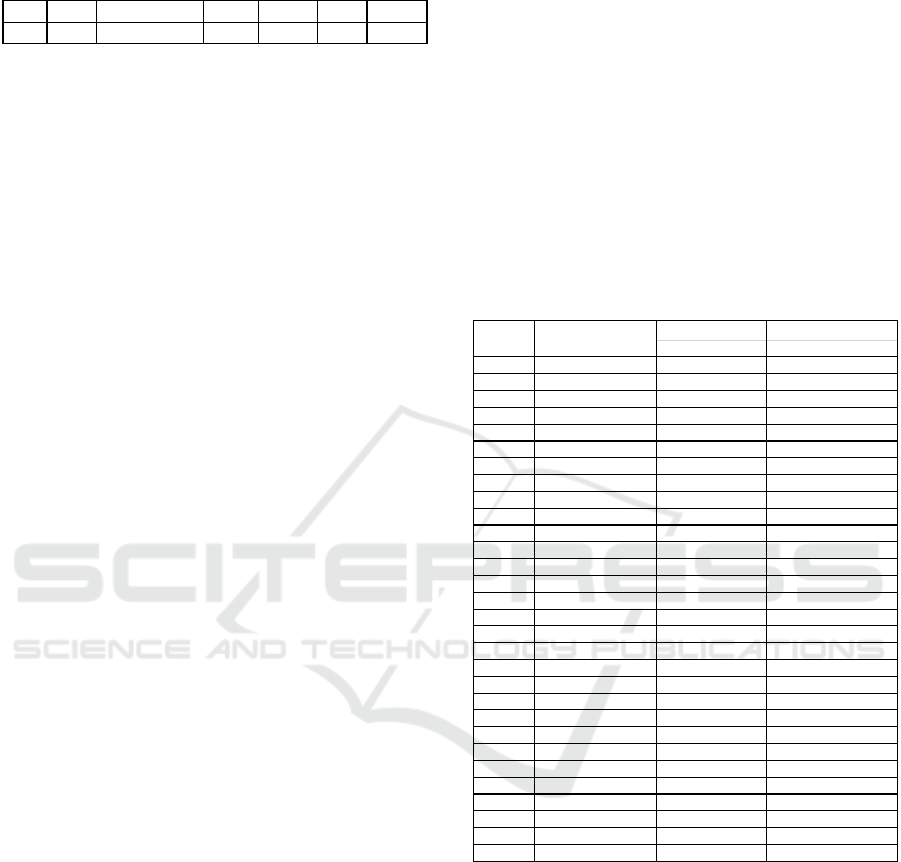
Table 4: Average solar energy for three consecutive days
on July 2022.
Tables 2 and 4 also know that the standard
deviation in July is greater than in June. It shows that
in July, the average value of solar energy for three
consecutive days is farther away from the mean or
more spread out, although it has a lower maximum
and minimum value than June 2022. The mean value
in June is 3802.56 Wh/m
2
, while in July is 3034.93
Wh/m
2
. It means Bakas Village gets a higher average
value of solar energy for three consecutive days in
June.
4 CONCLUSIONS
The sum value of solar energy at Bakas Village in
July 2022 appears more scattered than in June. Also,
it has a sum of solar energy with lower values than
June 2022. The average value of solar energy at
Bakas Village in July 2022 also appears more
fluctuated than in June. Also, it has average solar
energy with lower values than June 2022.
ACKNOWLEDGEMENTS
The researcher would like to thank the leader of the
traditional institution of Bakas village, as well as the
Center for Research and Community Service,
Politeknik Negeri Bali, for the support and cash in our
research.
REFERENCES
Fathoni, A. M., Utama, N. A., & Kristianto, M. A. (2014).
A Technical and Economic Potential of Solar Energy
Application with Feed-in Tariff Policy in Indonesia.
Procedia Environmental Sciences, 20, 89–96.
Günther, M. (2018). Challenges of a 100% renewable
energy supply in the Java-Bali grid. International
Journal of Technology, 9(2), 257–266.
Langer, J., Quist, J., & Blok, K. (2021). Review of
renewable energy potentials in Indonesia and their
contribution to a 100% renewable electricity system. In
Energies (Vol. 14, Issue 21). MDPI.
Narottama, A. A. N. M., Amerta Yasa, K., Suwardana, I.
W., Sapteka, A. A. N. G., & Priambodo, P. S. (2018).
Analysis of AC and DC Lighting Systems with 150-
Watt Peak Solar Panel in Denpasar Based on NASA
Data. Journal of Physics: Conference Series, 953(1).
Saskara, P. E., Kumara, I. N. S., & Sukerayasa, W. (2018).
Comparison of PV Rooftop Energy Production at
Denpasar City Office Building.
Sianturi, Y. C. U. (2018). Estimating the Solar Energy
Potential over Indonesia Region Using Daily Sunshine
Duration. International Journal of Science and
Research.
Tambunan, H. B., Hakam, D. F., Prahastono, I.,
Pharmatrisanti, A., Purnomoadi, A. P., Aisyah, S.,
Wicakson, Y., & Sandy, I. G. R. (2020). The challenges
and opportunities of renewable energy source (RES)
penetration in Indonesia: Case study of Java-Bali power
system. Energies, 13(22).
APPENDIX
N total M ean Standard Deviation Sum Minimum Median M aximum
31 3034,93 661,55 94082,82 1672,47 3013,30 4215,17
SumofSolarEnergy AverageofSolarEnergy
of3Cons.Days of3Cons.Days
01‐06‐2022 2773,218333 12439,26167 2773,218333
02‐06‐2022 4897,841667 12531,64333 3835,53
03‐06‐2022 4235,551667 11906,61167 3968,870556
04‐06‐2022 4904 14037,39333 4679,131111
05‐06‐2022 4201,885 13341,43667 4447,145556
06‐06‐2022 4635,275 13741,16 4580,386667
07‐06‐2022 4557,143333 13394,30333 4464,767778
08‐06‐2022 4785,328333 13977,74667 4659,248889
09‐06‐2022 4253,998333 13596,47 4532,156667
10‐06‐2022 3525,093333 12564,42 4188,14
11‐06‐2022 3783,8945 11562,98617 3854,328722
12‐06‐2022 3205,116667 10514,1045 3504,7015
13‐06‐2022 3695,3675 10684,37867 3561,459556
14‐06‐2022 3774,006667 10674,49083 3558,163611
15‐06‐2022 4524,125 11993,49917 3997,833056
16‐06‐2022 3639,786667 11937,91833 3979,306111
17‐06‐2022 3244,438333 11408,35 3802,783333
18‐06‐2022 3874,881667 10759,10667 3586,368889
19‐06‐2022 3830,995 10950,315 3650,105
20‐06‐2022 3094,323333 10800,2 3600,066667
21‐06‐2022 4390,271667 11315,59 3771,863333
22‐06‐2022 4444,9175 11929,5125 3976,504167
23‐06‐2022 3324,263333 12159,4525 4053,150833
24‐06‐2022 2315,436667 10084,6175 3361,539167
25‐06‐2022 2637,553333 8277,253333 2759,084444
26‐06‐2022 3121,246667 8074,236667 2691,412222
27‐06‐2022 1983,235 7742,035 2580,678333
28‐06‐2022 4107,196667 9211,678333 3070,559444
29‐06‐2022 3335,963333 9426,395 3142,131667
30‐06‐2022 3750,988333 11194,14833 3731,382778
Date
SolarEnergy(Wh/m
2
)
iCAST-ES 2022 - International Conference on Applied Science and Technology on Engineering Science
616

SumofSolarEnergy AverageofSolarEnergy
of3Cons.Days of3Cons.Days
01‐07‐2022 2133,405 9220,356667 3073,452222
02‐07‐2022 3377,235 9261,628333 3087,209444
03‐07‐2022 3246,038333 8756,678333 2918,892778
04‐07‐2022 2470,781667 9094,055 3031,351667
05‐07‐2022 3323,088333 9039,908333 3013,302778
06‐07‐2022 2966,805 8760,675 2920,225
07‐07‐2022 3297,73 9587,623333 3195,874444
08‐07‐2022 5059,615833 11324,15083 3774,716944
09‐07‐2022 4288,175 12645,52083 4215,173611
10‐07‐2022 2802,135833 12149,92667 4049,975556
11‐07‐2022 1111,718333 8202,029167 2734,009722
12‐07‐2022 1936,045833 5849,9 1949,966667
13‐07‐2022 1969,651667 5017,415833 1672,471944
14‐07‐2022 3758,601667 7664,299167 2554,766389
15‐07‐2022 2262,301667 7990,555 2663,518333
16‐07‐2022 1616,403333 7637,306667 2545,768889
17‐07‐2022 2330,261667 6208,966667 2069,655556
18‐07‐2022 2648,101667 6594,766667 2198,255556
19‐07‐2022 4613,73 9592,093333 3197,364444
20‐07‐2022 4308,346667 11570,17833 3856,726111
21‐07‐2022 1578,743333 10500,82 3500,273333
22‐07‐2022 1897,083333 7784,173333 2594,724444
23‐07‐2022 3558,976667 7034,803333 2344,934444
24‐07‐2022 3625,881667 9081,941667 3027,313889
25‐07‐2022 3634,92 10819,77833 3606,592778
26‐07‐2022 1186,633333 8447,435 2815,811667
27‐07‐2022 3277,241667 8098,795 2699,598333
28‐07‐2022 4199,003333 8662,878333 2887,626111
29‐07‐2022 4800,731667 12276,97667 4092,325556
30‐07‐2022 3120,066667 12119,80167 4039,933889
31‐07‐2022 3332,221667 11253,02 3751,006667
Date
SolarEnergy(Wh/m
2
)
Solar Energy Data for Three Consecutive Days at Bakas Tourist Village, Klungkung, Bali
617
