
The Effect of Variation of Catalyst Ratio on Polyester Resin on
Shrinkage and Ability to Absorb Mechanical Load on MiFUS® Case
Riona Ihsan Media
1a
, Roni Kusnowo
2b
, Yogi Muldani Hendrawan
3c
and Hafez Trimukti Ali Musa
3
1
Department of Design Engineering, Politeknik Manufaktur Bandung, Bandung, Indonesia
2
Department of Foundry Engineering, Politeknik Manufaktur Bandung, Bandung, Indonesia
3
Department of Manufacturing Engineering, Politeknik Manufaktur Bandung, Bandung, Indonesia
hafez.trimukti@gmail.com
Keywords: Rapid Tooling, Resin Epoxy, Resin Polyester, 3D Scan, Injection Molding.
Abstract: This study discusses the implementation of rapid tooling in the manufacture of MiFUS casing to find out what
happened and the optimal catalyst. The rapid tooling method is used because standard injection plastic is less
efficient for making low-scale products. Rapid tooling applications are realized by using concrete epoxy resin
as a product and polyester resin as a product. The use of polyester resin in products usually requires booster
because the material is well known and has a high uniqueness of 5-12%. The solution offered is to adjust the
ratio of the polyester resin in order to get the strength to receive optimal and minimum mechanical loads. The
shrinkage that occurs will be used as a design rule or a rule in increasing the size of each catalyst ratio so that
the size obtained is more precise than the function of the product can be achieved. The method begins with
the process of planning, manufacturing, and testing. The result of this research is for the tensile test, the
optimal catalyst ratio is 2.5:100 at 41 MPa while for the flexural test at 3: 100 it is 71 MPa. To distinguish the
minimum is at a catalyst ratio of 1.5: 100.
1 INTRODUCTION
Among the additive manufacturing processes based
on photopolymerization of liquid resins, RP (Rapid
Prototyping) technology using SLA is the oldest and
most popular. The importance of different operation
areas and industries can be predicted from Figure 1.
Driven by the expanding industrial concern of
LM, a variety of technologies - all summed up under
the term RP - have acquired (Aceto et. al., 2019).
Diverse methods to classifying the diversity of
technologies have been reported in the literature. In
addition to the individual application domains (Figure
1(b)), RP processes can also be classified according
to the initial physical state of the material being
treated and the physical or chemical transformations
underlying integrating each layer (Abdulhameed et.
al., 2019). Nowadays, RP processes are used not only
to visualize design ideas (idea modeling), but also to
a
https://orcid.org/0000-0003-1492-1487
b
https://orcid.org/0000-0002-7632-3434
c
https://orcid.org/0000-0004-4774-4966
manufacture molds and tools in rapid tooling (RT)
applications (Touri et. al., 2019). Furthermore,
additive and freeform layered manufacturing of 3D
models is no longer limited to the visualization of
prototype designs in rapid prototyping (RP), but is
applied to the preparation of prototypes. and Rapid
Tooling (Modi, Y. K., and Sanadhya, S., 2018).
Rapid tooling is a process of prototyping in a short
time. Rapid tooling parts are produced rapidly to test
and validate them prior to tooling production,
especially in the plastic injection molding process
(Bagalkot, 2019).
Rapid tooling parts are a perfect solution for
testing and evaluating prototypes and producing
several hundred parts before actually going into full
production (Ahmed, N., 2019). Fast feed techniques
enable the creation of inserts such as cores, side cores
and part cavities. The whole manufacturing process
depends on the quick tool used; It is also possible to
674
Media, R., Kusnowo, R., Hendrawan, Y. and Musa, H.
The Effect of Variation of Catalyst Ratio on Polyester Resin on Shrinkage and Ability to Absorb Mechanical Load on MiFUS® Case.
DOI: 10.5220/0011862200003575
In Proceedings of the 5th International Conference on Applied Science and Technology on Engineering Science (iCAST-ES 2022), pages 674-682
ISBN: 978-989-758-619-4; ISSN: 2975-8246
Copyright © 2023 by SCITEPRESS – Science and Technology Publications, Lda. Under CC license (CC BY-NC-ND 4.0)
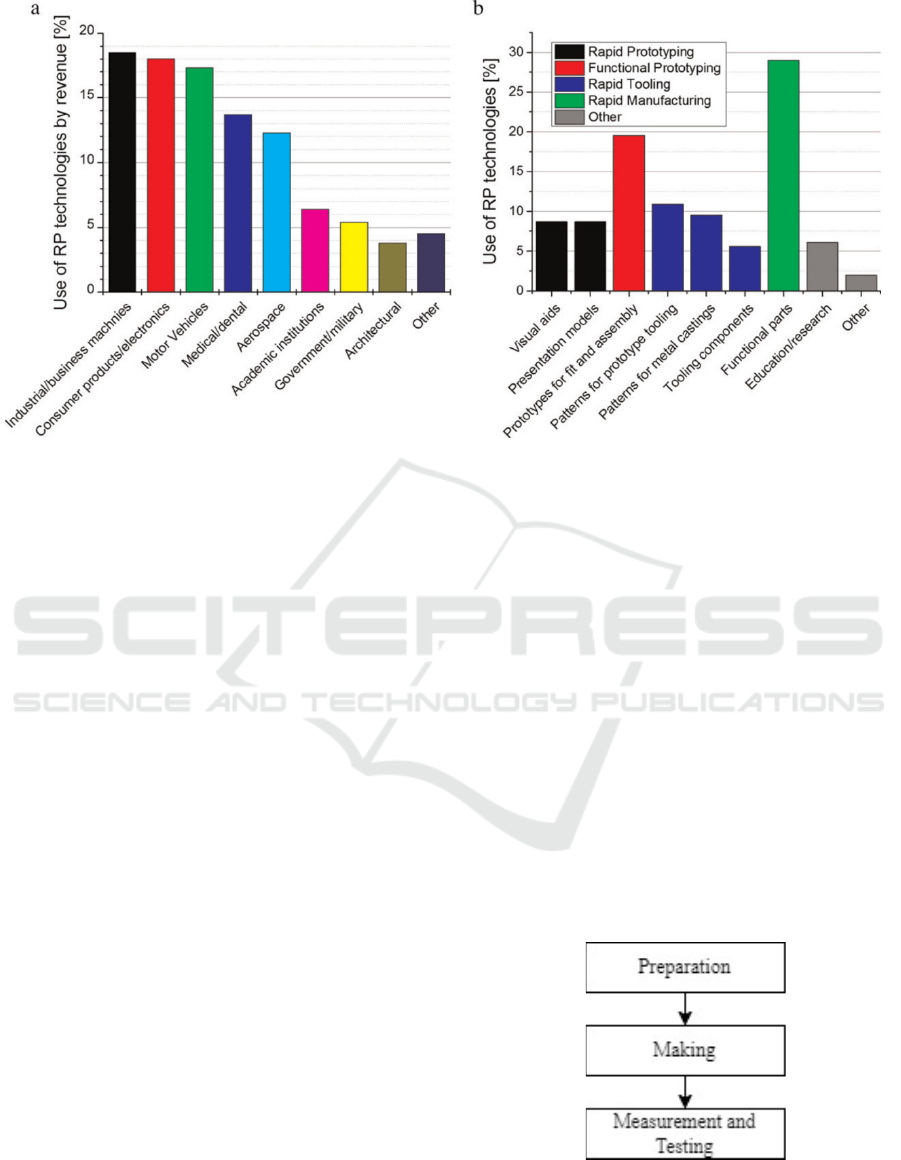
Figure 1: Market share relevance of RP technologies. Revenue earned is related to (a) industry and (b) application sectors.
produce parts through multiple mold cycles.
However, rapid tooling technology need to consider
many factors to get the most out of these benefits, as
they vary in size, consistency, technology, precision,
and materials (Zhou, L. Y., Fu, J., and He, Y., 2020).
Currently, many methods have been developed to
produce a product with the low quantity, the method
is commonly called Rapid Tooling (RT). The term RT
refers to the manufacture of tools that are made
quickly and cheaply, only now the definition of RT is
starting to develop into tools that refer to the age of
the RT itself (Barnhoorn et. al., 2015).
There are several types of Rapid Tooling, namely
RTV (Room-temperature Vulcanizing) Mold, Rapid
Aluminium Tools (RAT), CAFÉ Bridge Tool, and
Direct AIM Rapid Bridge Tool (Wolf et. al., 2018).
Of all the available rapid tooling methods, the RTV
Mold was chosen which was applied by changing the
core and cavity with epoxy resin and polyester resin
materials for the product.
It is just that the problem with the use of polyester
resin in the product is the size deviation caused by
shrinkage. Shrinkage in polyester resins ranges from
5% – 12% (Gao et. al., 2019). The shrinkage that
occurs is expected to be as minimal as possible so that
deviations in the size and function of the product can
be achieved.
In addition to shrinkage, the problem with RTV
molds with resin-based products is the need for
reinforcement in the form of fibers in the resin (Celik,
K., & Belli, S., 2015). With the addition of
reinforcement in the form of fiber, the product will
have better mechanical load-bearing strength. It is
just that the product to be made will not use fiber or
reinforcement so that the strength of the product will
be reduced. So that even without reinforcement, it is
expected that the strength to receive optimal
mechanical loads is obtained.
Although much research addressed obtaining a
good quality product with the optimal solution,
shrinkage has not yet been finished with the optimal
ratio. The solution given to this problem is to try to
adjust the catalyst ratio in the polyester resin to get
the optimal ratio. By adjusting the ratio of the catalyst
to the resin, it is hoped that the shrinkage and strength
to receive the most optimal mechanical load will be
obtained in order to provide a higher quality product
to the user.
2 METHODOLOGY
Figure 2: Research methodology.
The Effect of Variation of Catalyst Ratio on Polyester Resin on Shrinkage and Ability to Absorb Mechanical Load on MiFUS® Case
675
2.1 Preparation
2.1.1 Hypothesis
All scientific thought begins with a hypothesis or
initial guess. In this study, the author made a
hypothesis based on the literature which was further
validated through trials. The following is the
hypothesis in this research:
1. There is an effect of variations in the ratio of
catalysts in polyester resin to shrinkage.
2. The greater the ratio of the catalyst given, the
greater the shrinkage that occurs.
3. The greater the ratio of the catalyst given, the
greater the strength to receive the mechanical
load.
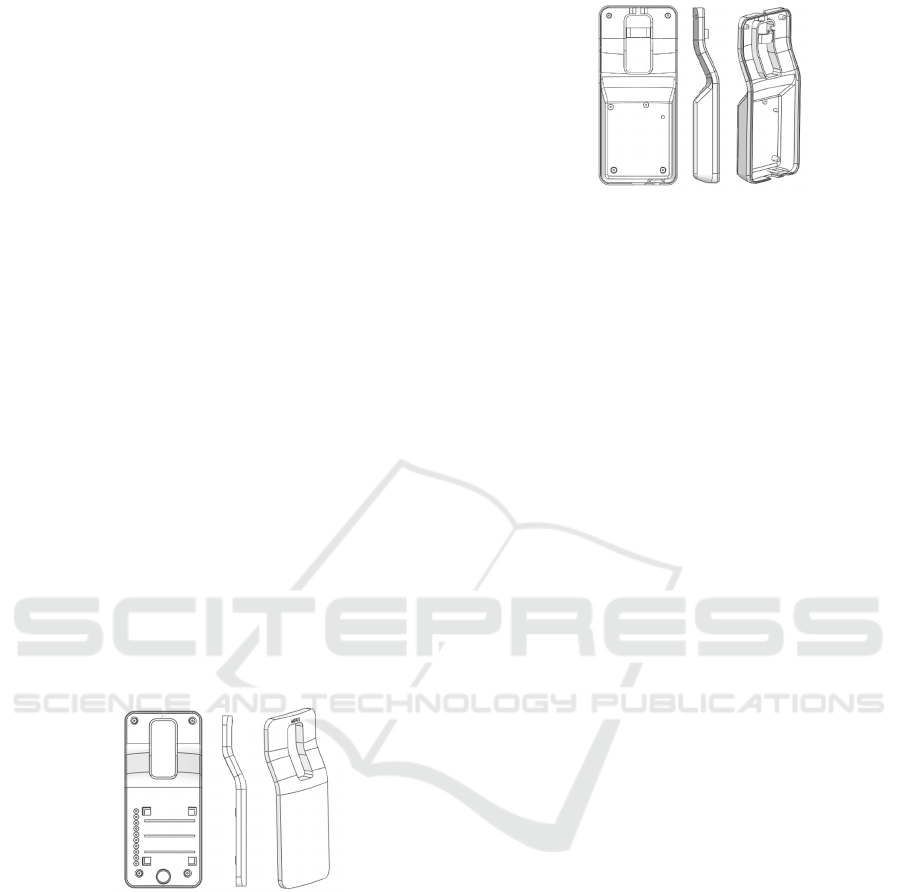
2.1.2 Products Identification
There are 4 products to be made, namely front and
rear MiFUS cases, tensile test samples, and flexural
test samples. For the tensile test the standard size used
is 572-2 while for the flexural test it is ASTM D790-
10.
The front case has several functions, namely as a
battery holder, indicator light holder, and buzzer
holder. In addition, the material of the product must
have heat resistance due to electrical components,
withstand impact loads, and be elastic enough to fulfil
the snap-fit function.
Figure 3: MiFUS front case.
This back-casing product has a function as a
holder for all electrical parts ranging from circuits,
micro-USB, and also sensors. In addition, the
function of this product is as a binder between the
front and back covers.
2.2 Making
Making includes making product masters using 3D
prints, making molds, and making products. The
following is a description of each manufacturing
process.
Figure 4: MiFUS back case.
2.2.1 Products Master Making
The product master is a prototype product that is used
as part of the positive mold. The manufacture of this
product master uses 3D Print technology with ABS
material. For the finishing process on the product to
smooth the surface, the sandpaper process is used for
the MiFUS casing product and vapor smoothing for
the tensile test and flexural test samples.
2.2.2 Mold Making
The molds are divided into 3, namely the molds for
the front MiFUS casing, the front, and the mechanical
load test sample products. It's just that the process is
the same, what makes the difference is the
manufacture of the holder for the MiFUS casing. This
is needed because the formation of the product is less
stable without a stand.
2.2.3 Product Making
Before starting the experiment, it must be determined
in advance the variation of the ratio of the catalyst to
the resin in order to know how many samples to
make. Based on research conducted by Ansari et. al.
(2020) on composites, the variation in the ratio of
catalysts to polyester resins is 0,5:100; 1:100; 2:100;
and 2,5:100 with each ratio made 3 samples. From the
3 samples, the best 1 was taken to be plotted in the
graph. In the end, it was concluded that the most
optimal ratio of all these variations was 2.5:100 and
the less good one was 0.5:100.
Because the mechanical test graph for each
sample shown in previous studies continues to rise,
the authors try to make slightly different variations.
This is intended to obtain a more optimal variation
and to know the limits of the use of a less than optimal
catalyst. Because the more catalyst, the longer the
product will dry and become sticky. Therefore, the
authors make variations in the ratio to 1,5:100; 2:100;
2.5:100; 3:100; 3,5:100.
Furthermore, these variations are presented in
tabular form in order to know the exact volume
iCAST-ES 2022 - International Conference on Applied Science and Technology on Engineering Science
676
composition between catalyst and resin for each test
product. The volumes in the table are obtained from
the SolidWorks software.
Table 1: Design of total resin volume of each specimen.
Products Volume (mL)
Front Casing 36
Back Casing 45
Tensile Test 10
Flexural Test 6
Total Volume 97 ≈ 100
So, the total resin volume required for 1
experimental batch of sample making is 100 mL.
Next is to calculate the volume of catalyst needed.
The following is a table showing the volume of resin
required for each ratio variation.
Table 2: Resin required for each batch.
Total
Volume
Catalyst required (Catalyst: Resin)
1,5:100 2:100 2,5:100 3:100 3,5:100
100 1,5 2 2,5 3 3.5
2.3 Measurement and Testing
Tests for products are generally divided into 2,
namely measurement of shrinkage with a 3D Scanner
and testing of mechanical loads. Specific shrinkage
measurements for MiFUS casing products so that
later these measurements can be used as a design
reference for materials using polyester resin. For
mechanical load testing, standard samples are made
whose dimensions have been adjusted to existing
standards.
2.3.1 Shrinkage Measurement Using 3D
Scanner
The 3D Scanner machine used for measurement is the
METRASCAN CREAFORM machine. The
advantage of this machine is that it can capture up to
800,000 points every second. Therefore, the
following are the specifications of the 3D Scanner
engine that will be used.
Measurement of depreciation using 3D Scanner
produces a product in the form of a point cloud. This
point cloud cannot be edited using ordinary CAD
software. The software used to help editing and 3D
Compare is Geomagic. The following are the stages
in using software for the 3D Compare process. No dot
should be included after the section title number.
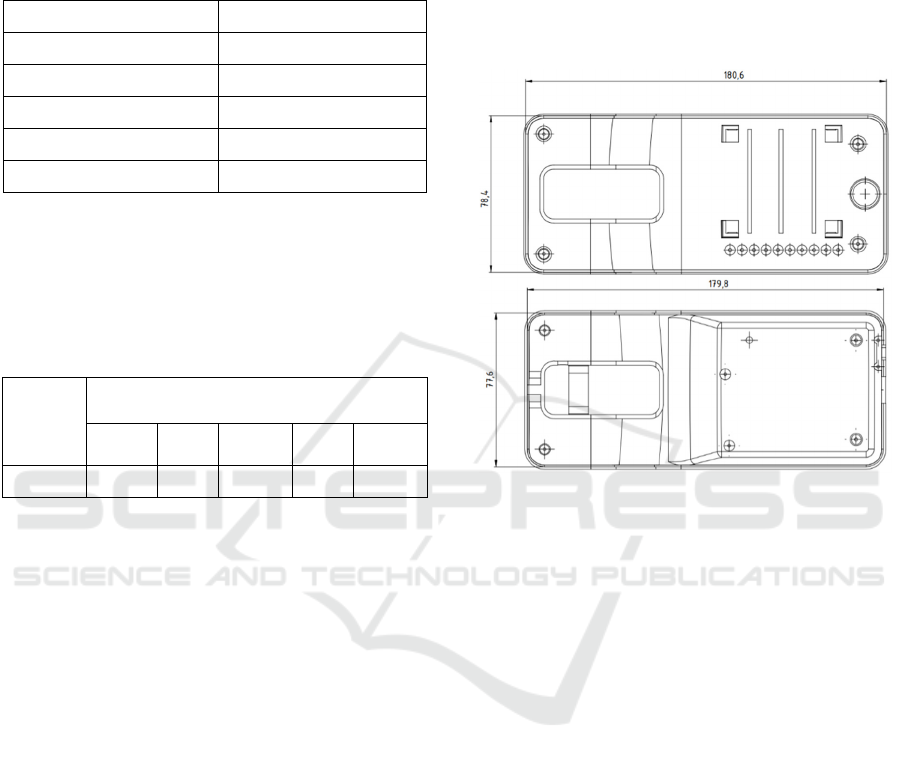
In addition, this measurement also determines the
dimensions that must be measured with a calliper.
This aims to determine the shrinkage in certain parts,
especially in pairs, in order to obtain parameters for
later design. The following are the dimensions that
must be measured with a calliper.
Figure 5: Dimension that will be measured.
2.3.2 Tensile Test and Flexural Test
The purpose of carrying out this flexural test is to
obtain material properties and find out how much
flexural load the product can withstand. It is hoped
that later it will be known whether the product can
fulfil the snap-fit function or not. As for the tensile
test, the goal is to get the tensile strength so that it is
expected to know how brittle the material is.
3 RESULTS AND DISCUSSION
3.1 Shrinkage Data Analysis
To collect depreciation data, two methods are used.
The first method is to measure using a digital calliper
with an accuracy of 0.01 mm and then see the size
deviation that occurs. The second method is to use a
3D Scan tool so that later a standard deviation is
obtained to represent the deviations that occur.
3.1.1 Manual Measurement
Manual measurement is done by determining the
dimensions to be measured first. After that it was
The Effect of Variation of Catalyst Ratio on Polyester Resin on Shrinkage and Ability to Absorb Mechanical Load on MiFUS® Case
677
measured 3 times and the results were averaged. In
addition, the number of samples measured was 15
pairs of product samples (front cover and back cover)
with 3 samples in each ratio variation.
The product that is the measurement reference is
the master product which is made to be negative on
the mold. Before measuring on the product,
measurements are made on the master product which
is compared with 3D CAD. The following are the
measurement results along with the deviations that
occur. So the percentage of deviations that occur is
the result of a comparison between the master product
and the printed product
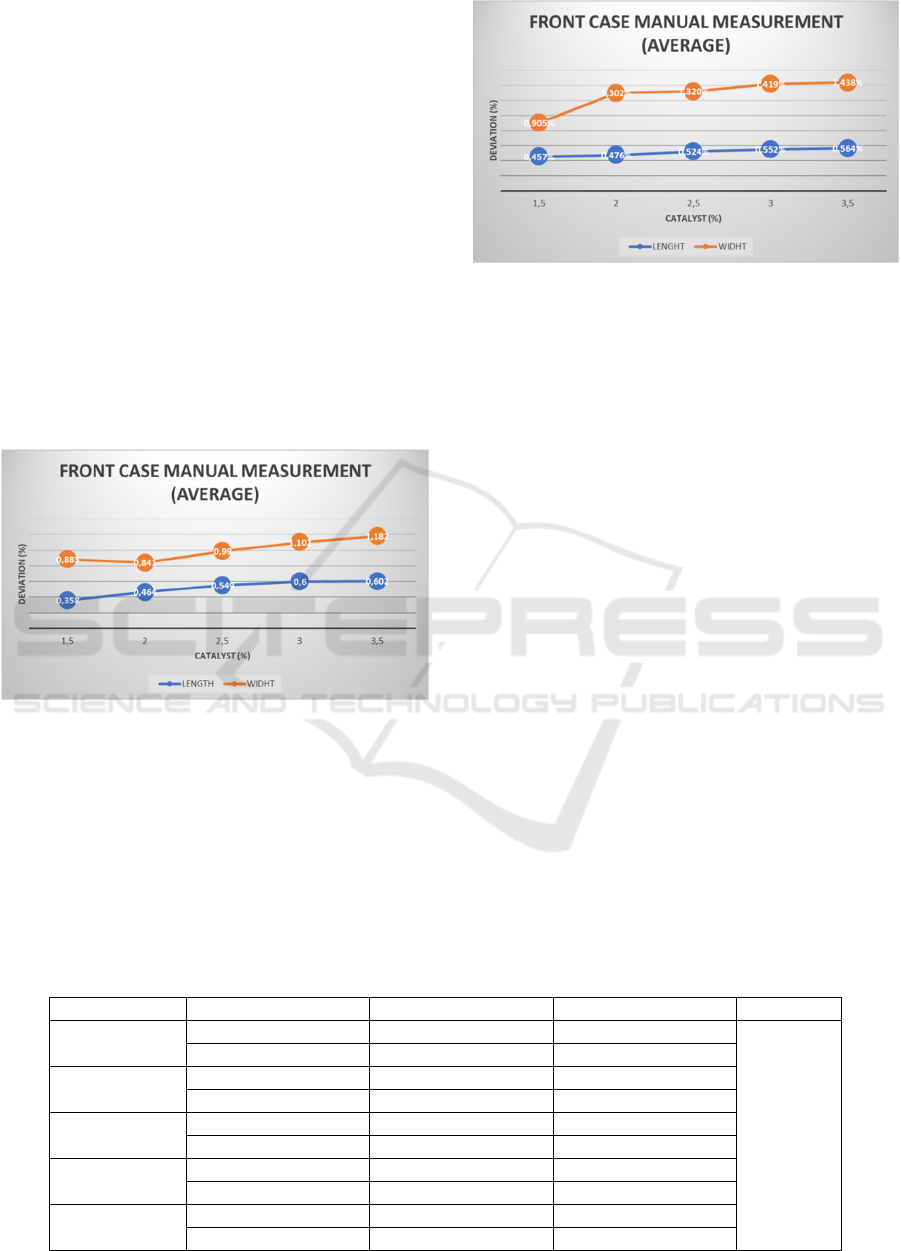
After that the average deviation of the product is
displayed in the form of a graph to see the increase in
the deviation. The following is the deviation data
from manual measurements for the front cover and
back cover which have been averaged for each
catalyst ratio.
Figure 6: Manual measurement graphic for Front Case.
From the two graphs, it can be concluded that the
more catalysts are included, the larger the deviation
or in this case the shrinkage of the measured part. In
addition, the graph shows that the largest shrinkage
for the front cover and back cover occurs at a catalyst
ratio of 3.5: 100. Meanwhile, the smallest shrinkage
at a catalyst ratio of 1.5: 100. The depreciation that
occurs
is
lower
than
the
depreciation
in
the
given
Figure 7: Manual measurement graphic for Back Case.
theory, which is 5%-12%. This is caused because the
product is made too thin so that the shrinkage that
occurs is getting smaller.
In both graphs there are similarities, namely the
average deviation of the largest deviation in the
width. This is because the contact area in the width
dimension is longer than the long dimension. In
addition, because the process of taking the product is
carried out when the product is half dry to make it
easier to take, this can cause the product to be
deformed.
From the measurement data obtained, it is then
used as the basis for determining the recommended
dimensions for the length and width of the pre-
determined product. The following are the suggested
dimensions for each variation of the catalyst ratio in
the length and width dimensions.
Table 3: Dimension recommendation for length and width for front case.
Catalyst Ratio Length and Width Ref. Dim. Rec. Dim. Tol
1,5
L 179,86 179,04
± 0,3
W 77,59 76,89
2
L 179,86 179,01
W 77,59 76,58
2,5
L 179,86 178,92
W 77,59 76,57
3
L 179,86 178,87
W 77,59 76,49
3,5
L 179,86 178,85
W 77,59 76,48
iCAST-ES 2022 - International Conference on Applied Science and Technology on Engineering Science
678
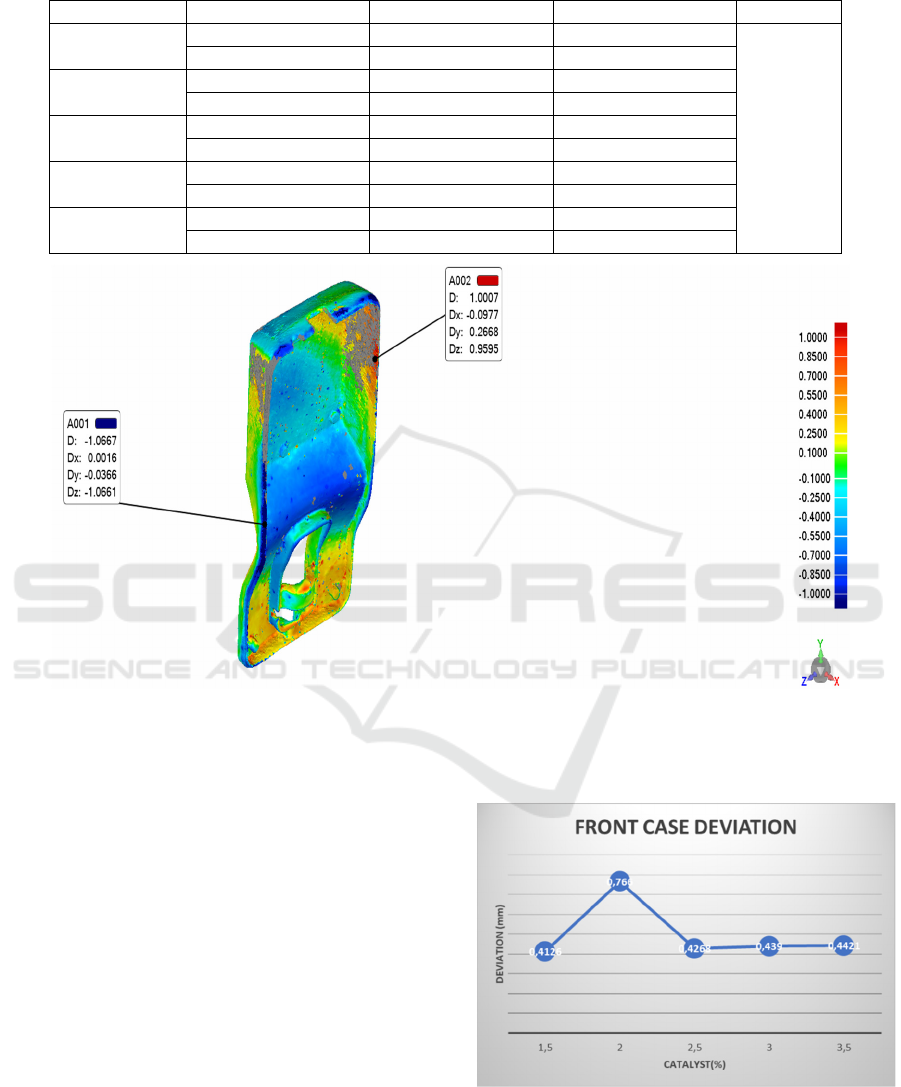
Table 4: Dimension recommendation for length and width for front case.
Catalyst Ratio Length and Width Ref. Dim. Rec. Dim. Tol
1,5
L 179,86 179,22
± 0,3
W 77,59 76,91
2
L 179,86 179,03
W 77,59 76,94
2,5
L 179,86 178,88
W 77,59 76,83
3
L 179,86 178,78
W 77,59 76,74
3,5
L 179,86 178,78
W 77,59 78.71
Figure 8: Example of 3D compare product.
3.1.2 3D Scan Measurement
Measurements using 3D Scan were carried out using
5 pairs of product samples (front cover and back
cover) with 1 sample for each variation of the catalyst
ratio. This is because there are some products with too
many voids or trapped air so that they are considered
unfit for the 3D Scanning process. The product used
is the product with the least trapped air holes or voids
on the product display in order to obtain a topology
that is closest to the product master. Measurements
are made by comparing the master product that is
made into a mold with the printed product. After that,
it is compared using the Geomagic software using the
3D Compare feature to get the deviation that occurs
in each product.The tolerance entered in the software
is ±0.1 mm. This is based on a maximum product
thickness of 2 mm and follows standard general
tolerances. The following is graphics of 3D Scan
results along with the maximum and minimum
deviations that occur in the product.
Figure 9: Front case deviation.
The Effect of Variation of Catalyst Ratio on Polyester Resin on Shrinkage and Ability to Absorb Mechanical Load on MiFUS® Case
679
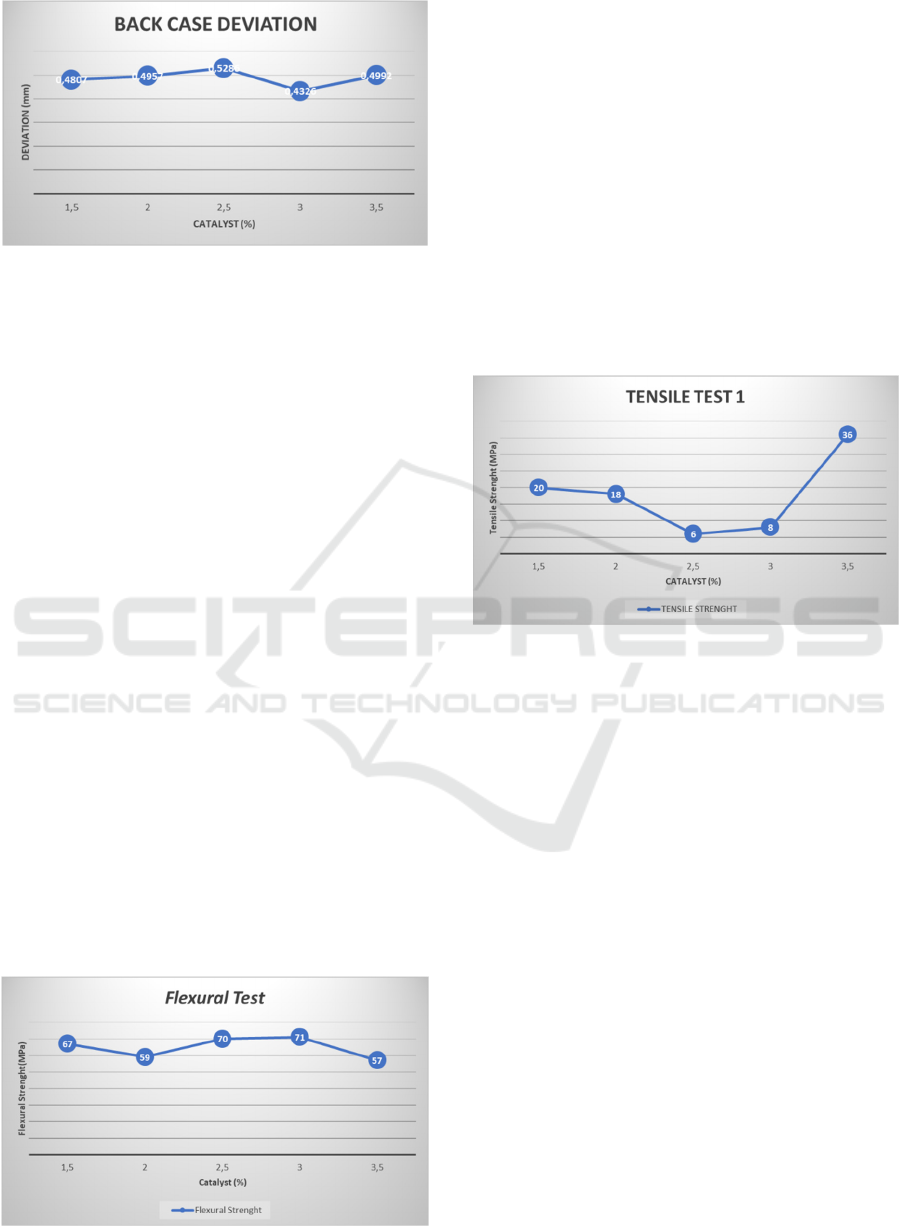
Figure 10: Back case deviation.
In the standard deviation chart on the front cover,
the smallest deviation occurs at a ratio of 1.5: 100 and
the largest is 2:100 with each deviation of 0.4126 mm
and 0.766 mm.
The non-linear increase in the ratio of 2: 100 is
most likely due to different treatments during the
manufacturing process such as clamping that is not
hard enough, room temperature is too low, or uneven
stirring. However, after a ratio of 2: 100 the data
obtained is quite linear.
In contrast to the back cover, the largest deviation
occurred at the catalyst ratio of 2.5: 100. However,
the smallest deviation remained at the catalyst ratio of
1.5: 100. This data obtained quite linear data.
3.2 Mechanical Test
Mechanical properties testing carried out is 2 tests,
namely flexural test and tensile test. All mechanical
load testing is carried out in the material testing
laboratory in the metal casting department. The
following are the results of the mechanical load
testing.
3.2.1 Flexural Test
The number of samples tested in the flexural test
amounted to 5 samples. From the test results obtained
the following results.
Figure 11: Flexural Test.
Based on the test results, it is found that the
greater the catalyst that is inserted into the polyester
resin, the higher the load-taking ability. In addition,
the most optimal alloy is the 3: 100 alloy with the
ability to accept mechanical loads of 71 MPa. This is
approximately 38% higher than the theoretical basis
that has been given, which is about 40.6 MPa.
While the lowest bending strength is at a ratio of
3.5:100 with a strength of 57 MPa. This is because
too much catalyst makes the material more brittle or
brittle and unable to withstand bending loads.
3.2.2 Tensile Test
The tensile test uses 5 samples. The following is the
tensile test result data presented in the form graphs.
Figure 12: Tensile Test 1.
Based on the test results, it was found that the
most optimal yield was 3.5: 100. This was due to the
increasing number of catalyst alloys and the harder
and more brittle material. In samples 2, 3 and 4 there
was a decrease in strength this was due to the poor
drying process so that the material was not strong
enough to withstand tensile loads. In addition, it is
suspected that the stirring process is not good so that
the catalyst is not mixed evenly. Therefore, after
discussing with the supervisor, it was decided to carry
out a tensile test for the second time. The following is
the data from the second tensile test which is
presented in the form of tables and graphs.
Based on the graph of the test results, it was found
that the most optimal alloy was at a ratio of 2.5:100
of 41 MPa and this was 19.5% greater than the given
theory, which was 33 MPa. However, the gradient is
still not linear even though the time and method of
stirring have been the same.
After that the author tries to compare the data
from the tensile test results one and two in one graph
and see how the difference is. The following is a
comparison chart between tensile tests 1 and 2.
iCAST-ES 2022 - International Conference on Applied Science and Technology on Engineering Science
680
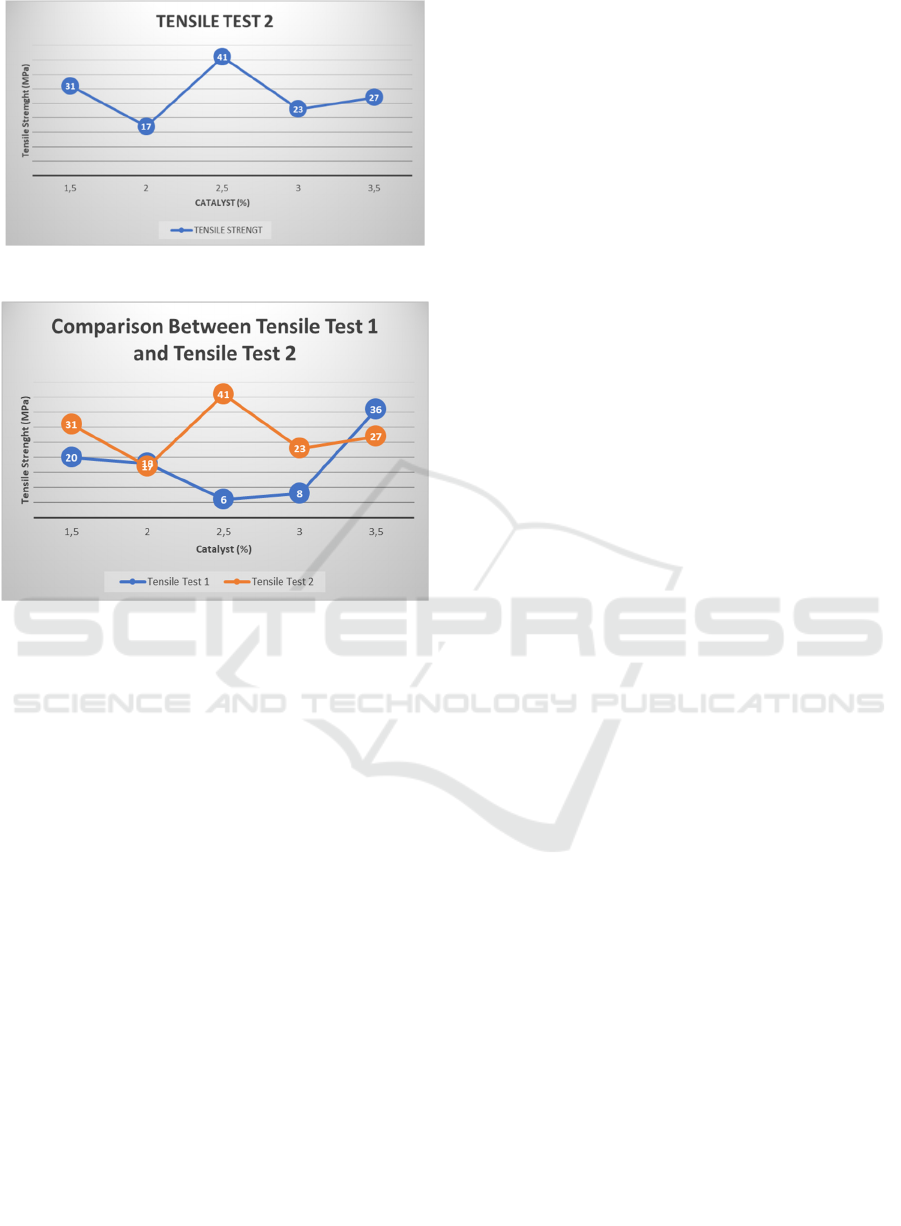
Figure 13: Tensile Test 2.
Figure 14: Comparison between tensile test 1 and tensile
test 2.
From the graph, it can be seen that there was an
increase in the average tensile strength from 17.8
MPa to 27.8 MPa. This shows that the time and
method of stirring have an effect on the resin product
made
Based on the test results obtained data that is less
linear, this has several factors causing the data to be
less linear. The following are factors that affect the
data to be less linear:
1. Unstable room temperature
The product production process is carried out
outdoors because it will be quite dangerous if the
production process is carried out indoors due to toxic
substances in polyester resin. Due to the outdoor
production process, the temperature of the
manufacturing environment during the day will be
different from the manufacturing temperature in the
morning. The higher the temperature, the faster the
reaction will occur.
2. Poor Molding
The main problem with the mold is that the ejection
process is difficult and lacks rigidity. So that when the
product is ejected, the mold is damaged and parts of
the mold sometimes stick to the product. In addition,
the surface of the resulting product is uneven so that
when the test results are gripped by the tensile testing
machine there are cracks in the product before the test
is carried out.
3. Drying time
In the products made there are several test samples
which after being made a few hours later the test is
immediately carried out. So that the sample is not
completely dry at the time of testing. The optimal
drying time for the resin is 1 to 2 days after the
product is made for the product to dry completely.
4 CONCLUSIONS
There is an effect of changes in catalyst ratio
variations in polyester resins on shrinkage. The
hypothesis that the greater the catalyst is inserted, the
greater the shrinkage that occurs is true based on the
results of manual measurements and 3D Scans. While
the results of manual measurements and 3D Scanning
obtained the smallest deviation or deviation due to
shrinkage is at a ratio of 1.5: 100. In addition,
shrinkage parameters are produced for the length and
width of the product for each variation of the ratio of
catalyst to resin.
There is an effect of changes in catalyst ratio
variations in polyester resin on the ability to accept
mechanical loads. The hypothesis given is not
entirely correct, because the data obtained do not
show that the larger the catalyst, the greater the
mechanical ability. In the bending test the most
optimal alloy is 3:100, which is 71 MPa, while for the
tensile test it is 2.5:100 at 41 MPa.
REFERENCES
Aceto, G., Persico, V., & Pescapé, A. (2019). A survey on
information and communication technologies for
industry 4.0: State-of-the-art, taxonomies, perspectives,
and challenges. IEEE Communications Surveys &
Tutorials, 21(4), 3467-3501.
Abdulhameed, O., Al-Ahmari, A., Ameen, W., & Mian, S.
H. (2019). Additive manufacturing: Challenges, trends,
and applications. Advances in Mechanical Engineering,
11(2), 1687814018822880.
Touri, M., Kabirian, F., Saadati, M., Ramakrishna, S., &
Mozafari, M. (2019). Additive manufacturing of
biomaterials− the evolution of rapid prototyping.
Advanced Engineering Materials, 21(2), 1800511.
Modi, Y. K., & Sanadhya, S. (2018). Design and additive
manufacturing of patient-specific cranial and pelvic
bone implants from computed tomography data.
The Effect of Variation of Catalyst Ratio on Polyester Resin on Shrinkage and Ability to Absorb Mechanical Load on MiFUS® Case
681

Journal of the Brazilian Society of Mechanical Sciences
and Engineering, 40(10), 1-11.
Bagalkot, A., Pons, D., Clucas, D., & Symons, D. (2019).
A methodology for setting the injection moulding
process parameters for polymer rapid tooling inserts.
Rapid Prototyping Journal.
Ahmed, N. (2019). Direct metal fabrication in rapid
prototyping: A review. Journal of Manufacturing
Processes, 42, 167-191.
Zhou, L. Y., Fu, J., & He, Y. (2020). A review of 3D
printing technologies for soft polymer materials.
Advanced Functional Materials, 30(28), 2000187.
Barnhoorn, J. S., Haasnoot, E., Bocanegra, B. R., & van
Steenbergen, H. (2015). QRTEngine: An easy solution
for running online reaction time experiments using
Qualtrics. Behavior research methods, 47(4), 918-929.
Wolf, M. P., Salieb-Beugelaar, G. B., & Hunziker, P.
(2018). PDMS with designer functionalities—
Properties, modifications strategies, and applications.
Progress in Polymer Science, 83, 97-134.
Gao, Y., Zhang, H., Huang, M., & Lai, F. (2019).
Unsaturated polyester resin concrete: A review.
Construction and Building Materials, 228, 116709.
Celik, K., & Belli, S. (2015). The effect of different
restoration techniques on fracture strength of teeth with
flared roots. Journal of Adhesion Science and
Technology, 29(1), 12-23.
Ansari, A. A., Dhakad, S. K., & Agarwal, P. (2020).
Investigation of mechanical properties of sisal fibre and
human hair reinforced with epoxy resin hybrid polymer
composite. Materials Today: Proceedings, 26, 2400-
2404.
iCAST-ES 2022 - International Conference on Applied Science and Technology on Engineering Science
682
