
Microstructure, Microhardness and Thermal Properties of
Aluminum with Multi-Walled Carbon Nanotubes Composites
Prepared by Liquid State Processing
I Dewa Made Pancarana and I Nyoman Budiarthana
Politeknik Negeri Bali, Jimbaran, Bali, Indonesia
Keywords: Microstructure, Microhardness, Thermal Conductiviy, Composites, Aluminum, Multi-Walled Carbon
Nanotubes.
Abstract: Aluminum matrix composites reinforced with 0-10 wt.% copper-coated multiwalled carbon nanotubes
(Cu/MWNTs) were produced by liquid state processing. The composites with < 10 wt.% Cu/MWNTs
additions had higher thermal conductivity than the pure aluminum produced by the same liquid state
processing. The Cu/MWNTs/Al composites exhibited the maximum thermal conductivity of 442.32 W/m/K
at 8 wt.% Cu/MWNTs. The enhancement of thermal conductivity is supported by the measured
microhardness. The Cu/MWNTs/Al composites exhibited the maximum microhardness 91,3 HV also at 10
wt.% Cu/MWNTs. The contribution of carbon nanotubes to thermal conductivity of the composites was
demonstrated by theoretical analysis. The results show that copper-coated multiwalled carbon nanotubes
(Cu/MWNTs) reinforced aluminum matrix composite is a potential material for high thermal conductivity
applications.
1 INTRODUCTON
The increase in heat from electronic components is a
major problem faced in electronic technology
because of the miniaturization of these components
(Ashby, et al., 2004). Heat sinks are used to dissipate
the heat generated by these electronic components. A
heat sink is described as an object that disperses or
dissipates heat from another object. Usually heat
sinks are widely used in computers and
microelectronics as well as other applications (Reddy
and Gupta, 2010).
Aluminum is the most commonly used material
for heat sinks due to its light weight, lower cost,
manufacturing capability, and infrastructure (Keller,
1998). The thermal conductivity of aluminum is
about 220 W/mK (Dogruoz and Arik, 2008). The
higher this number the more heat the material is able
to conduct. In addition, copper can be used for the
production of heat sinks because of its high thermal
conductivity value of around 400 W/mK (Gallagher,
et al., 1998). Its main disadvantage over aluminum is
that it is three times heavier and more expensive.
Materials with high thermal conductivity (TC)
and low coefficient of thermal expansion (CTE) are
the choice for laptop computer heat sinks. A material
suitable for this purpose must combine two basic
properties: it must have a high thermal conductivity
(TC) and a suitable coefficient of thermal expansion
(CTE) (similar to semiconductors used in the
manufacture of electronic circuits).
Carbon nanotubes (CNTs) with outstanding
mechanical properties, very low thermal expansion
(CTE≈0), and high thermal conductivity (Dai, 2002),
are potential reinforcement materials for use in
composites. According to theoretical predictions and
experimental measurements, the thermal conductivity
of CNTs reaches as high as 3000–6600 W/m/K (Kim,
et al., 2001). Aluminum is one of the most important
matrix materials for MMC.
So far, only a few studies have discussed the
thermal conduction behavior of CNT/Al composites.
Bakshi, et al., 2010 produced a composite of 10 wt.%
CNTs/Al using plasma spraying and the thermal
conductivity was only 25.4 W/m/K, much less than
pure Al. Yamanaka et al. Yamanaka, et al., 2006,
reported that the thermal conductivity of CNTs/Al
composites decreased with increasing CNT content.
The reported thermal conductivity for CNTs/Cu
composites (Chu, et al., 2010 also showed a
850
Pancarana, I. and Budiartana, I.
Microstructure, Microhardness and Thermal Properties of Aluminum with Multi-Walled Carbon Nanotubes Composites Prepared by Liquid State Processing.
DOI: 10.5220/0011894000003575
In Proceedings of the 5th International Conference on Applied Science and Technology on Engineering Science (iCAST-ES 2022), pages 850-856
ISBN: 978-989-758-619-4; ISSN: 2975-8246
Copyright © 2023 by SCITEPRESS – Science and Technology Publications, Lda. Under CC license (CC BY-NC-ND 4.0)

decreasing trend compared to pure Cu. The decrease
in thermal conductivity was mainly related to the
agglomeration of CNTs which resulted in the thermal
resistance of the interface into the composite.
This research focuses on the thermal conduction
behavior of aluminum matrix composites reinforced
with multiwall nanotubes (MWNTs/Al composites)
produced by the stir casting process. Stir casting
processing is a very useful technique for bonding
non-sinterable materials such as carbon nanotubes. In
order to produce a homogeneous dispersion of carbon
nanotubes in an aluminum matrix, the powdered
carbon nanotubes were first modified before being
incorporated into the aluminum melt.
2 MATERIALS AND
EXPERIMENTALS
PROCEDURES
2.1 Materials
Multiwalled carbon nanotubes supplied by Chengdu
Organic Chemicals Co. Ltd., China (OD: 10 - 20 nm,
length: 10 - 30 m and purity > 98% ) were used in
the present study. The colloidal palladium-tin
activator made with a composition of 0.5 g
palladium chloride (PdCl2), 50 ml 37%
hydrochloride acid (HCl), 200 ml deionised water,
25 g stannous chloride. Cupric Sulphate
Pentahydrate (98.5% Assay) and Sodium Carbonate
Anhydrous (99.5% Assay) were supplied by Bofa
Laboratotium. Sodium Hydroxide (99% Assay) was
supplied by Bofa Laboratotium. Pottasium Sodium
Tartrate Tetrahydrate or what is known as Rochelle
salt (99% Assay) was supplied by Bofa
Laboratotium. Cobalt (II) Chloride Hexahydrate
(99% Assay) was supplied by Bofa Laboratotium.
Formaldehyde 37% in aqueous solution was
supplied by Bofa Laboratotium.
2.2 Experimental Procedures
The metallization of MWCNTs by copper was
conducted in three steps. The process started by the
activation of MWCNTs surface using colloidal Pd-
Sn particles followed by the acceleration step to
remove stannous hydroxide deposits on top of the
activated surface. Finally, The electroless plating of
Cu-Co on top of MWCNTs was performed as shown
Figure. 1.
Figure 1: General scheme of Cu-Co electroless plating on
MWCNTs.
In more detail, the procedure for coating WMCNTs
with copper refers to the literature (Elsharkawi, 2018).
Figure 2 shows the color of the obtained copper
coated MWCNTs powder.
Figure 2: Filtered copper coated MWCNT’s of a brown
color.
The copper coated MWCNTs were characterized
using scanning electron microscopy (SEM) analysis
using (JEOL-JSM 6510 A) at the Materials Labora-
tory of Mechanical Engineering Udayana University.
2.2.1 Al-MWCNTs Composite
Manufacturing Process
Materials for composites, aluminum and multiwall
carbon nanotubes with varying compositions (0% ;
2%; 4%; 6%; 8% and 10% by weight MWCNTs)
were included in the smelting kowi. Heated to a
temperature of 700 oC with a time of 20 minutes and
a stirrer speed of 200 rpm. The composite melt is
poured into a cylindrical metal (steel) mold at room
temperature.
2.2.2 Density of Al-Cu/MWCNTs
Composites
The measurement of the density of the Al-
Cu/MWCNTs composite material is a test object
resulting from the stir casting process.
Microstructure, Microhardness and Thermal Properties of Aluminum with Multi-Walled Carbon Nanotubes Composites Prepared by Liquid
State Processing
851
By knowing these quantities, the density of the Al-
Cu/MWCNTs composite material can be determined
using the equation (Birkeland, 1984),
ρ=
𝑚
𝑚
−𝑚
−𝑚
𝑥 𝜌 𝐻
𝑂
with,
ρ = bulk density (gram/cm
3
)
m
s
= mass of the sample after drying in the oven
(grams)
m
g
= mass of sample suspended in water (grams)
m
k
= mass of sample hanging wire (grams)
ρ H
2
O = density of water = 1 gram/cm
3
2.2.3 Porosity of Al-Cu/MWCNTs
Composites
By knowing these quantities, the porosity of the Al-
Cu/MWCNTs composite material can be determined
using the equation (Birkeland, 1984),
ρ=
𝑚
− 𝑚
𝑚
−𝑚
−𝑚
𝑥 100%
with,
ρ = bulk density (gram/cm
3
)
m
s
= mass of the sample after drying in the oven
(grams)
m
b
= mass of the sample after soaking in water /
saturated (grams)
m
g
= mass of sample suspended in water (grams)
m
k
= mass of sample hanging wire (grams)
2.2.4 Hardness of Al-Cu/MWCNTs
Composite (Vickers Hardness Test)
The hardness of the Al-Cu/MWCNTs composite
material was tested at the Metallurgical Laboratory of
Mechanical Engineering, State University of Malang
using a Microhardness Tester (ESEWAY, Model
EW421AAT), and the test refers to the standard
(Dowling, E.N., 1999); ASTM E 18 - 02.
Measure the diagonal length of each pressing
result and the hardness value of the tested sample can
be read directly on the microhardness tester monitor,
perform at least 3 repetitions for each sample tested.
The hardness value of the Al-Cu/MWCNTs
composite material can also be calculated using the
following equation (Dowling, 1999).
𝑉𝐻𝑁 =
2 𝑃
𝑑
sin
𝛼
2
= 1,8564
𝑃
𝑑
with:
VHN = Vickers hardness value (kgf/mm
2
)
P = pressing load (kgf)
d = average diagonal length (mm)
α = angle between diamond faces (136
o
)
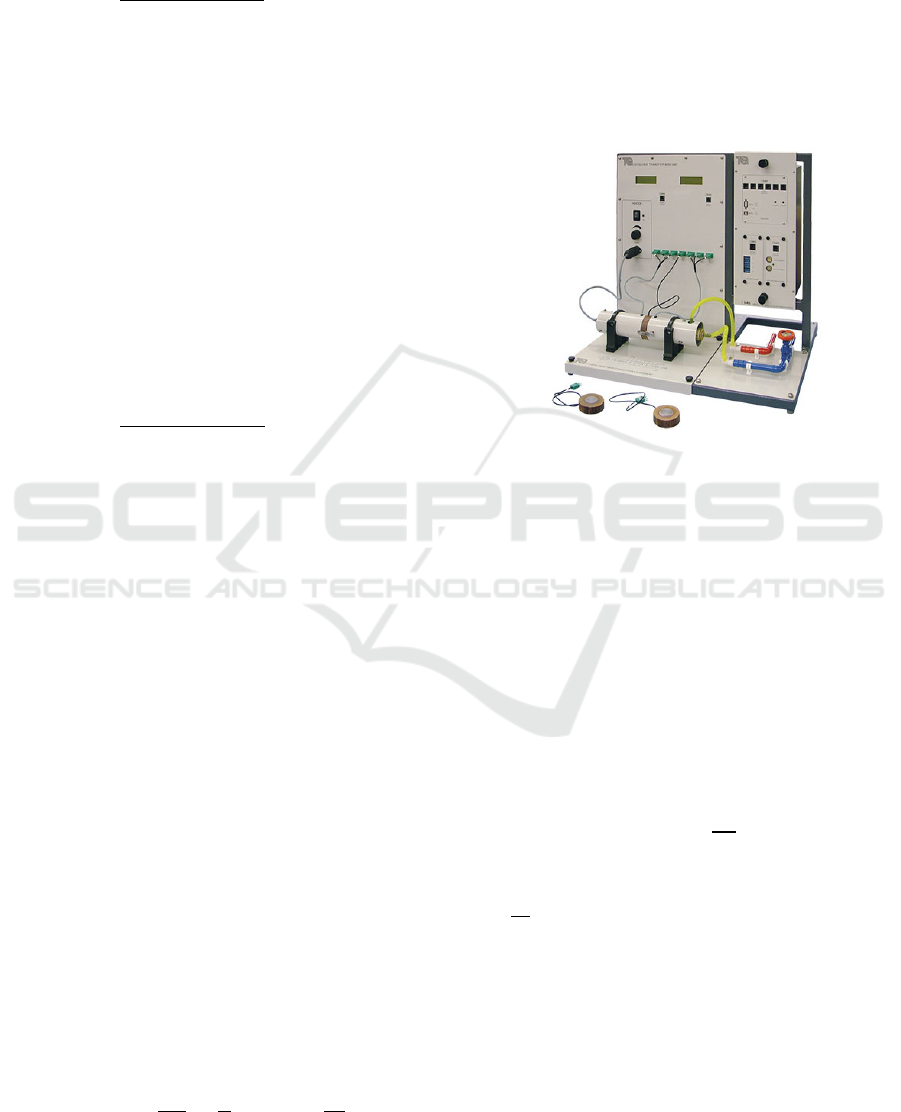
2.2.5 Thermal Conductivity
In this study, for the thermal conductivity test, Linear
Heat Conduction Devices (TD1002a) were used.
Figure 3: Linear Heat Conduction Experiment (TD1002a).
The test object consists of Aluminum- MWCNTs
composites with a thickness of 20 mm and a diameter
of 30 mm
The energy that occurs in the heater is given by
the equation:
W = V x I
With ,
W = Electrical power (watts)
V = Voltage (volts)
I = Electric current (amperes)
Heat transfer that occurs:
𝑞 = 𝑘. 𝐴.
𝑑𝑇
𝑑𝑥
With ,
𝑞 =
= heat transfer rate (Watts)
K = conduction heat transfer coefficient (Watt/m.K)
A = Cross-sectional area of metal test object (m
2
)
dT = temperature difference (K)
dx = distance between test points (T
1
and T
2
)
for this case W = q
iCAST-ES 2022 - International Conference on Applied Science and Technology on Engineering Science
852
3 RESULTS AND DISCUSSION
3.1 Products of Al – MWCNTs
Composites
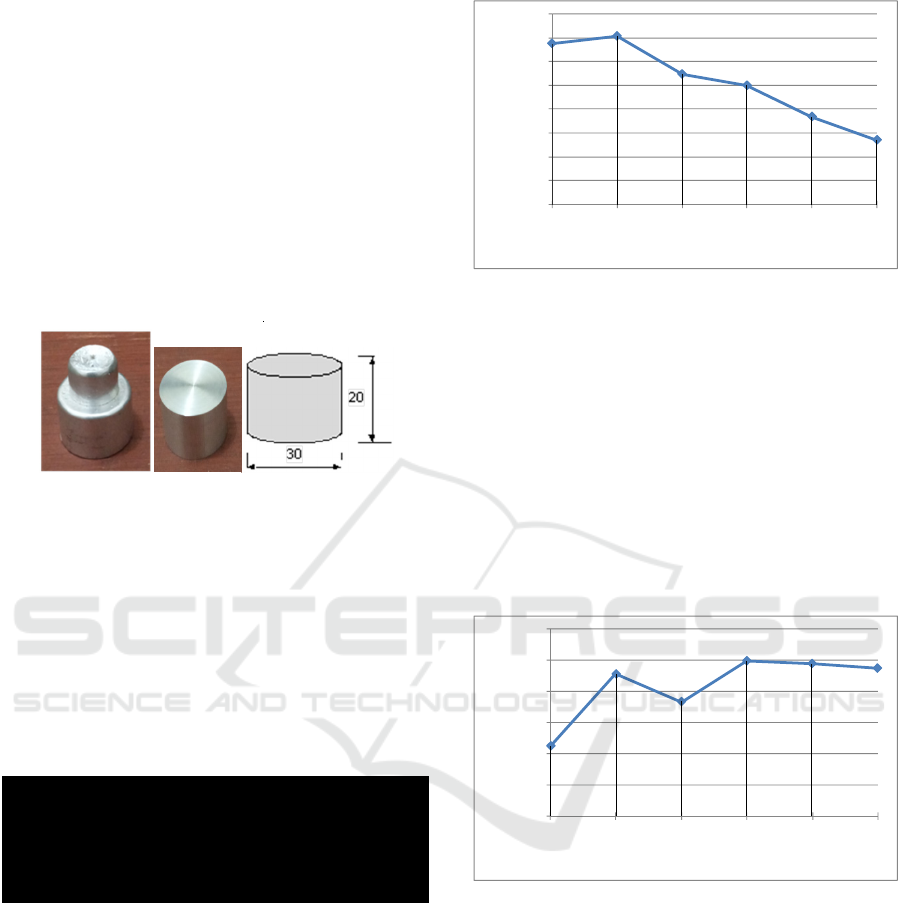
The results of the Al – MWCNTs composite casting
process with various compositions are shown in
Figure 4.
Furthermore, the results of the Al - MWCNTs
composite casting are formed (lathe process) into a
diameter of 30 mm and a thickness of 20 mm, for the
process of testing physical properties, morphological
characterization and thermal conductivity, Figure 4.
Figure 4: Al – MWCNTs composite casting product.
3.2 Physical Properties of
Al –MWCNTs Composites
Based on the results of calculations using equation (1)
for the density test, equation (2) for the porosity test,
as well as testing the hardness properties of
Aluminum – Multiwall Carbon Nanotube
composites, which were carried out in the Lab.
Metallurgy Mechanical Engineering, Udayana
University, obtained data as shown in figure 5.
Figure 5: Physical Test Data for Al – MWCNTs
Composites.
3.2.1 Effect of Reinforcing MWCNTs on
Aluminum on Density
Based on Figure 6, it can be seen that with increasing
MWCNTs content in Al – MWCNTs composites, the
composite density tends to decrease. The lowest
composite density of 2.535 g/cm
3
occurred when the
MWCNTs content was 10% by weight. Meanwhile,
the highest composite density of 2.754 gr/cm
3
occurred when the MWCNTs content was 2% by
weight.
Figure 6: Graph of the relationship between density and
composition.
3.2.2 Effect of Reinforcing MWCNTs on
Aluminum on Porosity
Based on Figure 7, it can be seen that with increasing
MWCNTs content in the Al – MWCNTs composite,
the porosity of the composite tends to increase. The
lowest composite porosity of 4.51% occurred when
the MWCNTs content was 0% by weight.
Meanwhile, the highest composite porosity of 9.96%
occurred when the MWCNTs content was 6% by
weight.
Figure 7: Graph of the relationship between porosity and
composition.
3.3 Microstructure of Al-MWCNTs
Composites
In the sample of the cast Al - Cu/MWCNTs
composite, the Al grain morphology did not change
much compared to Al fine, as shown in Fig. 3.4. This
is because gravity casting is applied during the
formation of the composite, which benefits the
plasticizing of the powder to achieve full density.
Grain boundaries are seen more clearly after repeated
etching. In the pure Al samples, small grain growth
m
s
m
g
m
k
m
b
ρ Η
2
Ο
ρ
P
(gr) (gr) (gr) (gr)
(gr/cm
3
)(gr/cm
3
)
%
0 MWCNTs 100 Al 38,83 25,65 1 39,5 1 2,738 4,512
2 MWCNTs 98 Al 37,92 25,15 1 39,3 1 2,754 9,109
4 MWCNTs 96 Al 37,78 24,65 1 38,9 1 2,674 7,344
6 MWCNTs 94 Al 37,15 24,13 1 38,7 1 2,650 9,955
8 MWCNTs 92 Al 36,95 23,65 1 38,5 1 2,584 9,779
10 MWCNTs 90 Al 36,78 23,27 1 38,3 1 2,535 9,482
Composition specimen
(% weight)
2,738
2,754
2,674
2,650
2,584
2,535
2,400
2,450
2,500
2,550
2,600
2,650
2,700
2,750
2,800
0246810
Density (gr/cm3)
Composition MWCNT (%)
4,51
9,11
7,34
9,96
9,78
9,48
0,00
2,00
4,00
6,00
8,00
10,00
12,00
0246810
Porosity (%)
Composition MWCNTs (%)
Microstructure, Microhardness and Thermal Properties of Aluminum with Multi-Walled Carbon Nanotubes Composites Prepared by Liquid
State Processing
853
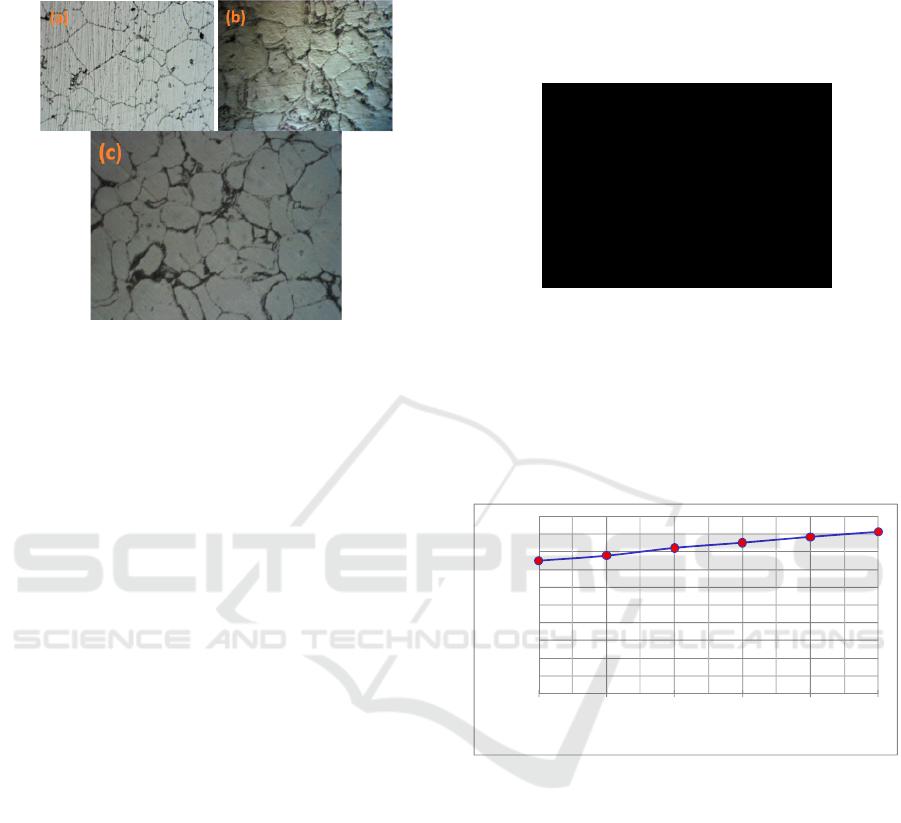
(Fig. 8a) and equiaxed grains were observed in all
composites (Fig. 8b and 8c).
Figure 8: Microstructure image etched (a) pure Al, 1.0 wt.%
(b) MWCNT/Al uncoated composite and (c) MWCNT/Al .
Cu-coated composite.
In the composite sample, the MWCNTs were
homogeneously dispersed at the grain boundaries and
within the Al particles. By comparing the grain size
of the composite samples (Fig. 3.5b and 3.5c) with the
Al powder particles, it can be seen that the particle
growth is very small. This is due to the embedding
effect of MWCNTs which inhibits particle growth. It
is important to note that the effect of Cu-coated
MWCNTs increases more of the Al matrix binding
interface. Therefore, small grain sizes were obtained
in the Cu-coated MWCNTs/Al composites compared
to the uncoated MWCNTs/Al composites, where little
grain growth resulting in relatively larger grains was
observed. Due to poor wettability in uncoated
MWCNTs, the embedding of MWCNTs in Al
particles was less during casting compared to Cu-
coated MWCNTs/Al composites.
3.4 Effect of Reinforcing MWCNTs on
Hardness
As previously mentioned, copper coated MWCNTs
are added in varying percentages to the pure
aluminum melt using casting techniques. The aim
was to improve the wettability and dispersion
between aluminum and MWCNTs which was
reported to be very poor in a previous review
(Agarwal, A., et al., 2011). The hardness of the
sample was tested using a Vickers hardness tester.
About 3 penetrations were carried out on a different
area of each sample. The small variability of the
Vickers hardness between the different indentations
is indicative of the homogeneous distribution of Cu
coated MWCNTs in the aluminum matrix. The results
of the Vickers hardness number for various
percentages of copper coated MWCNTs are
presented in Table 1.
Table 1: Hardness test result data.
Based on Figure 9, it can be seen that with
increasing MWCNTs content in Al – MWCNTs
composites, the composite hardness tends to increase.
The lowest composite hardness of 75 HV occurred
when the MWCNTs content was 0% by weight.
Meanwhile, the highest composite hardness of 91.3
HV occurred when the MWCNTs content was 10%
by weight.
Figure 9: Graph of the relationship between hardness and
composition.
It was found that adding 2, 4, 6, 8 and 10%
copper-coated MWCNTs to pure aluminum resulted
in an increase in Vickers hardness of 4.13 ; 9.87 ;
13.73 ; 18.00 and 21.73% are significant especially
that, for example, 2% copper-clad MWCNTs have
less than 0.1% of MWCNTs. This confirms the
potential of the process used in producing good
quality cast composites from Al-Cu/MWCNTs.
Efforts are underway to optimize the casting process
and to fully investigate the mechanical behavior of
the composite.
Hardness
(HV)
0 MWCNTs 100 Al 75
2 MWCNTs 98 Al 78,1
4 MWCNTs 96 Al 82,4
6 MWCNTs 94 Al 85,3
8 MWCNTs 92 Al 88,5
10 MWCNTs 90 Al 91,3
Composition specimen
(% weight)
75
78,1
82,4
85,3
88,5
91,3
0
10
20
30
40
50
60
70
80
90
100
0246810
Hardness (HV)
Composition MWCNTs (% weight)
iCAST-ES 2022 - International Conference on Applied Science and Technology on Engineering Science
854

3.5 Thermal Conductivity Test Results
For the thermal conductivity test, Linear Heat
Conduction Devices (TD1002a) were used which was
carried out in the Lab. The Basic Phenomenon of
Mechanical Engineering, Udayana University. The
size of the test object is 30 mm in diameter and 20
mm thick, with a power input of 50 Watt. Based on
the test results and the calculation of the thermal
conductivity of the Aluminum – Multiwall Carbon
Nanotube composite, the data is obtained as shown in
table 2.
Table 2: Data from the heat conductivity test.
Based on Figure 3.6, it can be seen that as the
MWCNTs content increases in the Al-MWCNTs
composite, the thermal conductivity of the Al-
MWCNTs composite tends to increase. The lowest
composite thermal conductivity of 252.42 W/m.K
occurred when the MWCNTs content was 0% by
weight. Meanwhile, the highest composite thermal
conductivity of 442.32 W/m.K occurred when the
MWCNTs content was 8% by weight.
Figure 10: Graph of the relationship between thermal
conductivity and composition.
4 CONCLUSION
In the process of making Al-MWCNTs composites
with a stir casting process, it can be concluded that:
a. The higher the MWCNTs content, the density of
the Al-MWCNTs composite decreased, while the
porosity of the Al-MWCNTs composite increased.
b. The higher the MWCNTs content, the hardness
and thermal conductivity of the Al-MWCNTs
composite tend to increase.
c. The distribution of MWCNT in the aluminum
matrix was uneven and agglomeration of MWCNT
occurred at several locations.
d. Composites with the addition of <10 wt.%
Cu/MWNTs have higher thermal conductivity
than pure aluminum produced by the same liquid
state processing.
e. The Cu/MWNTs/Al composites showed a
maximum thermal conductivity of 442.32 W/m/K
at 8 wt.% Cu/MWNTs. The increase in thermal
conductivity is supported by the measured
microhardness. The Cu/MWNTs/Al composites
showed a maximum microhardness of 91.3 HV
also at 10 wt.% Cu/MWNTs.
f. The results showed that the aluminum matrix
composite reinforced with copper-coated
multiwalled carbon nanotubes (Cu/MWNTs) is a
potential material for high thermal conductivity
applications.
ACKNOWLEDGEMENTS
The researcher expresses his gratitude for the funding
assistance from the Bali State Polytechnic DIPA
2022, so that this research can be completed properly
and can publish this paper.
REFERENCES
Agarwal, A., Bakshi, S.R., and Lahiri, D. (2011),
Processing techniques. Carbon nanotubes: reinforced
metal matrix composites, CRC Press-Taylor & Francis,
Boca Raton, Florida, pp 30–33.
Ashby, M.F., Brechet Y.J.M., Cebon D., and Salvo, L.
(2004). Selection strategies for materials and processes.
Materials and Design. Vol. 35, No. 1, pp. 51-67.
Bakshi, S.R., Patel, R.R., and Agarwal, A. (2010), Thermal
conductivity of carbon nanotube reinforced aluminum
composites: a multi-scale study using object oriented
finite element method. Comput Mater Sci; 50:419–28.
Chu, K., Wu, Q.Y., Jia, C.C., Liang, X.B., Nie, J.H., and
Tian, W.H., (2010). Fabrication and effective thermal
conductivity of multi-walled carbon nanotubes
reinforced Cu matrix composites for heat sink
applications. Compos Sci Technol;70:298–304.
Dai, H., (2002), Carbon nanotubes: opportunities and
challenges, Surface Science, Vo. 500, Issues 1–3, pp.
Thermal Conductivity
(W/m.K)
0 MWCNTs 100 Al 252,42
2 MWCNTs 98 Al 318,47
4 MWCNTs 96 Al 330,27
6 MWCNTs 94 Al 350,49
8 MWCNTs 92 Al 442,32
10 MWCNTs 90 Al 294,88
Specimen Composition
(% weight)
252,42
318,47
330,27
350,49
442,32
294,88
0,00
50,00
100,00
150,00
200,00
250,00
300,00
350,00
400,00
450,00
500,00
0246810
Thermal conductivity (W/m.K)
Compositio n MWCNTs(% weight)
Microstructure, Microhardness and Thermal Properties of Aluminum with Multi-Walled Carbon Nanotubes Composites Prepared by Liquid
State Processing
855

218-241, https://doi.org/10.1016/S0039-6028(01)015
58-8
Dogruoz, M. B. and Arik, M. (2008). An investigation on
the conduction and convection heat transfer from
advanced heat sinks. IEEE. Vol. 1, No. 1, pp. 367-372.
Elsharkawi, M. & Esawi, A.M.K. (2018). Development of
an Electroless Plating Process for Multi-wall Carbon
Nanotubes (MWCNTS) to Improve Their Dispersion
and Wettability in Molten Aluminum, The Minerals,
Metals & Materials Society, pp. 29-39,
https://doi.org/10.1007/978-3-319-72853-7_3
Gallagher, Shearer, B. and Matijasevic, G., (1998),
Materials Selection Issues for High Operating
Temperature (HOT) Electronic Packaging. lEE. Vol. 1,
No. 1, pp. 180-189.
Keller, K. P. (1998). Cast heat sink design advantages.
IEEE Intersociety Conference on Thermal Phenomena.
Vol. 1, No. 1, pp. 112-117.
Kim, P., Shi, L., Majumdar, A., and McEuen, P.L., (2001),
Thermal transport measurements of individual
multiwalled nanotubes. Phys Rev Lett; 87:215502.
Reddy, P. G., and Gupta, N. (2010), Material Selection for
Microelectronic Heat Sink: An Application of the
Ashby Approach. Materials and Design. Vol. 31, No. 1,
pp. 113-117.
Yamanaka, S., Kadokura, H., Kawasaki, A., Sakamoto, H.,
Mekuchi, Y., and Kuno, M., (2006). Fabrication and
thermal evaluation of carbon nanotube/aluminium
composite by spark plasma sintering method. J Jpn Soc
Powder Powder Metall ;53(12):965–70.
Zanetti, L. J., Potemra, T. A., Iijima, T., Baumjohann, W.,
& Bythrow, P. F. (1984). Ionospheric and Birkeland
current distributions for northward interplanetary
magnetic field: Inferred polar convection. Journal of
Geophysical Research: Space Physics, 89(A9), 7453-
7458.
Schmitt, E. A., & Dowling, J. E. (1999). Early retinal
development in the zebrafish, Danio rerio: light and
electron microscopic analyses. Journal of Comparative
Neurology, 404(4), 515-536.
Birkeland, P. W. (1984). Soils and geomorphology. Oxford
university press.
Dowling, A. P. (1999). A kinematic model of a ducted
flame. Journal of fluid mechanics, 394, 51-72.
iCAST-ES 2022 - International Conference on Applied Science and Technology on Engineering Science
856
