
Pricing Strategies for Vehicle Production Under the Corporate
Average Fuel Consumption and New Energy Vehicle Credit Policy
Jiawei Zhang, Jiayu She, Shaoqi Zhang and Xiaoyu Gu
School of Economics and Management, Nanjing University of Science and Technology, Nanjing, China.
Keywords: CAFC and NEV Credit Policy; Electric and Gasoline Vehicle.
Abstract: China has a clear strategic positioning and phased development goals for electric vehicles, and has been
guaranteed through fiscal and tax encouragement and a series of policies. Based on the reality of the industry,
the operation and decision-making of traditional Gasoline vehicle and Electric vehicle is a common problem
for enterprises. Aiming at the important index of credit, this paper constructs a new automobile supply chain
model composed of electric / gasoline vehicle manufacturers, government, and customers, in order to study
the Corporate Average Fuel Consumption and New Energy Vehicle credit policy. On the other hand, the
government's regulation and control of gasoline consumption and other key indicators and market demand
factors affect the pricing decisions of enterprises. When the profit of the whole society reaches the maximum
value, the maximum profit, optimal sales price, and credit value of every agent in the supply chain are given.
This study puts forward management suggestions for the pricing decisions of automobile enterprises and
government implementation policies, which will contribute to the rapid development of the electric vehicle
industry.
1 INTRODUCTION
The CAFC (Corporate Average Fuel Consumption)
and NEV (New Energy Vehicle) credit policy has an
important influence on the coexistence of Gasoline
vehicle (GV, driven by the gasoline) and Electric
vehicle (EV, driven by the electricity as the new
energy vehicle) which is used to develop the
automobile market to promote the production and
marketing of new energy vehicle (Yin, 2021). With
this policy, how to make production pricing and
decision-making has become a hot issue of concern to
automobile enterprises and the government.
At present, there have been several related
research on CAFC and NEV credit policy of
automobile enterprises (Yin, 2021). Liu et al. (2018)
analysed the future development of electric vehicle
under policy incentives by setting four scenarios and
establishing a system dynamics model, and concluded
that large-scale market penetration requires strong
policy support. Yang et al. (2022) used optimization
theory to compare the government pricing model and
the market pricing model of the CAFC and NEV
credit, and discussed the effectiveness of the pricing
method for electric vehicle production. Diwu et al.
(2016) proposed a dual channel supply chain model
considering government subsidies to study the
optimal promotion strategy of new energy vehicle. On
the basis of game theory and credit market
equilibrium, Li et al. (2019) established a model of
market analysis quantify the influence of CAFC and
NEV credit on the purchase and sale mechanism of
the automobile industry.
Through the method of game
theory, Ma et al. (2022) studied the improvement
level and production situation of fuel economy of
traditional internal combustion engine vehicle and
electric vehicle, established the optimization model of
traditional automobile supply chain, and produced
new management opinions on the specific action plan.
According to the credit value, Wang et al. (2022)
studied the profit and loss of automobile
manufacturers based on different technology
combinations and summarized the most cost-effective
compliance strategies of these automobile
manufacturers. From the perspective of coexistence
of electric vehicle and Gasoline vehicle, Xu et al.
(2021) constructed a dynamic game model composed
of retailers, manufacturers and the government, and
considered the supply chain pricing strategy under the
Stackelberg game modelled by manufacturers to
formulate the optimal pricing strategy. To sum up,
scholars have achieved several research on
Zhang, J., She, J., Zhang, S. and Gu, X.
Pricing Strategies for Vehicle Production Under the Corporate Average Fuel Consumption and New Energy Vehicle Credit Policy.
DOI: 10.5220/0011906200003536
In Proceedings of the 3rd International Symposium on Water, Ecology and Environment (ISWEE 2022), pages 83-89
ISBN: 978-989-758-639-2; ISSN: 2975-9439
Copyright
c
2023 by SCITEPRESS – Science and Technology Publications, Lda. Under CC license (CC BY-NC-ND 4.0)
83
automobile industry with CAFC and NEV credit.
The innovation of this paper is to discuss the
optimal pricing and decision-making of GV and EV
produced by automobile enterprises in credit form,
and to establish an equilibrium model, which is solved
by optimization theory and method, and studies the
influence of credit coefficient, oil price and electricity
price on the total social profit, and analyses how the
CAFC and NEV credit affects the operation decision
of the enterprise. Especially aiming at the checks and
balances between the policy measures and market
factors of EV, this paper analyses the policy-oriented
decision-making behaviour of enterprises.
The structure of this paper is as follows. In the
second section, a three-level supply chain model
composed of EV/GV manufacturers, governments
and customers is constructed, and the optimal
decision-making problem of automobile enterprises
under CAFC and NEV credit is explained. In the third
section, the conclusion analysis is carried out based
on the model, that is, taking the given variable as an
example, the numerical results of the model are given,
and the influence of electricity price, oil price and
credit coefficient on the total profit is analysed by the
combination of numbers and shapes. Finally, the
paper summarizes the research conclusions of this
paper in the fourth section and provides a reference
for the development of the industry. In order to fill the
gap in the vehicle industry area, especially the
sustainable development of EVs, this paper focuses
on the impact of the optimal pricing of the overall
policy on enterprise pricing by using the equilibrium
theory of game theory. Finally, the average profit
level of auto industry enterprises is affected by
pricing.
2 MODEL DESTRIBUTION
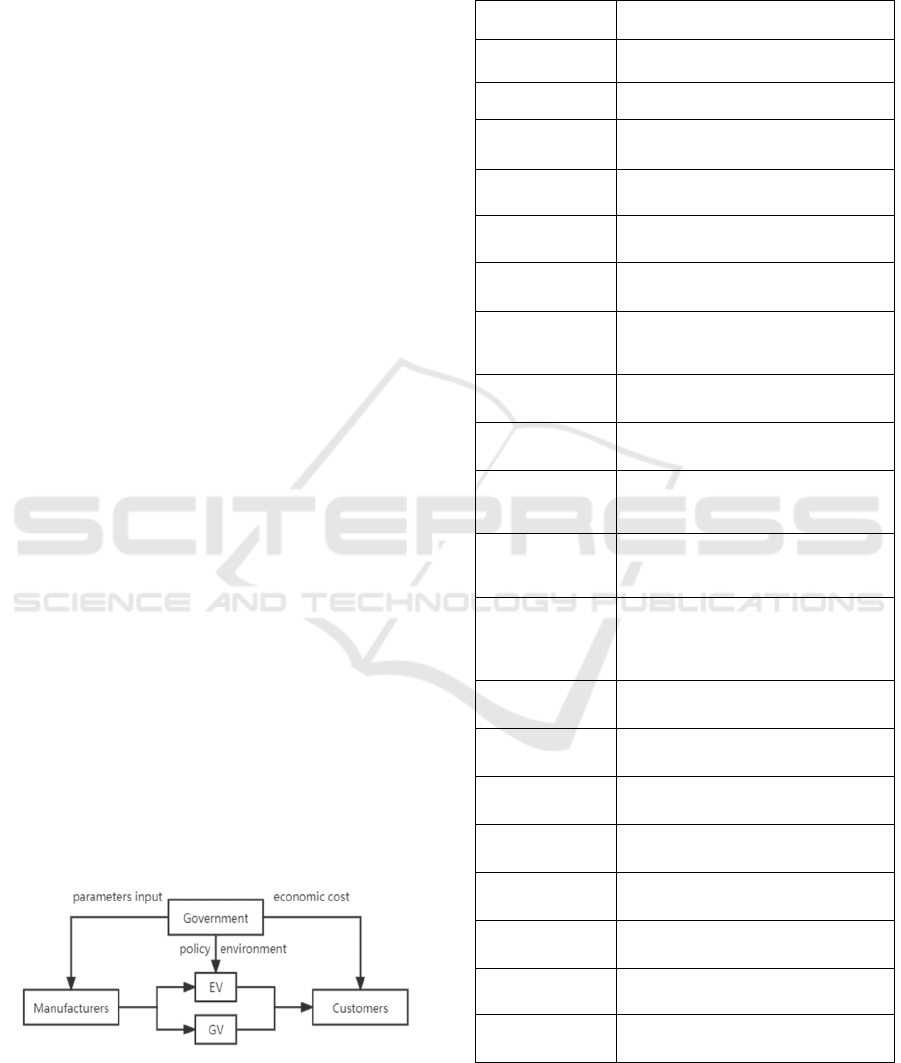
The model includes a tripartite relationship between
vehicle manufacturers, consumers and government,
as shown in Figure 1 below.
Figure 1: Model structure.
All the
parameters
and notations used in this paper are
shown in the table below.
Table 1: Parameters and notations
𝑆𝑦𝑚𝑏𝑜𝑙
Meaning
𝑘
Customer’s willingness to buy a
car 0 < k < 1
𝐿
Vehicle’s lifecycle (year)
𝑀
Average driven mileage per year
(km/year)
𝑝
fuel
/𝑝
elec
Price of fuel(£/L)/electricity
(£/kWh)
𝑒
fuel
/𝑒
elec
Mileage per fuel unit
(km/L)/electricity unit (km/kWh)
𝑣
Time value (£/h)
𝐻
refuel
/𝐻
recharging
Time cost in each fuel
refilling(h)/electricity recharging
(
h
)
𝑉
gv
/𝑉
ev
Gasoline tank volume (L)/ Battery
volume (kWh)
π
gv
/π
ev
GV/EV driving experience utility
(£)
𝐶
gv
/𝐶
ev
The total cost in GV/EV’s full life
cycle
θ
gv
,θ
ev
Environmental protection
awareness level for GV/EV user
(£)
𝐶
/𝐶
Negative Credits (Credits deducted
for one fuel car)/Positive Credits
(Credits added by one electric
vehicle
)
𝑝
Mgv
/𝑝
Mev
GV/EV manufacturer cost (£)
𝑝
Cgv
/𝑝
Cev
GV/EV price paid to the
manufacturer (£)
𝑃
gv
/𝑃
ev
The probability of buying a
GV/EV
𝑚
/
𝑚
𝑝
Money awarded for one unit of
Negative Credits / Positive Credits
𝑏
/𝑏
Regulation factor
𝐶
Annual treatment cost for carbon
dioxide treatment
π
Mgv
/π
Mev
Profit for GV/EV manufacturer (£)
π
gov
The social entire profit
For model simplification, we assume that 𝑘 satisfies
0≤𝑘≤1, where 𝑘=0 means customer will not
buy a car and 𝑘=1 means customer will buy a car.
ISWEE 2022 - International Symposium on Water, Ecology and Environment
84
Over the life cycle of a vehicle, costs include the
cost of fuel or electricity and the cost of time,
expressed by the equation:
𝐶
gv
=
fuel
fuel
+
refuel
fuel
gv
(1)
𝐶
ev
=
elec
elec
+
recharging
ev
(2)
We define the utility functions for fuel and electric
vehicle customers as:
𝑈
Cgv
=−𝐶
gv
+𝜃
gv
+𝜋
gv
𝑘 −𝑝
Cgv
=𝑣
gv
𝑘−𝑝
Cgv
(3)
𝑈
Cev
=
(
−𝐶
ev
+𝜃
ev
+𝜋
ev
)
𝑘−𝑝
Cev
=𝑣
ev
𝑘−𝑝
Cev
(4)
Moreover, we have following assumptions of this
model:
(1) User’s profit of GV and EV is unequal which
means 𝑣
>𝑣
ev
;
(2) According to Gu et al. (2016),
customers are
rational, so they will choose those with a high utility
function, i.e., good value for money.
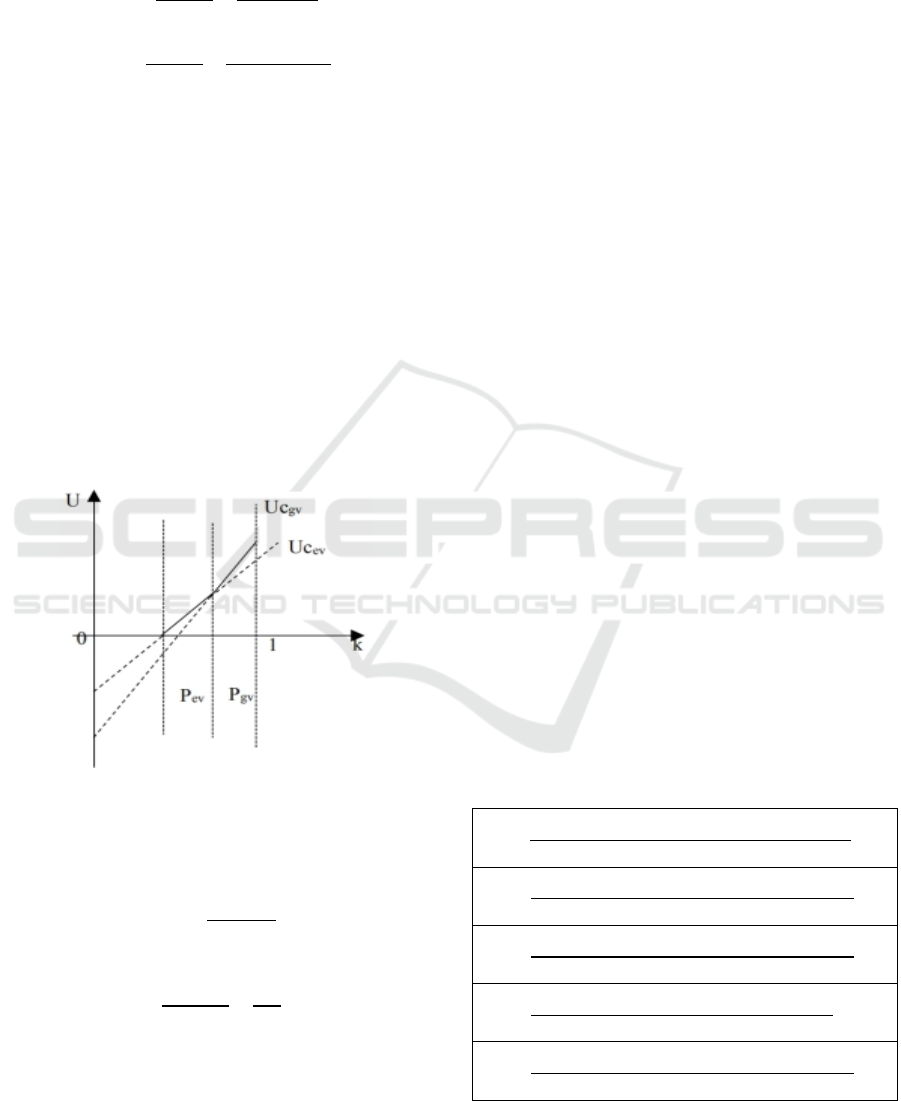
Table 2 indicates the probability of people buying an
electric and fuel car.
Figure 2: GV/EV usage utility with different purchase
intention in EV early development stage.
It is easy to find that the probability of buying a GV
is
𝑃
gv
=1−
Cgv
Cev
gv
ev
(5)
The probability of purchasing an EV is
𝑃
ev
=
Cgv
Cev
gv
ev
−
Cev
ev
(6)
For credits, we require the positive credits minus the
negative credits to be greater than 0.
𝑏
𝐶
−𝑏
𝐶
=𝑅 (R>0) (7)
So, the profit for a car manufacturer to produce a fuel
car is
π
Mgv
=𝑃
gv
𝑝
Cgv
−𝑝
Mgv
−𝐶
𝑚
(8)
And the profit from the production of an electric
vehicle is
π
Mev
=𝑃
ev
𝑝
Cev
−𝑝
Mev
𝐶
𝑚
(9)
Based on lemma 1, we can work out the best price:
𝑝
Cgv
=𝐴
𝐶
+𝐴
𝐶
+
(
𝐴
+𝐴
)
(10)
𝑝
Cev
=
𝐴
𝐶
+𝐴
𝐶
+
(
𝐴
+𝐴
+𝐴
+𝐴
+𝐴
)
(11)
(To simplify the expressions and highlight the focus
of the study, we replace all the coefficients before 𝐶
and 𝐶
with a new variable, such as A1, A2 in table2,
in order to subsequently visualize the relationship
between total social profit and the key study
variables).
Therefore, the probability about purchasing an GV is
𝑃
gv
=𝐵
𝐶
+𝐵
𝐶
+𝐵
(12)
And the possibility of buying an EV is
𝑃
ev
=𝐵
𝐶
+𝐵
𝐶
+𝐵
(13)
In turn, we can find the profits of car manufacturers
producing fuel and electric vehicles:
π
Mgv
=𝐵
𝐶
+𝐵
𝐶
+𝐵
𝐴
𝐶
+𝐴
𝐶
+(𝐴
+
𝐴
)−𝐶
𝑚
−𝑝
Mgv
(14)
π
Mev
=𝐵
𝐶
+𝐵
𝐶
+𝐵
𝐴
𝐶
+𝐴
𝐶
+(𝐴
+
𝐴
+𝐴
+𝐴
+𝐴
)+𝐶
𝑚
−𝑝
Mev
(15)
In order to optimize the total profit of the vehicle
manufacturer, we define
π
gov
=π
Mev
+π
Mgv
−𝐶
=𝑇
𝐶
𝐶
+𝑇
𝐶
+
𝑇
𝐶
+𝑇
𝐶
+𝑇
𝐶
+𝑇
(16)
All formulas mentioned above are expressed in Table
2 below.
Table 2: Simplifying expressions.
𝐴
=
2𝑚
𝐶
gv
−
θ
gv
−π
gv
−𝐶
ev
+4𝐶
g
v
+
θ
ev
+π
ev
−4
θ
g
v
−4π
g
v
𝐴
=
𝑚
𝐶
g
v
−
θ
g
v
−π
g
v
−𝐶
e
v
+4𝐶
gv
+
θ
e
v
+π
e
v
−4
θ
gv
−4π
gv
𝐴
=
𝐶
g
v
−
θ
g
v
−π
g
v
2𝐶
e
v
−2𝐶
g
v
+𝑝
Me
v
−𝐶
e
v
+4𝐶
g
v
+
θ
e
v
+π
e
v
−4
θ
g
v
−4π
g
v
𝐴
=
2
𝐴
−
θ
e
v
−π
e
v
+
θ
g
v
+π
g
v
+𝑝
Mg
v
2𝐶
e
v
−2𝐶
gv
+𝑝
Me
v
𝐴
=
2𝑚
𝐶
g
v
−
θ
g
v
−π
g
v
−𝐶
e
v
+4𝐶
g
v
+
θ
e
v
+π
e
v
−4
θ
g
v
−4π
g
v
Pricing Strategies for Vehicle Production Under the Corporate Average Fuel Consumption and New Energy Vehicle Credit Policy
85

𝐴
=
𝑚
(
−𝐶
e
v
+
θ
e
v
+π
e
v
)
𝐶
ev
−4𝐶
gv
−
θ
ev
−π
ev
+4
θ
gv
+4π
gv
𝐴
=
−𝐶
e
v
+π
e
v
π
g
v
+π
e
v
𝑝
Mg
v
−π
e
v
+2π
g
v
𝑝
Me
v
𝐶
ev
−4𝐶
gv
−
θ
ev
−π
ev
+4
θ
gv
+4π
gv
𝐴
=
π
g
v
θ
e
v
−2π
e
v
θ
e
v
+
θ
e
v
𝑝
Mg
v
𝐶
ev
−4𝐶
gv
−
θ
ev
−π
ev
+4
θ
gv
+4π
gv
𝐴
=
−𝐶
g
v
(
θ
e
v
+π
e
v
+2𝑝
Me
v
)
−
θ
e
v
𝐶
ev
−4𝐶
gv
−
θ
ev
−π
ev
+4
θ
gv
+4π
gv
𝐴
=
𝐶
ev
𝐶
gv
+2
θ
ev
+2π
ev
−
θ
gv
−π
gv
−𝑝
Mgv
𝐶
e
v
−4𝐶
g
v
−
θ
e
v
−π
e
v
+4
θ
g
v
+4π
g
v
𝐴
=
π
e
v
θ
g
v
+
θ
e
v
θ
g
v
+2
θ
g
v
𝑝
Me
v
𝐶
ev
−4𝐶
gv
−
θ
ev
−π
ev
+4
θ
gv
+4π
gv
𝐵
=
𝐴
−
𝐴
𝑣
e
v
−𝑣
gv
𝐵
=
𝐴
−
𝐴
𝑣
e
v
−𝑣
gv
𝐵
=
(
𝐴
+
𝐴
)
−
(
𝐴
+
𝐴
+
𝐴
+
𝐴
+
𝐴
)
𝑣
e
v
−𝑣
g
v
+1
𝐵
=
𝐴
𝑣
g
v
−
𝐴
𝑣
e
v
𝑣
e
v
𝑣
e
v
−𝑣
g
v
𝐵
=
𝐴
𝑣
g
v
−
𝐴
𝑣
e
v
𝑣
e
v
𝑣
e
v
−𝑣
g
v
𝐵
=
(
𝐴
+
𝐴
+
𝐴
+
𝐴
+
𝐴
)
𝑣
g
v
−
(
𝐴
+
𝐴
)
𝑣
e
v
𝑣
e
v
𝑣
e
v
−𝑣
g
v
𝑇
=𝐵
𝐴
+𝑚
+
𝐴
𝐵
𝑇
=𝐵
(
𝐴
−𝑚
)
+
𝐴
𝐵
𝑇
=
⎝
⎜
⎛
𝐵
𝐴
+𝑚
+𝐵
𝐴
+
𝐴
+
𝐴
+
𝐴
+
𝐴
−𝑝
Mev
+𝐵
(
𝐴
+
𝐴
)
−𝑝
Mg
v
+
𝐴
𝐵
⎠
⎟
⎞
𝑇
=
⎝
⎜
⎛
𝐵
(
𝐴
−𝑚
)
+𝐵
𝐴
+
𝐴
+
𝐴
+
𝐴
+
𝐴
−𝑝
Mev
+𝐵
(
𝐴
+
𝐴
)
−𝑝
Mg
v
+
𝐴
𝐵
⎠
⎟
⎞
𝑇
=𝐵
(
𝐴
−𝑚
)
+𝐵
𝐴
+𝑚
+
𝐴
𝐵
+
𝐴
𝐵
𝑇
=𝐵
(
𝐴
+
𝐴
+
𝐴
+
𝐴
+
𝐴
)
−𝑝
Me
v
+𝐵
(
𝐴
+
𝐴
)
−𝑝
Mg
v
3 NUMERICAL ANALYSIS AND
DISCUSSION
In this section, we analyse the above model and
analyse the parameters in the model based on
mathematical examples
3.1 Numerical Example
The initial values for each variable are shown in Table
3 below.
Table 3: Value of initial variables:
𝑴
L1
=𝟏𝟎𝟎𝟎𝟎
𝑳=𝟏𝟎 𝒑
fuel
=𝟏
𝒑
elec
=𝟎.𝟓 𝑒
fuel
=10 𝑒
elec
=6
𝒗
𝒕
=𝟖 𝐻
refuel
=0.15
𝐻
recharging
=0.5
𝑽
gv
=𝟓𝟎
𝑉
e
v
=400
θ
gv
=3000
𝛉
e
v
=𝟓𝟎𝟎𝟎
π
g
v
=120000
π
e
v
=105000
𝒑
Mg
v
=𝟏𝟒𝟎𝟎𝟎
𝑝
Me
v
=15000 𝑚
=3000
𝒎
𝒑
=𝟒𝟎𝟎𝟎 𝑏
=3 𝑏
=4
R=5
𝐶
envir
=50
Through substituting initial values above into
equation (16), we can find that equation (16) is a
quadratic function on 𝐶
, and in order to maximize
profit, the optimal value of positive credits𝐶
and
negative credits 𝐶
of can be derived as.
𝐶
=1.4685 (17)
𝐶
=0.2913 (18)
And the total profit is:
𝜋
= 8055.14 (19)
Specifically, these results means that the average
production of an electric car will give the company
1.4685 CAFC Credits and the average production of
a fuel car will give the company 0.2913 NEV credits,
at which point the average production of an electric
ISWEE 2022 - International Symposium on Water, Ecology and Environment
86
car and a fuel car will bring the company a profit of
8,055.14. The CAFC Credits factor is much larger
than the NEV credits factor, which encourages
enterprises to produce electric vehicles and reduce the
number of fuel vehicles, which is conducive to the
implementation of CAFC and NEV credit policy.
3.2 Analysis
Using the above values for 𝐶
and 𝐶
as reference
values, we discuss the impact of each parameter in the
model on total profit.
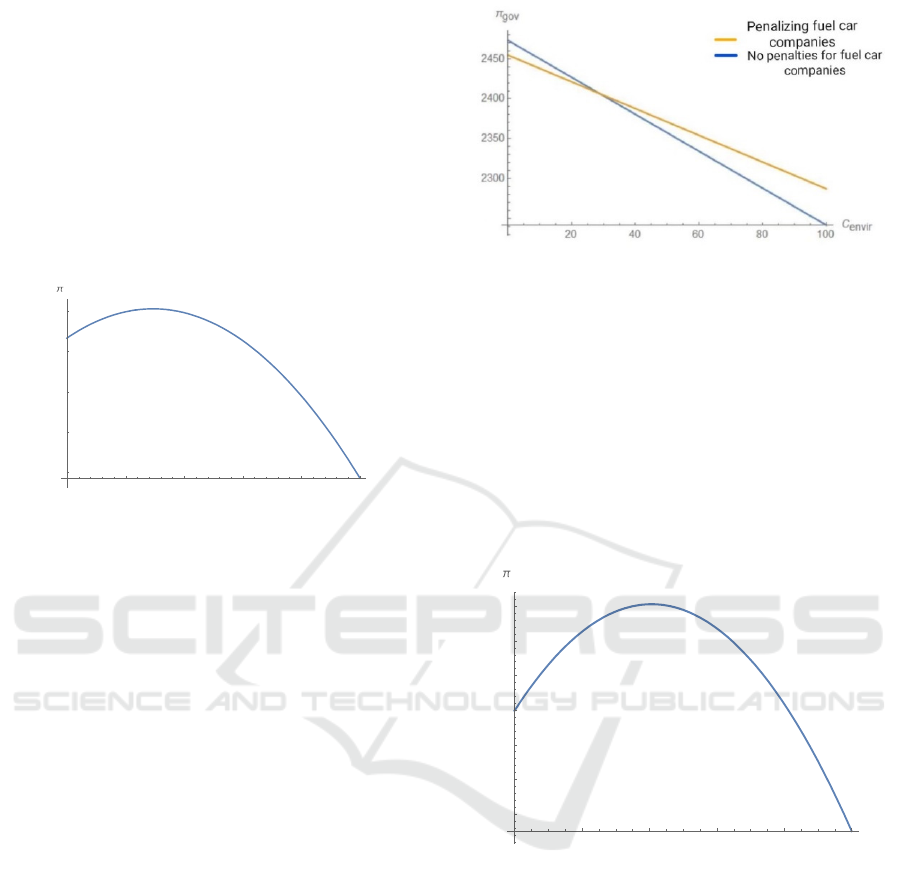
Figure 3: Impact of Positive Credits vs total profit.
Figure 3 indicates that there is an
optimal value of 𝐶
that
maximizes the total profit, the value of 𝐶
found in
3.1 section. There is an optimal value of 𝐶
that
maximizes total social profit. The reality behind is
that the subsidies for electric vehicle enterprises
should not be too high, too high policy subsidies will
affect the profitability of fuel companies, but also lead
to a decline in the competitiveness of electric vehicle
enterprises themselves.
Moreover, as can be seen in Figure 4 below, the
blue line indicates 𝐶
=0 (no penalty for fuel car
producing enterprises) and the yellow line indicates
𝐶
≠0 (penalty for fuel car producing enterprises).
When the cost of environmental treatment is low, the
total social profit of not penalizing fuel car producing
enterprises is higher than that of penalizing fuel car
producing enterprises; when the cost of
environmental treatment is high, the total social profit
of penalizing fuel car producing enterprises is higher
than that of not penalizing fuel car producing
enterprises.
Figure 4: 𝐶
(Environmental treatment cost) vs total
profit.
We find that the total profit as a function of 𝑚
is
a quadratic function with a downward opening when
𝑚
is fixed. As 𝑚
increases, the axis of symmetry and
the maximum value of the total profit as a function of
𝑚
become larger. The reverse is also true. And by
doing the calculations, we can find the range of total
profit.
5233.45≤π
gov
≤11504. (0<𝑚
<8000,
0<𝑚
<8000)
Figure 5: 𝑚
(Money awarded for one unit of Negative
Credits) vs total profit.
Then we then discuss the impact of oil and
electricity prices on total profits. Figure 6 shows the
image of total profit as a function of oil price at an
electricity price of 0.5
1 2 3 4 5
cp
5000
6000
7000
8000
gov
2000 4000 6000 8000 10 000
mp
2
000
3
000
4
000
5
000
6
000
7
000
8
000
gov
Pricing Strategies for Vehicle Production Under the Corporate Average Fuel Consumption and New Energy Vehicle Credit Policy
87

Figure 6: Oil price vs total profit.
Total profit decreases with increasing oil prices
between approximately 0 and 2.
Figure 7 shows the image of total profit as a
function of electricity price at an oil price of 1.
Figure 7: Electricity price vs total profit.
As can be seen, total profit increases with the price of
electricity between approximately 0 and 5. Finally,
we discuss the effect of the coefficients of 𝐶
and 𝐶
on total profit.
Figure 8 shows the effect of 𝑏
on total profit
when 𝑏
is 3 while Figure 9 shows the effect of 𝑏
on
total profit when 𝑏
is 4. ( 𝑏
is equal to 4 to ensure
that the value of 𝐶
is greater than 0).
Figure 8: The effect of 𝑏
on total profit when 𝑏
is 3.
Figure 9:
The effect of 𝑏
on total profit when 𝑏
is 4.
The larger the 𝑏
(Factor to adjust the ratio of 𝐶
to 𝐶
), the larger the𝐶
, the greater the penalty for
producing fuel cars, and the lower the total social
profit. The larger the 𝑏
(Factor to adjust the ratio of
𝐶
to 𝐶
), the smaller the 𝐶
,the smaller the penalty
for producing fuel cars, and the higher the total social
profit. We can optimize the total social profit by
appropriately adjusting the ratio of 𝐶
to 𝐶
.
4 CONCLUSION
This paper examines the profits of car manufacturers
and the impact of each factor on total profits under the
CAFC and NEV credit policy. We have the following
conclusions:
(1) The effect of 𝐶
and 𝐶
on total profit is a
quadratic function, there is an optimal value of 𝐶
and
𝐶
that maximises total profit. For the government,
the policy of double points should be stipulated
according to the market conditions to maximize the
total social profit. In the examples in this paper, the
optimal values for 𝐶
and 𝐶
are 1.4685 and 0.2913,
the car manufacturer should deduct 0.2913 credits for
the production of a fuel car and add 1.2865 credits for
the production of an electric car.
(2) The effect of 𝑚
and 𝑚
on total profit is also a
quadratic function. In order to increase the proportion
of electric vehicles, we should improve the utility it
brings to consumers, such as raising oil prices,
reducing electricity charges or giving more incentives
to 𝐶
, which can better increase the proportion of
electric vehicles.
(3)
For the market, the specific pricing of 𝐶
and𝐶
will be affected by the proportion of fuel vehicles and
electric vehicles. This simplifies the quantitative
relationship between them. In combination with the
above discussion on oil price, electricity price and
0.5 1.0 1.5 2.0
pfuel
2000
4000
6000
8000
10
000
12000
go
v
1 2 3 4 5
pfuel
5000
10
000
15000
2
0
000
gov
2 4 6 8 10
bp
16
000
1
7
000
18
000
19
000
2
0
000
gov
2 4 6 8 10
bn
17
600
17800
18
000
18
200
gov
g
ISWEE 2022 - International Symposium on Water, Ecology and Environment
88

annual environmental treatment cost to the total social
profit, the current domestic oil price is generally too
high, the electricity price is relatively cheap, and the
annual environmental treatment cost is high.
Therefore, it is necessary to support the development
of electric vehicle enterprises and punish the fuel
vehicle enterprises. In combination with the national
carbon neutral policy and from the perspective of
long-term development, it is necessary to punish
electric vehicles. Although this punishment will affect
the total social profit in the short term, it is necessary
in the long term.
To summarise, this paper expands on the
application of CAFC and NEV credit in the
automotive sector and can provide a reference for
those in this industry.
We hope to complete the
structural transformation of the automobile industry,
promote the development of new energy vehicles,
help achieve carbon neutrality and achieve
sustainable social development by implementing
CAFC and new energy automobile credit. In the
future, we will discuss in more depth the impact of the
CAFC and NEV policy on other parts of electric
vehicles, especially on the battery industry.
ACKNOWLEDGEMENT
This research is funded by project supported by the
National Science Foundation (Grant No. 71901121,
71972101, 71931006); and Support by Fundamental
Research Funds for the Central Universities (Grant
No. 30919013202).
REFERENCES
Gu X , Ieromonachou P , Li Z . A game theory approach in
subsidizing electric vehicle supply chain[C]// 2016
International Conference on Logistics, Informatics and
Service Sciences (LISS). IEEE, 2016.
Li Y, Zhang Q, Li H et al (2019) The impact of Dual-credit
Scheme on the Development of the New Energy
Vehicle Industry. Elsevier Ltd, Hong Kong, China
Ma, H., Lou, G., Fan, T., Chan, H. and Chung, S., 2022.
Conventional automotive supply chains under China's
dual-credit policy: fuel economy, production and
coordination.
Ou S, Lin Z, Qi L et al (2018) The dual-credit policy:
Quantifying the policy impact on plug-in electric
vehicle sales and industry profits in China. Energy
Policy 121:597–610
Wang, Y., Zhao, F., Yuan, Y., Hao, H. and Liu, Z., 2022.
Analysis of Typical Automakers’ Strategies for
Meeting the Dual-Credit Regulations Regarding CAFC
and NEVs.
Yin, Y., Zhan, Z. (2021). Research on “Dual-Credits”
Policy of Automobile Enterprises. In: Proceedings of
China SAE Congress 2019: Selected Papers. Lecture
Notes in Electrical Engineering, vol 646. Springer,
Singapore.
Yang, DX., Yang, L., Chen, XL. et al. Research on credit
pricing mechanism in dual-credit policy: is the
government in charge or is the market in charge?.
Environ Dev Sustain (2022).
Yu, Y., Zhou, D., Zha, D., Wang, Q. and Zhu, Q., 2021.
Optimal production and pricing strategies in auto
supply chain when dual credit policy is substituted for
subsidy policy.
Liu, D., Xiao, B. 2018. Exploring the development of
electric vehicles under policy incentives: A scenario-
based system dynamics model, Energy Policy, vol. 120,
pp. 238-249.
Diwu. S, Zhang. X, 2016. Dual-channel ordering strategy of
new energy vehicles, 2016 International Conference on
Logistics, Informatics and Service Sciences (LISS),
2016, pp. 1-5.
Xu. X, Tao. R, 2021. Study on Supply Chain Pricing
Strategy of Government-Subsidized Manufacturers.
2021 5th Annual International Conference on Data
Science and Business Analytics (ICDSBA), 2021, pp.
554-559.
Pricing Strategies for Vehicle Production Under the Corporate Average Fuel Consumption and New Energy Vehicle Credit Policy
89
