
Assessment of Streamflow Characteristics in a Watershed Using Flow
Duration Curves and Hydrograph Analysis
Deepa Varghese G. S.
1a
, Mohandas Chadaga
2b
, U. A. Lathashri
2c
, Surumi Rasia Salim
1d
,
Atma Jyoti
2e
and Som Pant
2f
1
Department of Civil Engineering, Manipal Academy of Higher Education, Dubai, U.A.E.
2
Department of Civil Engineering, Manipal Institute of Technology, Manipal Academy of Higher Education, Manipal, India
surumi.rasia@manipaldubai.com, atmajyoti00@gmail.com, sompant98@gmail.com
Keywords: Baseflow, Base Flow Index, Flow Duration Curves, Hydrograph Analysis.
Abstract: Assessment of streamflow characteristics can be considered as one of the most important evaluations that
need to be performed in a watershed for water use planning, implementation of various restoration projects
and the validation of its effectiveness. Out of the several available methods, flow duration curves (FDC) and
hydrograph analysis can be considered as the most effective and simplest methods to assess the flow
characteristics of a stream. The present study aims to evaluate the seasonal variations in the flow
characteristics of one of the important rivers in central Kerala, India, the Meenachil river. The study was done
by interpreting the Base Flow Index (BFI) values of seasonal FDCs and baseflow separation technique using
data from 4 stream gauging stations in the catchment. As per the analysis, the river presented intermittent
flows with variably gaining and losing river reach along its course. This intermittent nature of the stream was
distinctly revealed through the full time FDCs sustaining flows for 47% of time on the upstream reaches to
72%, 62% and 78% progressing towards the downstream. The baseflow contribution to the stream was
greatest during the SW monsoon season for all the stations, particularly station 4 recording a maximum of
40.8 cumecs. The BFI values calculated using both sliding interval method and FDC were comparable and
presented a very good appraisal on the seasonal variations in the streamflow.
1 INTRODUCTION
The Flow-Duration Curve (FDC) is a cumulative
frequency curve that shows the percentage of time
specified discharges were met or exceeded in a
particular period (Searcy, 2011). In a simpler
definition, the flow-duration curve is a technique of
displaying streamflow data by integrating the flow
characteristics of a stream over a wide variety of
discharge ranges into a single curve. Even though, the
chronological sequence of flows is not reflected, the
flow-duration curve is helpful in many studies (Singh,
2015) such as reservoir sedimentation(Strand and
Pemberton 1982), water quality management
(Searcy, 1959) etc. The curve is made to average the
plotted points of specified discharges against the
a
https://orcid.org/0000-0002-6493-9784
b
https://orcid.org/0000-0003-0967-8902
c
https://orcid.org/0000-0001-5709-1626
d
https://orcid.org/0000-0002-0883-6545
percent of the time they were equaled or surpassed,
rather than the flow distribution within a single year.
As a result, FDCs are excellent instruments for
studying the catchment hydrological behavior and
streamflow characteristics since their shape and slope
indicate the at-site flow variability circumstances, as
well as the catchment's flood-formation dynamics and
low-flow features (Costa et.al., 2020). The flow-
duration curve applies only to the period for which
data is used to create the curve or to the period for
which the curve is strictly altered. FDCs represent the
sustainability of stream flows at a river cross-section
over a specified time interval, commonly a day, week,
or month (Vogal and Fennessey,1994;
Smakhtin, 2001). Complete years of records should
be utilized to generate a full-time flow-duration
90
S., D., Chadaga, M., Lathashri, U., Salim, S., Jyoti, A. and Pant, S.
Assessment of Streamflow Characteristics in a Watershed Using Flow Duration Curves and Hydrograph Analysis.
DOI: 10.5220/0011907500003536
In Proceedings of the 3rd International Symposium on Water, Ecology and Environment (ISWEE 2022), pages 90-95
ISBN: 978-989-758-639-2; ISSN: 2975-9439
Copyright
c
2023 by SCITEPRESS – Science and Technology Publications, Lda. Under CC license (CC BY-NC-ND 4.0)

curve; partial years should be avoided. However,
seasonal data can also be used to generate seasonal
flow-duration curves. The FDCs find its important
application in hydro power potential studies (Hickox
et.al., 1933; Barrows, 1943; Yizhi et.al.,2020). The
upper end of FDCs is widely used in several studies
related to flood assessment (Pettis, 1934; Beard,
1943; Gómez-Llanos et.al.,2018).
Stream hydrograph is a graphical representation
of the total flow carried in a stream against the
duration of streamflow. It is ideally considered to be
representing three components of flow viz., direct
runoff (which is the quick response of streamflow to
precipitation), base flow (which is the contribution
from the adjacent aquifer to the streamflow) and
interflow which is following a shallow subsurface
pathway to the stream (which is usually ignored
assuming that it can be a part of either the surface
runoff or the base flow). Baseflow separation
technique is a very efficient tool which can be used to
separate the baseflow from streamflow (Stewart,
2015). The clear distinction in the baseflow and direct
runoff generation process is very evident in the shape
and slope of the two recession curves generated. This
justifies the requirement of separating the two
components of streamflow (Hewlett, 1967). The
watershed management practices could be dependent
on the contribution of baseflow to the stream
(Wondmyibza et.al., 2021). For example, overdraft
from wells to meet the domestic and agricultural
requirements, deterioration of water quality, pressure
on surface and groundwater resources in drought
prone areas etc. The baseflow contribution to the
Meenachil river is yet unknown. Thus, the main
objective of this paper is to interpret the BFI values
generated using FDCs and hydrograph separation
method to evaluate the seasonal variation in
streamflow. This could be very effective in watershed
management studies.
2 STUDY AREA AND DATA
COLLECTION
Meenachil river originates from the Araikunnumudi
at an elevation of approximately 1100 m above MSL
and finds its way to the Vembanad lake. The
Meenachil watershed, in the district of Kottayam,
Kerala, India, experiences a tropical monsoon climate
receiving excess rainfall during monsoon seasons and
hot conditions in summer. The watershed receives
rainfall primarily during the southwest and northeast
monsoon seasons. The flooding of river during
monsoon seasons is an annual event that occurs from
June to September resulting in over-toping the banks
and inundation of the low-lying lands. The Meenachil
river extends 78 km long draining a total area of
1272km
2
, stretching between 9° 32’ to 9°50’ N
latitudes and 76°29’ to 76°56’ E longitudes (Deepa
et.al., 2022) (Figure 1). The Meenachil river is
uniquely characterized by human settlement right
from its origin at the Western ghats to its culmination
in the Arabian sea.
Figure 1: Meenachil watershed and location of stream
gauge stations
Daily streamflow data was obtained from
Irrigation Design and Research Board (IDRB),
Trivandrum at four stations viz., station 1 (24 years),
station 2 (22years), station 3 (23 years) and station 4
(25 years). The analysis was done for a period of only
17 years since comparison of results were required to
be done for all the 4 stations using concurrent data.
The years of missing data were excluded from the
analysis.
3 METHODOLOGY
With the aim of presenting a cumulative perspective
on the potential of the river to sustain its flows
through baseflow contribution, the flow data were
analysed using the flow duration curves (FDCs) and
hydrograph separation technique. Using the FDC
method and sliding interval method of hydrograph
analysis, the baseflow index (BFI) was calculated and
compared. For uniformity and easier comparison,
these methods were applied considering concurrent
time periods of data at four steam gauging stations
viz., Station 1, Station 2, Station 3 and Station 4
(Figure 1) in the watershed. The concurrent time
periods selected for the study spanned across four
Assessment of Streamflow Characteristics in a Watershed Using Flow Duration Curves and Hydrograph Analysis
91

seasons viz., pre-monsoon from April to May, south-
west(SW) monsoon from June to August, post
monsoon in September and north-east(NE) monsoon
from October to November.
The following essential points were taken into
consideration for generating the flow duration curves
and baseflow separation using the stream flow data.
(i) The period of data with no missing records,
obtained from the Irrigation Design and Research
Board (IDRB), Trivandrum were used in the
study.
(ii)
The physical conditions in the basin were ensured
to be the same during the period of data collected.
4 RESULTS AND DISCUSSION
4.1 Seasonal Discharge Analysis
The streamflow data at the 4 gauging stations were
carefully reviewed to record the maximum and
minimum discharge values (Table 1).
Table 1: The minimum, average and maximum discharge
recorded at the 4 stations.
Discharge Parameters in cumecs
Season Station Minimum Average Maximum
Pre-
Monsoon
1 0 1.05 59.48
2 0 7.818 224.66
3 0 8.324 181.36
4 0 22.33 443.56
SW-
Monsoon
1 0 11.81 211.72
2 0 43.88 363.8
3 0 43.85 826.82
4 0 116.7 877.06
Post SW
Monsoon
1 0 6.724 98.35
2 4.16 33.34 395.02
3 0 27.56 381.81
4 2.23 78.16 679.83
NE
Monsoon
1 0 3.999 207.63
2 3.03 23.15 341.72
3 0 25.57 392.95
4 2.98 76.48 532.3
Post NE
Monsoon
1 0 0.108 28.61
2 0 2.755 54.38
3 0 1.009 54.92
4 0 3.707 107.3
It is emphasized that, the watershed is
characterized to receive maximum discharge brought
in during the SW monsoon season followed by the NE
monsoon season. The flow detected during the pre-
monsoon season (April- May) are due to the frequent
intense showers, known as summer rains. However,
the river fades away into virtually a barren land in the
post monsoon season shortly after the NE monsoon
rains.
4.2 Baseflow Separation
The under lying assumption in the base flow
separation method is that base flow is equated to the
groundwater contribution which in many cases need
not be valid due to the unseen hydraulic connection
of any other drainage systems. Also, it may be altered
due to many anthropogenic influences like land use
changes due to urbanization, surface water extraction
or groundwater extraction for irrigation etc.
The hydrograph analysis generates an index
namely the base flow index (BFI) which is expressed
as the ratio of base flow to the total streamflow. The
built-in tool, BFI +3.0, of HydroOffice 2012 software
(Gregor, 2010a) was used in this analysis. The long-
term statistics of BFI and baseflow contribution using
the sliding interval method (Table 2) were calculated
and compared for all the 4 seasons. This method also
results in a rapid estimation of baseflow.
Table 2: Long term statistics of BFI and baseflow
contribution (in cumecs) using sliding interval method.
Seasons Indicator
Stations
1 2 3 4
Pre-
Monsoon
BFI 0.07 0.29 0.13 0.16
Base-flow 0.1 2.58 1.01 2.79
SW
Monsoon
BFI 0.33 0.54 0.45 0.48
Base-flow 2.79 17.4 12.9 40.8
Post SW
Monsoon
BFI 0.21 0.61 0.5 0.59
Base-flow 0.81 13.7 10.6 35
NE
Monsoon
BFI 0.13 0.58 0.39 0.43
Base-flow 0.29 10.1 8.99 24.3
The results of the baseflow analysis demonstrates
that the baseflow index (BFI) is highest during the
post monsoon season at all the stations expect
station 1. Thus, in this season the flow in the river is
sustained through strong baseflow contribution. The
rainfall received during the SW monsoon season in
the highland station 1, due to the steep terrain of the
land, gets quickly drained off and thus was not
available for groundwater recharge. Consequently,
ISWEE 2022 - International Symposium on Water, Ecology and Environment
92
the subsequent post monsoon season displays lesser
BFI portraying the lesser potential of the river to
sustain its flows through baseflow contribution in the
respective season. Moreover, at all the stations, the
amount of baseflow contribution was highest during
the SW monsoon season recording a maximum of
40.8 cumecs at station 4.
4.3 Flow Duration Curves
The percentage duration for which the river flow is
recorded in the gauging station gives an idea about
whether the stream can be classified as perennial,
intermittent or ephemeral (Karen, 2008).
Interpretation of FDC can provide a useful appraisal
on the geological characteristics of the watershed
(Winter, 2007). In this study, the potential of FDCs to
understand the extent of baseflow contribution to
sustain the stream flows in the river is demonstrated.
The flow duration curves were plotted using the daily
discharge values against percentage exceedance of
flow on a semi-logarithmic scale for obtaining a clear
display of the high and low flow values. The built-in
tool, FDC 2.1, of HydroOffice 2012 software
(Gregor, 2010b) was used in this analysis.
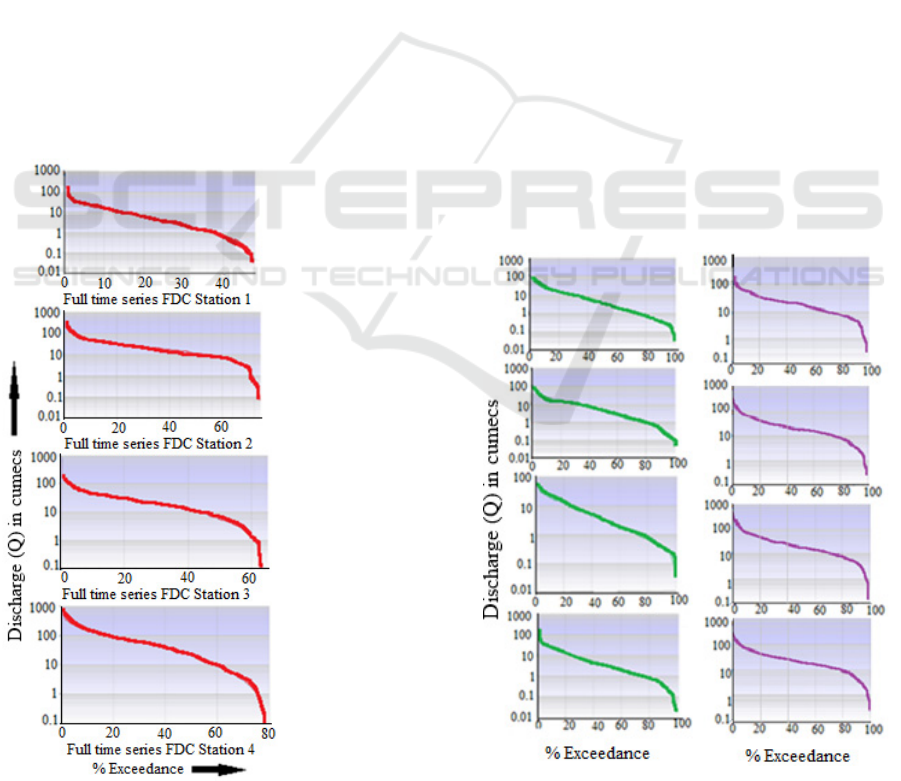
Figure 2: Full time series FDC (Station 1 to station 4).
The full time series for flow duration curve including
zero discharge values recorded in the gauging stations
of the watershed are presented in Figure 2. Station 1
carries discharge 47% of time which increases to
72%, 62% and 78% respectively towards downstream
stations 2, 3 & 4. The percentage of time for which
the river carries discharge from station 1 to station 4
reveals the type of hydraulic connection of the river
reach with the underlying aquifer. It was found to be
a variably gaining-losing river reach with dominated
direct runoff flows interposed with base flow events
from station 1 to 3 (Karen, 2008). However, from
station 3 to 4, the river reach could be expected to
change to a baseflow dominated river reach
interposed with direct runoff events.
The generated FDCs exhibited a steep slope
representing low or variable base flow contribution to
the stream. Figure 3 and Figure 4 presents the flow
duration curves across 4 different seasons viz., pre
monsoon, SW monsoon, post monsoon and NE
monsoon excluding the zero flow values. The
seasonal FDCs so developed can be used to determine
the Base flow Index values (BFI) which is the ratio of
Q
90
/Q
50
(Nathen et.al.,1990) as presented in Table 3.
High values of BFI index imply the potential of the
river to sustain its flows for long duration (R
Mohammed et.al., 2018). The results of the BFI using
FDC method were comparable with the results of
sliding interval method of hydrograph separation.
Figure 3: FDC@ station 1 and 2 across 4 seasons.
Assessment of Streamflow Characteristics in a Watershed Using Flow Duration Curves and Hydrograph Analysis
93
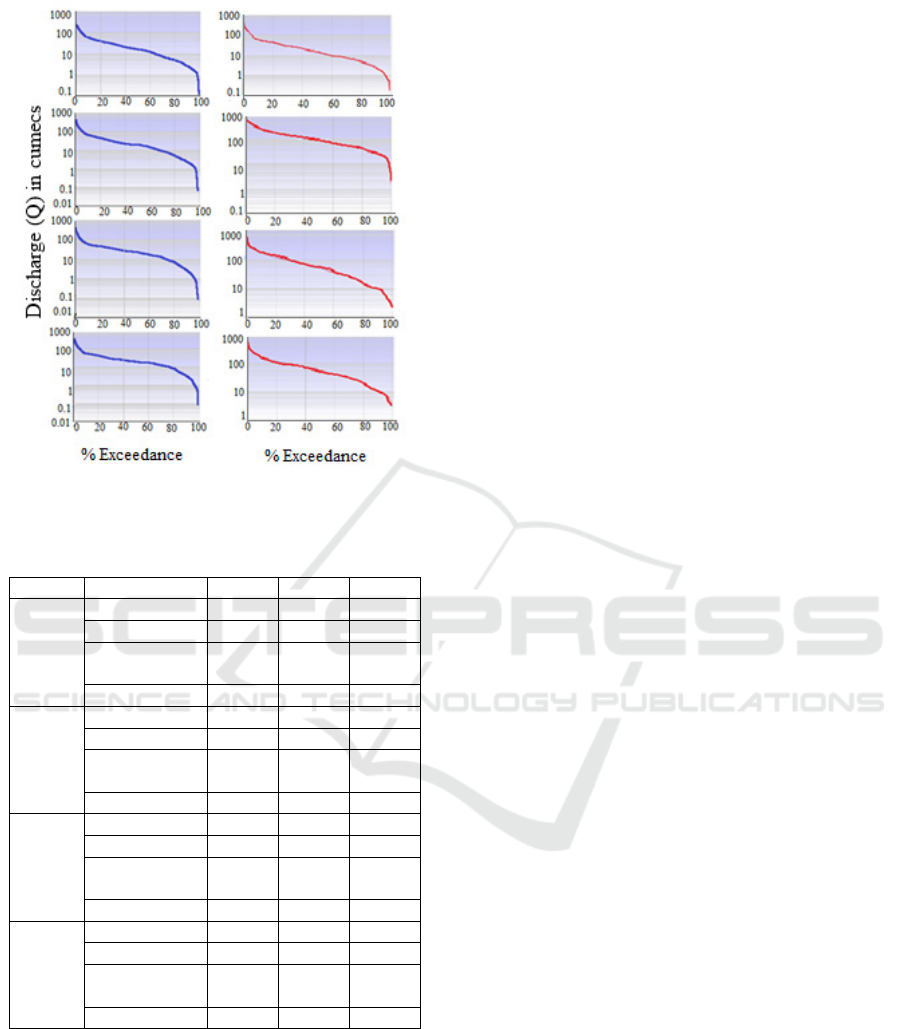
Figure 4: FDC@ station 3 and 4 across 4 seasons.
Table 3: Seasonal BFI (Q
90
/Q
50
) from upstream to
downstream stations.
Station Season Q
90
Q
50
BFI
Station
1
Pre-Monsoon 0.28 3.34 0.084
SW Monsoon 0.48 4.17 0.115
Post SW
Monsoon
0.36 3.14 0.115
NE Monsoon 0.32 3.19 0.1
Station
2
Pre-Monsoon 3.63 17.1 0.212
SW Monsoon 3.52 18.91 0.186
Post SW
Monsoon
0.3 17.37 0.017
NE Monsoon 4.19 20.15 0.208
Station
3
Pre-Monsoon 2.33 16.34 0.143
SW Monsoon 2.3 18.9 0.122
Post SW
Monsoon
2.67 22.57 0.118
NE Monsoon 3 20.1 0.149
Station
4
Pre-Monsoon 2.31 13.8 0.167
SW Monsoon 26.2 84.58 0.31
Post SW
Monsoon
8.78 46.14 0.19
NE Monsoon 10.94 55 0.199
5 CONCLUSIONS
The present study on assessment of the streamflow
characteristics and the potential of the river to sustain
its flows throughout the year was done using flow
duration curves and hydrograph analysis. The flow
regime in the watershed was evaluated to be a
variability gaining and losing reach across the
seasons. The flow duration curve presenting the
percentage duration in a year for which the river could
sustain its flow along its course varied from 47% of
time on the upstream station 1 to 72%, 62% and 78%
progressing towards downstream station 2, 3 & 4
respectively. This clearly proved the intermittent
nature of the river with alternatively gaining and
losing river reach dominated with direct runoff on the
upstream and baseflow events towards the
downstream. The BFI values (Q
90
/Q
50
) was found to
be maximum at station 2 for pre monsoon and NE
monsoon seasons and station 4 for SW and post SW
Monsoon seasons. Thus, the potential of the river to
sustain its flows upstream of station 2 and station 4
was also evident.
The shape of the FDC, particularly the lower end,
graphs the general characteristics of the shallow
aquifer. The steep slope exhibited by the curves in the
pre-monsoon and NE monsoon season in the gauging
station 1 represents poor groundwater contribution to
the stream. This is due to its location in the highland
region possessing considerably low groundwater
potential. However, the curve remains horizontal for
the SW and post monsoon seasons at the gauging
station 4. This can be due to high groundwater
contribution to the stream from the underlying
aquifers. A detailed analysis of the discharge data
using FDCs and the hydrograph analysis perceived
the greatest contribution to the stream through
baseflow in the SW and post monsoon seasons.
However, station 4 recorded the maximum of 40.8
cumecs in the SW monsoon season. The baseflow
index (BFI) calculated using the sliding interval
method yielded values increasing from station 1 to
station 4, across all four seasons. These values were
observed to be comparable with the BFI values
generated using FDC method. Thus, the interpretation
of FDC curves and results of baseflow analysis
generated a good insight into streamflow
characteristics and the potential of the river to sustain
its flows through baseflow contribution.
Further studies are required in the watershed for
thorough understanding of surface water and
groundwater resource problems. The study of surface
water groundwater interaction, the impact of
groundwater contribution to the stream under climate
change etc can be listed as few among the important
watershed management studies. The studies listed
above can prove to be very useful in formulating the
storage-outflow relationship between aquifer and
stream. It can also benefit in water resource planning
and development and for adopting watershed
ISWEE 2022 - International Symposium on Water, Ecology and Environment
94

management practices specifically to the Meenachil
watershed.
ACKNOWLEDGEMENTS
Authors would like to thank Manipal Academy of
Higher Education, Dubai for supporting the study by
providing the Research Grant for data collection.
Authors would also like to thank Irrigation Design
and Research Board (IDRB), Trivandrum for
providing the streamflow data.
REFERENCES
Barrows, H. K., 1943 Water power engineering: 3d ed.,791
p. New York, McGrawHill Book Co.
Beard, L. R., 1943, Statistical analysis in hydrology: Am.
Soc. Civil Engineers Trans., v. 108, p. 1110-1160.
Costa, V., Fernandes, W., & Starick, Â 2020 Identifying
Regional Models for Flow Duration Curves with
Evolutionary Polynomial Regression: Application for
Intermittent Streams. Journal of Hydrologic
Engineering, 25(1), 04019059.
https://doi.org/10.1061/(asce)he.1943-5584.0001873.
Deepa Varghese, G. S., Chadaga, M., Lathashri, U. A., &
Salim, S. R. 2022 Morphometric Analysis by Using
Remote Sensing & QGIS Approach to Evaluate the
Aquifer Response of Two Sub Watersheds of Coastal
Kerala. IOP Conference Series: Earth and
Environmental Science, 987(1).
https://doi.org/10.1088/1755-1315/987/1/012018.
Gregor Milos 2010a. BFI +3.0 User’s Manual. HydroOffice
Software package for water resources.
http://hydrooffice.org/.
Gregor Milos 2010b. FDC 2.1 User’s Manual. HydroOffice
Software package for water resources.
http://hydrooffice.org/.
Gómez-Llanos, E.; Arias-Trujillo, J.; Durán-Barroso, P.;
Ceballos-Martínez, J.M.; Torrecilla-Pinero, J.A.;
Urueña-Fernández, C.; Candel-Pérez, M. Department,
Hydropower Potential Assessment in Water Supply
Systems. Proceedings 2018, 2, 1299.
Hewlett, J. D. and Hibbert, A. R,1967. Factors affecting the
response of small watersheds to precipitation in humid
areas, in: Forest Hydrology, edited by: Sopper, W. E.
and Lull, H. W., Pergamon, Oxford, 275–290, 1967
Hickox, G. H. and Wessenauer, G. O., 1933, Application of
duration curves to hydro-electric studies; Am. Soc. Civil
Engineers Trans., v. 98, p. 1276-1308.
Karen M. Ivkovic 2008 A top–down approach to
characterize aquifer–river interaction processes.
Journal of Hydrology, 365 (2009) 145–55.
doi:10.1016/j.jhydrol.2008.11.021.
Nathan RJ, McMahon TA (1990) Evaluation of automated
techniques for base flow and recession analyses Water
Resources Research 26(7), 1465-1473.
Pettis, C. R., 1934, Discussion of duration curves by H. A.
Foster: Am. Soc. Civil Engineers Trains., v. 99, p.
1237-1240.
R. Mohammed & M. Scholz (2018) Flow–duration curve
integration into digital filtering algorithms for
simulating climate variability based on river baseflow,
Hydrological Sciences Journal, 63:10, 1558-1573,
DOI: 10.1080/02626667.2018.1519318
Searcy, J. K., 1959. Flow-Duration Curves. U.S. Geological
Survey Water Supply Paper 1542-A, 33 pp
Searcy, J.K. 2011. Flow‐duration curves manual of
hydrology: Part 2. Low‐flow techniques geological
survey water‐supply paper 1542‐A. Available at http://
pubs.usgs.gov/wsp/1542a/report.pdf
Singh, V 2015 Flow Duration Curve. Introduction to
Tsallis Entropy Theory in Water Engineering, 303–326.
https://doi.org/10.1201/b19113-16.
Smakhtin VU (2001) Low flow hydrology: a review. J
Hydrol 240:147–186.
Stewart M.K, 2015, Promising new baseflow separation
and recession analysis methods applied to streamflow
at Glendhu Catchment, New Zealand. Hydrol. Earth
Syst. Sci., 19, 2587–2603, 2015.
Strand, R. I., and Pemberton, E. L. (1982). "Reservoir
sedimentation." Tech. Guideline for Bureau of
Reclamation, U.S. Bureau of Reclamation, Denver,
Colo.
Vogal RM, Fennessey NM (1994) Flow duration curves. I.
A new interpretation and confidence intervals. J Water
Resour Plan Manag 120(4):485–504.
Winter, T.C., 2007 Role of ground water in generating
streamflow in headwater areas and in maintaining base
flow Journal of the American Water Resources
Association 43 (1), 15–25.
Wondmyibza Tsegaye Bayou, Stefan Wohnlich , Mebruk
Mohammed and Tenalem Ayenew (2021). Application
of Hydrograph Analysis Techniques for Estimating
Groundwater Contribution in the Sor and Gebba
Streams of the Baro-Akobo River Basin, Southwestern
Ethiopia. Water 2021, 13, 2006.
Yizhi Tian, Feng Zhang, Zhi Yuan, Zihang Che, Nicholas
Zafetti, Assessment power generation potential of small
hydropower plants using GIS software, Energy
Reports, Volume 6, 2020, Pages 1393-1404.
Assessment of Streamflow Characteristics in a Watershed Using Flow Duration Curves and Hydrograph Analysis
95
