
Quality Control System in Cigarette Manufacturing Based on
Employee Portrait
Weixi Kong
1a
, Qiying Li
2,* b
, Zhou Qian
1c
, Yingkui Zhou
1
, Ruiqi Wang
1
, Mao Ao
1
, Jun Zha
1
and Biao Tao
1
1
Qujing Cigarette Factory, Hongyun Honghe Tobacco(Group) Co., Ltd., Qujing 655000, China
2
Inspur Industrial Internet Co., Ltd., Beijing, 100193, China
Keywords: Cigarette Manufacturing, Quality Control, Deep Learning, CNN, Employee Portrait.
Abstract: How to improve product quality has always been a pain point and difficult problem that plagues the tobacco
industry. Employee behaviour is an important factor affecting product quality. In this sense, we propose one
method for quality control in cigarette manufacturing based on employee portrait. Quality Control System is
composed of behaviour recognition system, evaluation system and early warning system. The employee
behaviour is recognized by recognition system and behaviour data is obtained. Combining with the equipment
operating parameters, evaluation system calculates employee behaviour score based on the proposed
evaluation index system. Behaviour data and behaviour score compose the employee portrait. The early
warning system issues warnings to the employees and the managers when abnormal behaviour is recognized,
quality inspection is not carried out within the specified time, and the behaviour score is below the threshold.
Its application had improved product quality and efficiency.
1 INTRODUCTION
Consumer goods industry is an important civilian
industry and traditional industry in China, which has
the advantages of wide coverage and complete
structure.However, it is far behind the international
level in terms of variety, quality and brand. In order
to promote the international competitiveness of
consumer goods industry, China has implemented
variety, quality and brand strategy since 2016 and has
achieved good results in recent years (MIIT, 2020).
In recent years, with the development of the new
generation of information and communication
technology(ICT), the United States, Canada, the
United Kingdom, Germany, France, Russia, Japan
and other major countries in the world have
implemented digital strategies (U.S. Department of
State, 2020; Canadian Industry, 2020; European
Commission, 2021; DCMS, 2020; BMBF, 2020;
MFIDS, 2020; Cabinet Office, 2021; MOEF, 2020).
The technology of artificial intelligence (AI), big
a
https://orcid.org/0000-0002-9535-0294
b
https://orcid.org/0000-0001-8711-1130
c
https://orcid.org/0000-0002-4596-0625
data, blockchain and etc are developed and are used
to promote the digital transformation of traditional
industries. China also attaches great importance to
digital transformation and accelerates the high-
quality development of various industries through
digital transformation (SCPRC, 2021).
As one kind of consumer goods industry, the
tobacco industry has always been confused by
improving product quality. According to statistics,
the quality defect rates of Qujing Cigarette Factory
from April to December 2020 keep 0.1%, which
means that there may be 1 pack with quality problems
for every 1000 packs. Employee, equipment, raw
material, process, environment and management
system are all the risk factors of quality error. In order
to improve cigarette product quality, Poka-yoke
technology is studied to control the risk of quality
error (Ye, 2021). Advanced equipment is applied and
industial internet paltform in cigarette manufacturing
was constructed to realize production monitoring,
diagnosis, evaluation and optimization (Qiying et al.,
2020). Cigarette manufacturing process parameters
182
Kong, W., Li, Q., Qian, Z., Zhou, Y., Wang, R., Ao, M., Zha, J. and Tao, B.
Quality Control System in Cigarette Manufacturing Based on Employee Portrait.
DOI: 10.5220/0011917400003612
In Proceedings of the 3rd International Symposium on Automation, Information and Computing (ISAIC 2022), pages 182-190
ISBN: 978-989-758-622-4; ISSN: 2975-9463
Copyright
c
2023 by SCITEPRESS – Science and Technology Publications, Lda. Under CC license (CC BY-NC-ND 4.0)
are intelligently optimized based on big data (Yang et
al., 2020). Cigarette product quality supervision and
inspection management system is optimized (Shan et
al., 2020). The method of quality control level is
improved (Guo et al., 2020). All the measures are to
achieve the control of process, equipment,
environment and management in cigarette
manufacturing. The operation personnel are not
mentioned.
Although many automation equipment and
intelligent means are now used, manpower is still
indispensable. In the traditional cigarette
manufacturing, product quality inspection cannot be
fully detected by machine vision because the middle
and bottom of the cigarette are obscured. The quality
inspection needs to be completed by employees.
Whether the employees carry out quality inspection
according to the specification on time, whether the
employees have violations or wrong operations and
whether the employees keeps good working state
become the management focus of product quality
control. At the moment, the employee behavior is
traced back, analyzed and evaluated through
replaying and watching video surveillance after
quality accidents are feedback from the market. The
manual checking method has the disadvantages of
low efficiency, poor accuracy, time-consuming and
high cost.
Deep learning has set off a new climax of artificial
intelligence. In recent years, with the improvement of
deep learning (Deep learning, 2015) methods and the
breakthrough of large databases, neural network
models have extra-ordinary performance of high
precision, good generalization and strong robustness
in more and more complex tasks. They have been
widely used in various fields of social life, such as
speech recognition (Graves et al., 2013), automatic
driving (Chen et al., 2015), image classification
(Krizhevsky et al., 2015) and etc. In 2012, the
AlexNet network won the championship in the image
classification competition and enabled the rapid
development of convolutional neural networks. Much
research is carried out to improve the performance to
apply convolutional neural networks to solve
industrial problems.
The novel contribution of this paper is to propose
a method for quality control in cigarette
manufacturing based on employee portrait. Firstly,
the employee behaviour is recognized based on
Convolutional Neural Network (CNN) and analysed.
The employee behaviour data is obtained. Secondly,
behaviour evaluation index system is proposed. The
employee behaviour score is calculated. The
employee portrait is described by employee
behaviour data and score. Finally, Warning is issued
in real time when abnormal behaviour and violations
or wrong operations are found.
The contributions of this paper are summarized as
follows. In Section 2, we propose a method for
quality control in cigarette manufacturing. The
construction of employee portrait is presented. CNN
is introduced to identify employee behaviour. The
behaviour evaluation index system is proposed to
calculate employee score. In Section 3, we conducted
simulation and performance evaluation of CNN and
carry out application implementation in Qujing
Cigarette Factory. The accuracy, generalization and
robustness of CNN are verified by comparing with
linear classification, Bayes classification and nearest
neighbor. The application effectiveness in Qujing
Cigarette Factory are presented. Finally, we conclude
our work in Section 4.
2 QUALITY CONTROL SYSTEM
The study is based on industial internet paltform in
cigarette manufacturing and is the follow-up research
work of reference (Qiying et al., 2020). The
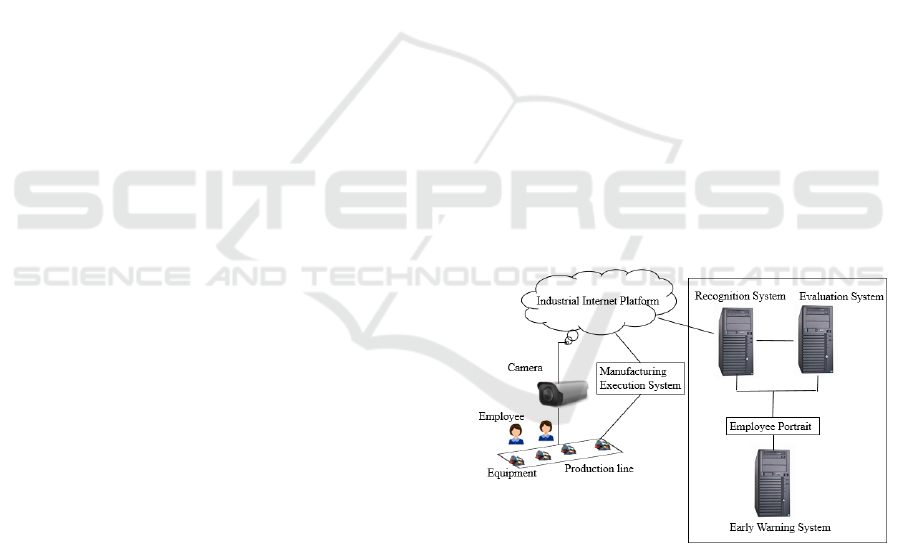
schematic diagram of the quality control system
based on employee portrait is shown in Figure 1. It
mainly consists of behaviour recognition system and
evaluation system and early warning system.
Figure 1: Schematic diagram of the quality control system
based on employee portrait.
The working video of the employees are shot by
the camera and uploaded to the industrial internet
platform. After the video streams are converted into
images, the behaviour recognition system performs
face recognition and behaviour comparison. The time
on duty and quality inspection frequency is calculated.
The working trajectory is described through heat map
by echarts. The evaluation system retrieves the data
interface of MES system, read the excipient
Quality Control System in Cigarette Manufacturing Based on Employee Portrait
183
replacement frequency, cigarette rejection rate and
the equipment operating parameters and calculated
employee behaviour score based on the evaluation
index system. The early warning system issues
warnings to the employees and the managers when
abnormal behaviour is found, quality inspection is not
carried out within the specified time, and the
behaviour score is below the threshold.
2.1 Employee Behaviour Recognition
2.1.1 CNN
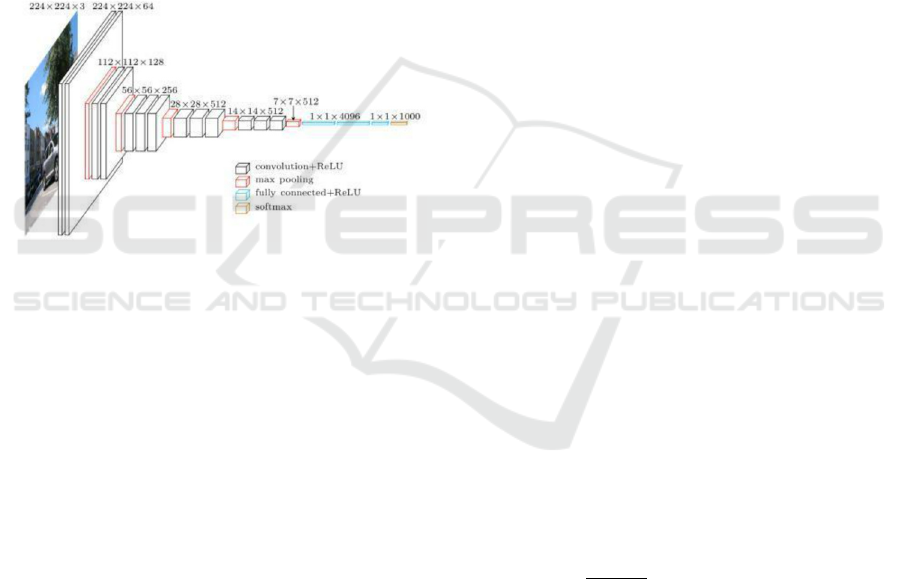
The employee behaviour is identified based on
convolutional neural networks (CNN). The original
model is VGG16 and its principle is shown in
Figure2.
Figure 2: The principle of VGG16.
The forward propagation process includes
padding, convolution, activation function, pooling,
full connection and softmax classification.
Padding operations are adopted in order to
overcome the drawback that pixels in corners or
edges of the image are weakened when convolving.
P-layer data are filled around the original image data.
In addition to retaining more valid information,
padding also keeps the height and width constant
before and after convolution.
The convolution layer mainly uses the
convolution operation to extract features from the
input image (Zhenzhen et al., 2018). The i-th
convolution calculation 𝐶
of the k-th convolution
layer is expressed as follows:
conv(A, K , ( 1, 2,..F )
kkk
iiik
k
i
C valid b i ==+)
(1)
Where A is the input of CNN and a matrix,
F
k
is
the number of the convolution kernels of the k-th
convolution layer,
k
i
valid
is and
k
i
b
are respectively
the valid value and the bias term of the i-th
convolution calculation of the k-th current
convolution layer.
The activation function is to introduce nonlinear
elements (Guozhu et al., 2021; Zhipeng, 2018) in the
neural network. Compared with function Sigmoid and
tanh, function ReLU has faster convergence and
simpler expression. The result 𝑒
of 𝐶
being
activated with the function ReLU is expressed as
follows:
𝑒
=ReLU𝐶
(2)
The function of the pooling layer is to reduce
the size of the network, improve the computing speed,
and improve the robustness of the extracted features.
The pooling layer downsamples the feature map
output by the convolution layer (Liu, 2021), reduces
the size of the feature map and further extracts
important features in the feature map, which greatly
reduces the subsequent operation. The maxi-pooling
is adopted in the paper. The pooling calculation result
P
p
of the current pooling layer is expressed as follows:
𝑃
=𝛽∙down
(
B
)
+𝑏
(3)
Where B is the output of the last function ReLU,
𝑏
and β are respectively the bias term and
amplification value of the current pooling layer.
The result 𝑒
of 𝑃
being activated with the
function ReLU is expressed as follows:
𝑒
=ReLU𝑃
(4)
The fully connected layer converts the two-
dimensional feature image output by the convolution
into a one-dimensional vector and achieves end-to-
end learning (Yang, 2021; Zhichao et al., 2019). The
output 𝑧 of the fully connected layer is as follows:
𝑧=𝑤∙𝑣+𝑏
(5)
where 𝑤,𝑣 and 𝑏
are respectively is the weight
vector, the input and the bias term of the d-th fully
connected layer.
The softmax function at the output layer can
compress a K-dimensional vector 𝑣 containing any
real number into another K-dimensional real vector
σ
(
𝑣
)
, so that each element is between (0,1) and the
sum of all elements is 1. The j-th element σ
(
𝑣
)
is
calculated as follows:
σ
(
𝑣
)
=
∑
(
j = 0,1,2 … 𝐾
)
(6)
The purpose of backward propagation is to bring
the training samples into the model, so that the loss
function is minimized. The cross entropy is used as
the loss function in the model. The cross entropy
𝐽𝑝,σ
(
𝑣
)
of 𝑜vector σ
(
𝑣
)
is calculated as follows:
𝐽𝑝,σ
(
𝑣
)
=−
∑
𝑝
log (σ
(
𝑣
)
)
(7)
where p is the label vector of the category to
which the image belongs.
The error 𝛿
of the j-th neuron of the l-th layer is
calculated as follows:
ISAIC 2022 - International Symposium on Automation, Information and Computing
184

𝛿
=∇
𝐽 ⨀𝜎
‘
(𝑧
) (8)
Where ∇
𝐽 is a vector whose elements are the
partial derivatives of loss function with respect to the
output of j-th Neuron of the l-th layer, 𝑧
is a small
change and ⨀ is the Hadamard product.
The current layer error 𝛿
can be expressed by the
next layer error 𝛿
as follows.
𝛿
= ((𝑤
)
𝛿
)⨀𝜎
‘
(𝑧
) (9)
When the change rate of the loss function with
respect to any bias in the network and the change rate
of the loss function with respect to any one of the
weights respectively satisfy formula (10) and (11) ,
the model training ends.
=𝛿
(10)
=𝑎
𝛿
(11)
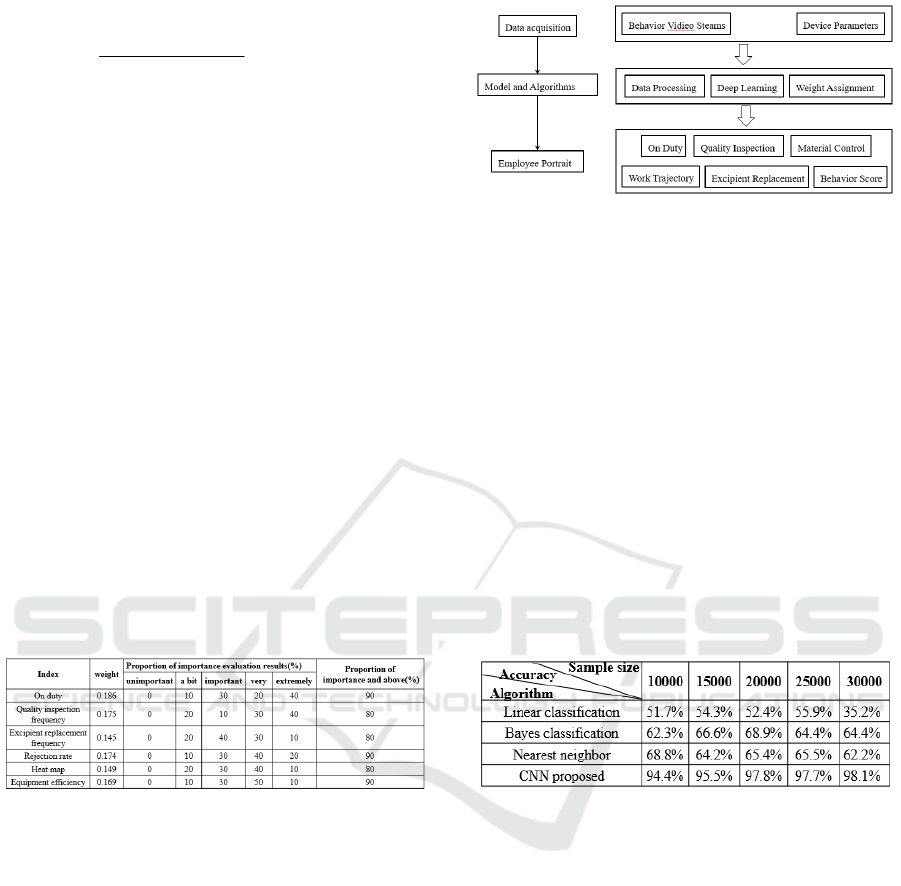
2.1.2 Employee Behaviour Data
The employee behaviour data is obtained from
behaviour recognition system and MES system.
The behaviour recognition system obtains
employee behaviour data by performing face
recognition and behaviour comparison, as shown in
Figure 3. The face recognition is based on DeepID2
(Sun et al., 2014). After face recognition, employee
information is obtained and the time on duty is
accumulated by the timer. The working trajectory
and staying time of the employee is expressed by heat
map. The behaviour recognition is based on CNN.
The time interval at which employees perform quality
inspection is analysed and the times performing
quality inspection is calculated.
Figure 3: Acquisition of employee behaviour data by
behaviour Recognition System.
The times for excipient replacement can be read
from manufacturing execution system (MES). The
employee behaviour data is shown in Table I.
Table 1: The employee behaviour data.
2.2 Employee Behaviour Evaluation
The employee behaviour will affect the equipment
operating parameters. In the employee behaviour
evaluation, the equipment operating parameters are
considered and are read from MES. The operating
parameters of the equipment is shown in Table II.
Table 2: The operating parameters of the equipment.
Employee behaviour data and the operating
parameters of the equipment are assigned different
weights, and the behaviour score is finally calculated
according to the behaviour evaluation index system.
In order to make the weight realistic, all the
people in Qujing Cigarette Factory are selected to
evaluate the importance of employee behaviour data
and equipment operating parameters. The evaluation
results are divided into 5 levels and they are
respectively “unimportant”, “somewhat important”,
“important”, “very important” and “extremely
important”. The “unimportant” result is assigned the
value of 1. And so on, the other results are assigned
the value of 2, 3, 4 and 5. Only the indexes with
proportion of importance and above (%) more than
60% are only selected to calculate the weight. The
evaluation results of the importance of each
behaviour are shown in Table III.
Table 3: The evaluation results of the importance of each
index.
The weight
j
W
of the j-th index is calculated by
the formula (12).
Quality Control System in Cigarette Manufacturing Based on Employee Portrait
185
3
1
63
11
*
*
jk k
k
j
ik k
ik
Passign
W
P assign
=
==
=
(12)
Where
jk
P
is the k-th importance evaluation
result starting from “important” of j-th index and
k
assign
is the proportion of k-th assigned value to the
sum of assigned value from “important”.
For example, the weight W
1
of “on duty” is
calculated as the following.
W
1
=
(30*0.25+20*0.33+40*0.42)/{(30*0.25+20*0.33+4
0*0.42)+(10*0.25+30*0.33+40*0.42)+(40*0.25+30
*0.33+10*0.42)+(30*0.25+40*0.33+20*0.42)+(30*
0.25+40*0.33+10*0.42)+(30*0.25+50*0.33+10*0.4
2)} = 30.9/(30.9+29.2+24.1+29.1+24.9+28.2) =
30.9/166.4=0.186
Similarly, the weight W
2
of “Quality inspection
frequency” is 0.175. The weight W
3
of “Excipient
replacement frequency” is 0.145. The weight W
4
of
“Rejection rate” is 0.174. The weight W
5
of “Heat
map” is 0.149. The weight W
6
of “Equipment
efficiency” is 0.169. The weights for each index are
as shown in Table IV.
Table 4: The weights for each index.
The behaviour score S is calculated with data
within 240 minutes according to formula (13).
6
1
value weight
ii
i
S
=
=
(13)
where
value
i
is the value of the index in Table I
and Table II,
weight
i
is corresponding weight in
Table IV.
2.3 Employee Portrait
As shown in Figure 4, the employee portrait is
described by employee behaviour data and employee
behaviour score.
Figure 4: Employee Portrait.
3 RESULTS
3.1 Performance Analysis of CNN
In order to verify the accuracy of employee portrait
model, we compared the accuracy of CNN with the
accuracy of three other algorithms, which are
respectively linear classification, Bayes classification
and nearest neighbor. In order to verify the
generalization, different sample sizes are adopted.
The accuracies for different algorithms at different
sample sizes are shown in Table V.
Table 5: The accuracies for different algorithms at different
sample sizes.
From Table V, the accuracies of CNN in the paper
are all higher than that of the other three models at
different sample sizes. Although the accuracies of
Bayes classification and nearest neighbour is higher
than linear classification, they still don’t meet the
requirements. In addition, the accuracy of CNN in the
paper will not be affected by the sample size and the
spatial dimension of sample features. The CNN in the
paper has good generalization.
Gaussian noise, impulse noise, gamma noise,
exponential noise and uniform noise are added to the
sampled data with the sample size of 30000. The
accuracy comparison results are shown in the Table
VI.
ISAIC 2022 - International Symposium on Automation, Information and Computing
186
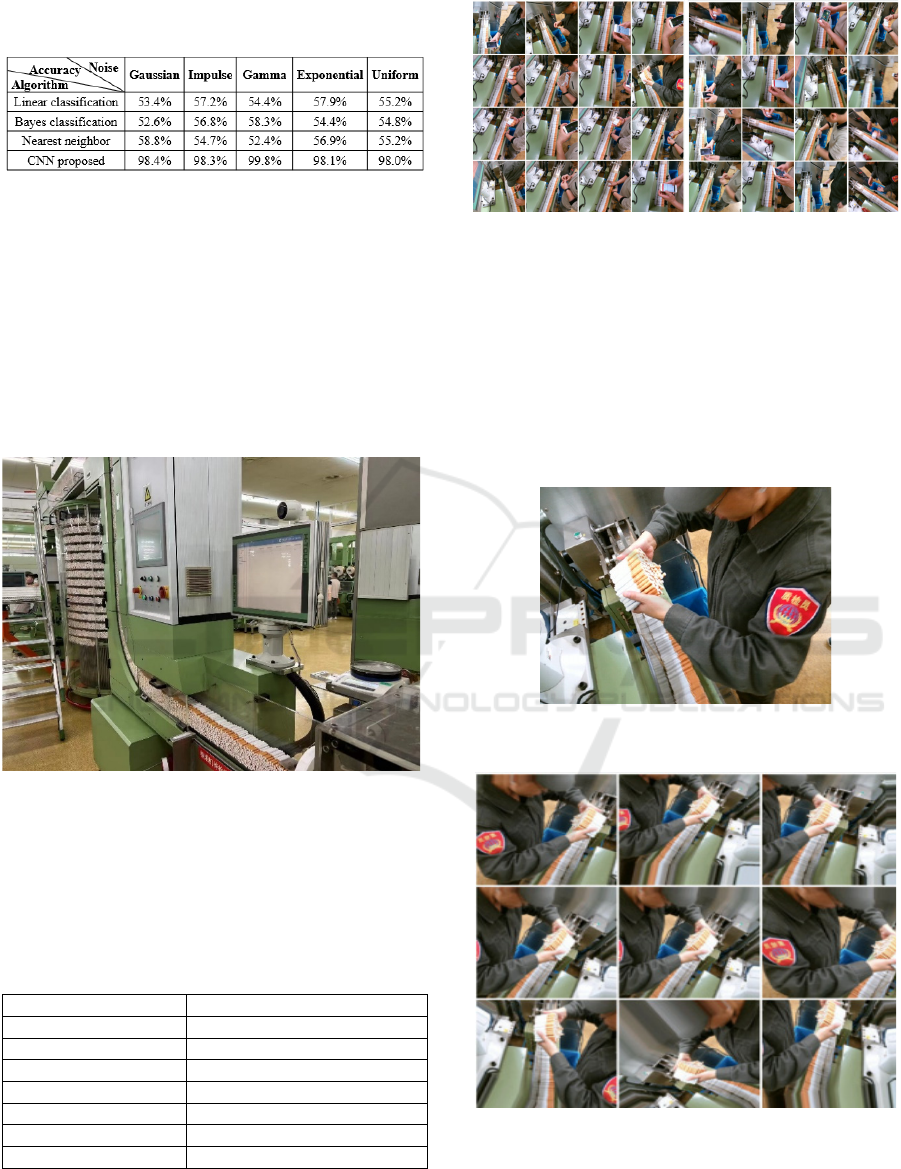
Table 6: The accuracies for different algorithms under
different kinds of noise.
From Table VI, the accuracies for the other three
algorithms are very low under different kinds of noise.
The CNN in the paper is insensitive to any kind of
noise and the accuracy can reach at least 98%. The
model has good robustness.
3.2 Application Implementation
The quality control system has been implemented in
the roll-up and packaging workshop of Qujing
cigarette factory, as shown in Figure 5.
Figure 5: The roll-up and packaging workshop of Qujing
cigarette factory.
The employee behaviour is acquired in real
production environment. The acquisition parameters
are shown in Table VII.
Table 7: The acquisition parameters for employee
behaviour in real production environment.
Machine Model ci
g
arette machine
p
rotos70
Camera Position ci
g
arette aisles
Frequency 2s
Image specification 640*480px
Ima
g
e format JPEG
Duration 7*24h
content em
p
lo
y
ee behaviou
r
Size 30000
Both the violations or wrong operations and
quality inspection are acquired, as shown in Figure 6.
Figure 6: Violations or wrong operations and quality
inspection acquired.
In order to make CNN have good generalization
performance and have high accuracy in the real
production environment, the image is enhanced
before training by a series of random transformations,
such as pulling up, panning, cutting, zooming in,
zooming out, flipping, rotating, pixel filling. The
original image is shown in Figure 7 and the
transformed image is shown in Figure 8.
Figure 7: Original image.
Figure 8: Transformed image.
As shown in Figure 9 and Figure 10, the behaviour
of quality inspection and playing telephone are
recognized.
Quality Control System in Cigarette Manufacturing Based on Employee Portrait
187

Figure 9: The recognition result of quality inspection
behaviour.
Figure 10: The recognition result of playing telephone
behaviour.
When the forbidden behaviour is found, such as
playing telephone, closing the eyes, long absence
from work, warning is sent to the employee and
manager. It is required that quality inspection is
performed at least once every 20 minutes. When the
quality inspection behaviour is not recognized within
20 minutes, warning is also sent to the employee and
manager.
The employee portrait is shown in Figure 11.
Figure 11: Employee Portrait.
The equipment efficiency is required to be at least
88% to complete the specified production tasks. In
order to get the corresponding threshold of employee
behaviour score for equipment efficiency value of
88%, the behaviour scores of all employees and the
corresponding equipment efficiencies are analysed
statistically for 3 months. The behaviour scores of one
employee and the corresponding equipment
efficiencies for 3 months is shown in Figure 12. It is
found that the average behaviour score is 86 when the
equipment efficiency reaches 88%. When the
behaviour score is lower than the threshold of 86,
warning is sent to the employee and manager. It helps
the manager make decisions for personnel
adjustments.
Figure 12: The behaviour scores of one employee and the
corresponding equipment efficiencies for 3 months.
3.3 Application Effectiveness
As shown in Figure13-Figure15, the application in
Qujing cigarette factory has achieved remarkable
results in improving quality and efficiency and
reducing quality defect rate. Compared to 2020, the
Overall Equipment Effectiveness (OEE) and capacity
utilization rate are respectively increased by 4.87%
and 0.6%, and the quality defect rate of cigarette
sampled was reduced by 0.75%.
Figure 13: OEE.
ISAIC 2022 - International Symposium on Automation, Information and Computing
188
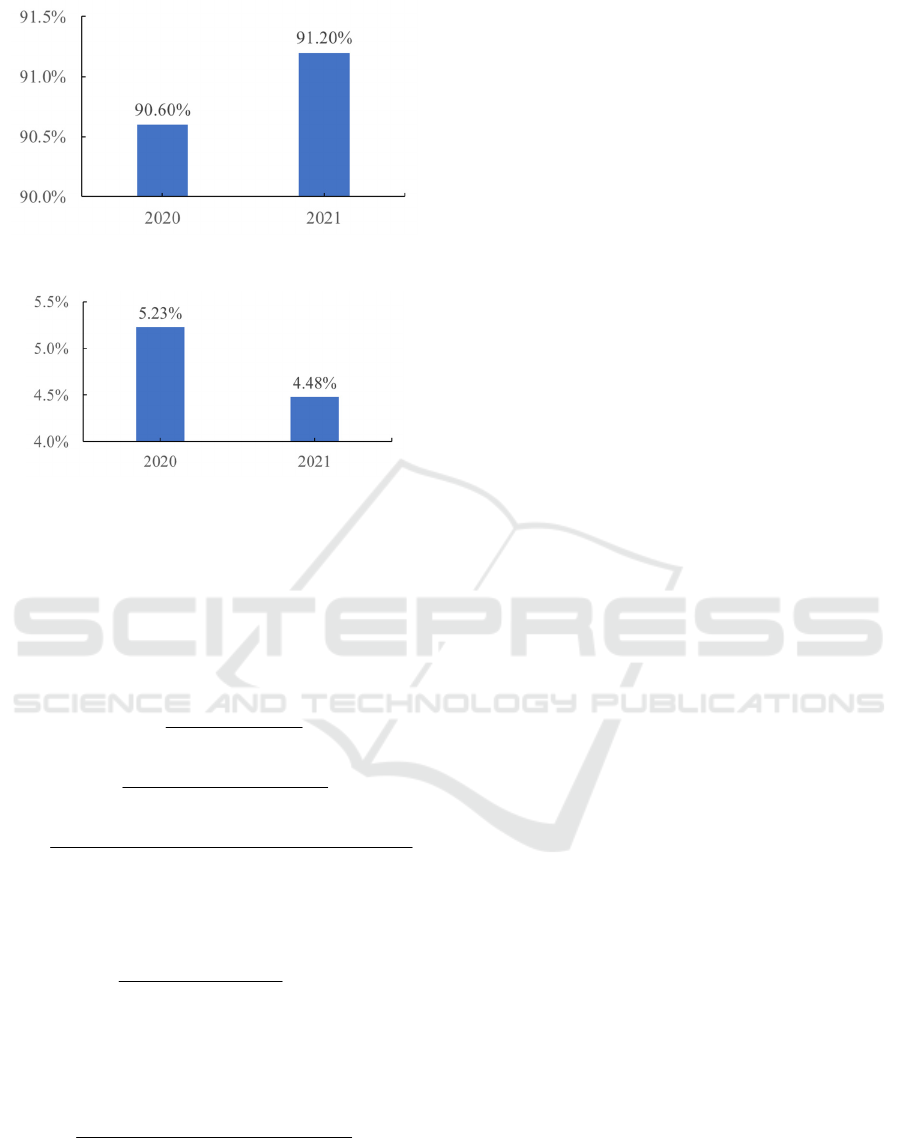
Figure 14: Capacity utilization rate.
Figure 15:
Quality defect rate of cigarette sampled.
The OEE is calculated by formula (14).
OEE
ησ χ
=× ×
(14)
Where
η
is equipment efficiency,
σ
is
equipment utilization rate and
χ
is the rate of
qualified products.
η
,
σ
and
χ
are respectively
calculated by formula (15)-(17).
actual yield
theoretical yield
η
=
(15)
actual production time
planned production time
σ
=
(16)
actual yield
actual yield yield of unqualified products
χ
+
=
(17)
The capacity utilization rate
ς
is calculated by
formula (18).
a
ctual capacity
theoretical capacity
ς
=
(18)
The quality defect rate of products sampled
τ
is
calculated by formula (19).
the unqualified products sampled
actual yield
τ
=
(19)
4 CONCLUSIONS
In this paper, we propose a method for quality control
in cigarette manufacturing based on employee
portrait. The abnormal behaviour and violations or
wrong operations can be recognized and warning can
be issued in time. The managers can know the
working state and take actions for personnel
deployment and training based on behaviour score.
The method improves OEE and capacity utilization
rate and reduces the quality defect rate of cigarette
sampled. In the future, we will further optimize CNN
by changing the number of convolution layers, the
number of convolutional kernels, and the activation
function to improve the recognition rate. Also
behaviour recognition system will be deployed on the
production line based on edge computing and the end-
edge-cloud collaborative computing will be realized.
ACKNOWLEDGEMENTS
If any, should be placed before the references section
without numbering.
REFERENCES
Ministry of Industry and Information Technology of the
People’s Republic of China. Special action for
increasing variety, improving quality and creating
products in the consumer goods industry. 2016-6-12.
https://wap.miit.gov.cn/zwgk/zcwj/wjfb/xfpgy/art/202
0/art_195e1ad54cd4f.html,
U.S. Department of State. National Strategy for Critical and
Emerging Technology. 2020-10-15.
https://www.whitehouse.gov/wp-
content/uploads/2020/10/National-Strategy-for-
CET.pdf
Canadian Industry Strategy Council. Restart, Recover and
Reimagine Posperity for all Canadians:an Ambitious
Growth Plan for Building a Digital, Sustainable and
Innovative Economy. 2020-12-11.
https://www.ic.gc.ca/eic/site/062.nsf/vwapj/00118a_en
.pdf/$file/00118a_en.pdf
European Commission. 2030 Digital Compass: the
European way for the Digital Decade. 2021-3-9.
https://eufordigital.eu/wp-
content/uploads/2021/03/2030-Digital-Compass-the-
European-way-for-the-Digital-Decade.pdf.
UK Department for Digital, Culture, Media and Sport
(DCMS). National Data Strategy [EB/OL]. 2020-9-9.
https://www.gov.uk/government/publications/uk-
national-data-strategy/national-data-strategy
Federal Ministry of Education and Research. G7 united in
science and research. 2020-6-15.
Quality Control System in Cigarette Manufacturing Based on Employee Portrait
189

https://www.bmbf.de/files/090_20_Faktenblatt_Konju
nkturpaket.pdf
Ministry of finance and industrial and digital sovereignty.
Making France a disruptive economy. 2020-2-6.
https://www.economie.gouv.fr/remise-rapport-faire-
france-economie-rupture-technologique#
Cabinet Office. Sixth Edition of the Basic Programme of
Science and Technology. 2021-3-6.
https://www8.cao.go.jp/cstp/kihonkeikaku/6honbun.pd
f
Ministry of Finance of the Republic of Korea. Digital-based
industrial innovation development strategy. 2020-8-
20.http://www.moef.go.kr/com/synap/synapView.do?a
tchFileId=ATCH_000000000015090&fileSn=2
State Council of the People’s Republic of China. The 14th
Five-Year Plan for National Economic and Social
Development and the Long-term Goals for 2035. 2021-
3-13. http://www.gov.cn/xinwen/2021-
03/13/content_5592681.htm
Jihua Ye. The study on how to make scientific use of "Poka
Yoke Technology" in the process of cigarette
production and management under the background of
big data analysis. 2021 International Conference on
Forthcoming Networks and Sustainability in AIoT Era
(FoNeS-AIoT), 2021:221-224
Li Qiying, Zhao Yang, AZIGULI Wulamu. Construction
and application of industrial internet platform in
cigarette manufacturing. Computer Integrated
Manufacturing Systems, 2020, 26(12): 3427-3434
Yang Yao, Li Zhengkui, Cao Zhe, Guo Qianhan. Research
on Intelligent Optimization of Cigarette Manufacturing
Process Parameters Based on Big Data. Industrial
Control Computer, 2020, v.33(10):122-124
Shan Qiufu,Qin Yunhua,Xiong Wen,Luo Lin,Wang
Lu,Zhang Haitao. Research on the Optimization of
Cigarette Product Quality Supervision and Inspection
Management System. Journal of Kunming University,
2020, 42(03):27-31
Guo Jun-liang, Xu Xin-hua, Fan Jin-jian. A Method to
Improve the Quality Control in the course of Filter
Molding for Tobacco Agriculture Modernization
Process. Journal of Shandong Agricultural
University(Natural Science Edition), 2020, 51(05):915-
917
Deep learning. Nat., 2015, 521(7553) : 436 –
444.https://doi.org/10.1038/nature14539.
Graves A, Mohamed A, Hinton G E. Speech recognition
with deep recurrent neural networks. IEEE
International Conference on Acoustics, Speech and
Signal Processing, ICASSP 2013, Vancouver, BC,
Canada, May 26-31, 2013. [S.l.] : IEEE, 2013 : 6645 –
6649. https://doi.org/10.1109/ICASSP.2013.6638947.
Chen C, Seff A, Kornhauser A L, et al. Deep Driving:
Learning Affordance for Direct Perception in
Autonomous Driving. 2015 IEEE International
Conference on Computer Vision, ICCV 2015, Santiago,
Chile, December 7-13, 2015. [S.l.] : IEEE Computer
Society, 2015 :2722 – 2730.
https://doi.org/10.1109/ICCV.2015.312.
Krizhevsky A, Sutskever I, Hinton G E. ImageNet
classification with deep convolutional neural networks.
Commun. ACM, 2017, 60(6) : 84-90.
http://doi.acm.org/10.1145/3065386.
Yang Zhenzhen, Kuang Nan, Fan Lu, Kang Bin. (2018).
Review of image classification algorithms based on
convolutional neural networks . Journal of Signal
Processing, 34(12): 1474-1489
Liu Guozhu, Zhao Pengcheng, Yu Chao, Wang Xiaotian.
Convolutional neural network image recognition based
on hybrid activation function. Journal of Qingdao
University of Science and Technology(Natural Science
Edition), 2021, 42(01):114-118
Li Zhipeng. Research and applications on multisource data
attack detection based on neural network. University of
Electronic Science and Technology of China, 2018
Jia Liu. Research on Real-time Semantic Segmentation
Methods Based on Convolutional Neural
Network . Nanjing University of Posts and
Telecommunications, 2021
Jiaxin Yang. Research on Human Behavior Recognition
Lgorithm Based on Convolutional Neural Network and
Its Application. Taiyuan University of Technology,
2021
Yang Zhichao , Zhou Qiang , Hu Kan , Zhao
Yun. Welding defect recognition Technology based
on convolutional neural network and application.
Journal of Wuhan University of Technology
(Information & Management Engineering), 2019,
41(01):17-21
Sun Y, Wang X, Tang X. Deep Learning Face
Representation from Predicting 10, 000 Classes. 2014
IEEE Conference on Computer Vision and Pattern
Recognition, CVPR 2014,Columbus, OH, USA, June
23-28, 2014. [S.l.] : IEEE Computer Society, 2014 :
1891 – 1898.https://doi.org/10.1109/CVPR.2014.244.
ISAIC 2022 - International Symposium on Automation, Information and Computing
190
