
Application of Wavelet Analysis to Correlation Between Sunspot
Activity and Precipitation in Yunnan Province
Siyuan Du and Zhongmu Li
*
Institute of Astronomy, Dali University, Dali, 671003, China
Keywords: Wavelet Analysis, Correlation Analysis, Sunspot Numbers, Precipitation.
Abstract: Wavelet analysis is widely applied in the processing of time series such as climate and hydrology to extract
the change characteristics and periodic relations. Based on wavelet analysis and time lag correlation analysis,
this paper studies the correlation between sunspot numbers and precipitation at seven meteorological stations
in Yunnan Province from year 1959 to 2019.The results show that the cross wavelet analysis and time lag
correlation analysis are suitable for studying the periodic response and time delay relationship between solar
activity and climate factors. These two methods can extend to other geographical locations. It is shown that
the resonance period between sunspot numbers and the annual mean precipitation at the seven meteorological
stations are mainly concentrated in the scale of 8-12a, and there are obvious time lag relationships between
these time series from the phase angle. The time lag correlation analysis shows that there are different time
delays between sunspot numbers and precipitation in different climatic regions.
1 INTRODUCTION
As a powerful statistical tool, wavelet analysis has
been used in the field of mathematics for about a
century. It is a development of the Fourier Transform,
which can be used for time-frequency analysis of
signals with non-stationary characteristics. The
wavelet transform replaces the infinitely long
trigonometric basis in the Fourier transform with a
finite length decaying wavelet basis to obtain the
frequency change and time information. At present,
wavelet analysis is widely used in signal analysis,
image processing, quantum mechanics, theoretical
physics and other fields. Many scholars apply wavelet
analysis to climate analysis to diagnose the internal
hierarchy of climate change and analyze the evolution
characteristics of time series at different scales. For
example, Li and Gao et al. (2017) used wavelet
analysis to study the influence of solar activity and El
Nino on extreme precipitation in the Loess Plateau.
They found that the maximum precipitation mainly
occurred at or near the peak of sunspot numbers, and
extreme precipitation often occurred in the year after
El Nino event. Li and Wen et al. (2020) studied the
time response to drought based on the wavelet
transform method. They found that meteorological
drought and hydrological drought had obvious
periodicity on the scale of 2-4a, and hydrological
drought was usually followed by meteorological
drought for 1-2 months. Zhao and Luo (2021) applied
wavelet analysis to the study of temperature and
precipitation changes in Dabie Mountain in western
Anhui Province. The results showed that temperature
had an oscillation periodicity of 22a and 10a, and
precipitation had an oscillation periodicity of 26a. We
will get different conclusions by using wavelet
analysis to study climate characteristics at different
regions.
Climate changes have always been a hot issue of
social concern. The frequent occurrence of extreme
climates has caused huge losses to human life and
property. It will greatly reduce and avoid the harm
caused by climate changes if we understand the
climate changes, improve the accuracy of predictions
and take effective measures to cope with climate
change actively. At present, many scholars improve
the accuracy of climate prediction by data
assimilation, such as Cheng and Argaud et al. (2021)
use a flexible combination of existing covariance
tuning algorithms to tackle the problem of a
multivariate and spatially distributed hydrological
model and gain a significantly more accurate and
more robust flow forecast for the Tarn river. We can
also increase climate factors in the prediction model
to improve the accuracy. The climate changes are
224
Du, S. and Li, Z.
Application of Wavelet Analysis to Correlation Between Sunspot Activity and Precipitation in Yunnan Province.
DOI: 10.5220/0011918400003612
In Proceedings of the 3rd International Symposium on Automation, Information and Computing (ISAIC 2022), pages 224-229
ISBN: 978-989-758-622-4; ISSN: 2975-9463
Copyright
c
2023 by SCITEPRESS – Science and Technology Publications, Lda. Under CC license (CC BY-NC-ND 4.0)

influenced by many factors, such as solar activity,
atmospheric circulation, ENSO, land-sea distribution,
global warming and anthropogenic factors. Sunspots
are a symbol of solar activity. The sunspot numbers
are related to the intensity of solar radiation.
Therefore, this study uses sunspot numbers to
represent the solar activity to investigate the
correlation between solar activity and precipitation.
Based on the precipitation in Yunnan Province at
seven meteorological stations and sunspot numbers,
this paper adopts the method of wavelet analysis and
correlation analysis to study the possible relationship
between solar activity and precipitation. It helps for
analyzing the mechanism of solar activity affecting
climate change and predicting climate changes in
Yunnan Province.
2 MATERIALS AND METHOD
2.1 Study Area
Yunnan Province is located in the Yunnan-Kweichow
Plateau region, between latitudes within 21°8 ' N ~
29°15' N and longitudes within 97°31 ' E~106°11 ' E,
covering an area of 394100 km
2
. Due to the influence
of atmospheric circulation, there are different climate
zones in the province. The main climatic zones
including north tropical zone, South subtropical zone,
middle subtropical zone, North subtropical zone,
South humid zone, middle temperate zone and
plateau climate zone. The paper selects the
precipitation data of one meteorological station in
each of the 7 climatic zones for research. The 7
meteorological stations are Kunming Station, Pu'er
station, Mengla Station, Zhaotong Station, Gongshan
Station, Lijiang Station and Shangri-La Station.
Because of geographical complex topography and
diverse climate zones, it is important to select
precipitation data from different meteorological
stations in Yunnan Province to study the correlation
between solar activity and precipitation.
2.2 Data
The precipitation data of Yunnan Province are
selected from the National Meteorological Science
Data Center (https://data.cma.cn). The sunspots data
are selected from Royal Observatory of Belgium,
Brussels (https://www.sidc.be/silso/homes). The
study covers the period from year 1959 to 2019 (61
years). Even though there are some abnormal,
missing or invalid information exists in the original
data, it will not bring much influence on the result of
the research if these abnormal data are processed. In
this study, missing values are filled in and outliers are
replaced.
2.3 Method
2.3.1 Wavelet Analysis
Wavelet analysis is an effective method to reveal the
temporal structure time series (Wang & Wang, 1996).
Many time series show non-stationary in their
statistics. Different from most classical signal
analysis methods, wavelet analysis can be used to
detect and analyze the non-stationary of signals
(Chellali, Khellaf & Belouchrani, 2010). It can help
us extract the change features with complex temporal
patterns, such as periodic variation and response
events. Wavelet transform is a powerful time-
frequency analysis method, which has been applied in
many studies (e.g.,
Chellali, Khellaf & Belouchrani,
2010; Alperovich, Zheludev & Hayakawa, 2016).
These applications help to develop the wavelet
analysis theory and practice (Torrence &Webster,
2010; Ge, 2007). In this paper, we use cross wavelet
transform to analyze the respond periodicity of two
time series. Cross wavelet transform is constructed by
continuous wavelet transform to study their high-
power region and phase relationship in the time-
frequency interval. Continuous wavelet transform is
an important method widely used in wavelet analysis.
Here, Morlet wavelet is used as the wavelet basis
function of continuous wavelet transform and it is
defined as follow.
In equation (1),
0
ω
is the frequency parameter.
we often choose
6=ω
0
because it can make the
balance between time and frequency. t is the time
parameter.
The continuous wavelet is a band-pass filter
which can be stretched and translated to get different
wavelet basis. The continuous wavelet transform of
wavelet
ψ
is defined as.
In equation (2),
)t(x
is the input data. t is the time
parameter. s is the scale parameters (inversely
proportional to the spatial frequency).
τ
is the
2/t
ti
4/1
0
2
0
ee)t(
−
ω
−
π=ψ
(1)
τ−
ψ=τψ= dt)
s
t
()t(x
s
1
)s,(CWT
*
(2)
Application of Wavelet Analysis to Correlation Between Sunspot Activity and Precipitation in Yunnan Province
225

position offset.
*ψ
represent the complex conjugate
of the function
ψ
.
Cross wavelet transform is used to analyze the
correlation between two time series in the time-
frequency domain (Banerjee & Mitra, 2014). The
cross wavelet transform can reveal the similarity or
difference between time series, quantify the
correlation and the lag relationship between two time
series. The cross wavelet transform of two time series
n
x
and
n
y
is defined as.
Y
n
X
n
XY
n
W.W=W
(3)
In equation (3),
X
n
W
is the wavelet coefficient
matrix of time series
n
x
.
Y
n
W
is the wavelet
coefficient matrix of time series
n
y
.
*Y
n
W
is the
complex conjugate matrix of wavelet coefficient
matrix
Y
n
W
. The larger value of
|W|
XY
n
is, the more
significant the correlation is. It means that there is a
common high energy region between two time series.
The cross wavelet transform uses the phase angle
to estimate the phase difference of two time series. It
can represent the lag relationship between two time
series.
)
)}s(W{r
)}s(W{i
arctan(
XY
neal
XY
nmag
(4)
In equation (4),
eal
r
represents the real part of the
cross wavelet coefficient.
mag
i represents the
imaginary part of the cross wavelet coefficient.
According to the relationship between phase angle
and period, phase lead or lag can be obtained. In the
cross wavelet transform power spectrum figure (as
shown in figure 1). ← indicates that sunspots are
negative correlated with precipitation. → indicates
that they are positive correlated. ↓ indicates that
sunspots lead precipitation by 90°. ↑ indicates that
sunspots lag precipitation by 90°. In figure 1, red and
blue colors represent the peak and valley values of
energy density. It reflects the local and dynamic
characteristics of the time-frequency transformation
of the dominant fluctuation. The shades of color
represent the relative change of energy density. Thick
solid black line is the 5% significance level, which
has passed the red noise test. Thin solid black line
denotes the boundary of wavelet influence cone. This
area is the edge effect of wavelet transform which
cannot be ignored (Grinsted, Moore & Jevrejeva,
2004).
2.3.2 Time Lag Correlation Analysis
In the study of atmospheric, ocean and other scientific
problems, the response of the process is often not
immediate. It is necessary to carry out time lag
correlation analysis on the time series. Time lag
correlation analysis is to determine whether there is a
certain correlation between two time series if one
time series is lagged a period of time. The way to do
that is letting the time series y
2
lags by the value from
-n to n, and then calculate its Pearson coefficient with
the other time series y
1
. It is assumed that the
correlation is strongest by the value of i. If i > 0 means
that y
2
lags y
1
by the value of i. If i <0, then y
2
is ahead
of y
1
by i.
Pearson's correlation coefficient was developed
by Carl Pearson. Pearson correlation analysis uses
Pearson's formula to obtain the correlation coefficient
r of two variables. The calculation formula of
correlation coefficient is.
YX
Y,X
S.S
)Y,X(COV
=r
(5)
In equation (5), r
X,Y
represents the correlation
coefficient between series X and series Y. COV(X,Y)
is the covariance between series X and series Y. S
X
and S
Y
are the sample variances of series X and series
Y. The value of r
X,Y
ranges from -1 to 1, with a
positive value indicating a positive correlation and a
negative value indicating a negative correlation. The
larger value of |r
X,Y
|, the better the correlation
between two time series.
3 RESULT AND DISCUSSION
3.1 Result of Cross Wavelet Analysis
In this study, cross wavelet transform is used to
analyze the response relationship between sunspot
numbers and the average annual precipitation of
seven meteorological stations in Yunnan Province.
The cross wavelet power spectrum of the time series
are shown in Figure 1.
From the cross wavelet power spectrum, it can be
seen that sunspot numbers and the precipitation of
seven meteorological stations with different climates
in Yunnan Province have different scale periodic
response. They have significant characteristics in the
high-power region. Figure 1(a) shows cross wavelet
power spectrum of the sunspot numbers and average
ISAIC 2022 - International Symposium on Automation, Information and Computing
226
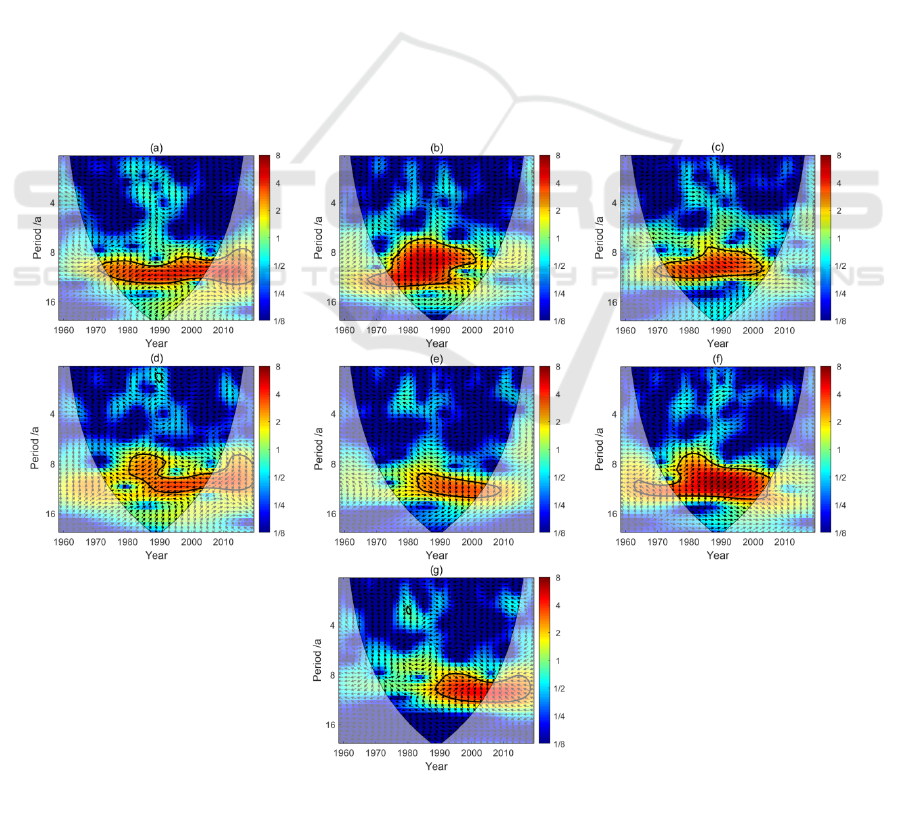
annual precipitation in kunming. We can see that
there is a 9-12a resonance period between sunspot
numbers and precipitation from year 1972 to 2007,
which shows a high power. The phase difference
indicates that the sunspot numbers and average
annual precipitation are negative correlated in
kunming. Figure 1(b) is the cross wavelet power
spectrum of the sunspot numbers and the average
annual precipitation of Pu’er. The resonance cycle of
sunspot numbers and precipitation is concentrated in
the scale of 8-12a from year 1973 to 2001, and high
power is shown in this resonance period. The phase
difference indicates that the sunspot numbers are
negative correlated with the precipitation from year
1973 to 1991, and positive correlated from year 1991
to 2001, with an abrupt change around year 1991.
Figure 1(c) is the cross wavelet power spectrum of
sunspot numbers and average annual precipitation in
Mengla. We can see that there is a resonance period
of 8-12a between them from year 1972 to 2003, and
high power is displayed in this resonance period. The
phase difference indicates that there is a positive
correlation between them in the resonance period.
Figure 1(d) is the cross wavelet power spectrum of
sunspot numbers and average annual precipitation in
Zhaotong. The sunspot numbers and precipitation
have an 8-10a resonance cycle from year 1980 to
1992, a 10-12a resonance cycle from year 1985 to
2006, and a 1a resonance cycle from year 1989 to
1991. Higher power is shown in the 8-10a and 10-12a
resonance cycles, and lower power is shown in the 1a
cycle. The phase difference indicates that the sunspot
numbers are negative correlated with the variation of
annual precipitation in Zhaotong during the
resonance period. Figure 1(e) is the cross wavelet
power spectrum of sunspot numbers and the annual
average precipitation in Gongshan. There is a 9-12a
response periodicity of sunspot numbers and annual
precipitation from year 1983 to 2005. High power is
displayed in this resonance period. The phase
difference indicates that sunspots are positive
correlated with the precipitation during the resonance
period. Figure 1(f) is the cross wavelet power
spectrum of sunspot numbers and annual average
precipitation in Lijiang. We can see that sunspot
numbers and average annual precipitation have an 8-
12a resonance period from year 1974 to 2006. High
power is shown in this resonance period. The phase
Figure.1 Cross wavelet power spectrum of sunspot numbers and precipitation at kunming (a), Pu’er (b), Mengla (c),
and Zhaotong (d), Gongshan (e), Lijiang (f), Shangri-La (g) meteorological station.
Application of Wavelet Analysis to Correlation Between Sunspot Activity and Precipitation in Yunnan Province
227

difference indicates that sunspots are positive
correlated with the variation of precipitation in
Lijiang during the resonance period. Figure 1(g) is the
cross wavelet power spectrum of sunspot numbers
and average annual precipitation in Shangri-La. The
sunspot numbers and precipitation have an 8-12a
resonance cycle from year 1989 to 2007, and it shows
high power in this resonance period. The phase
difference indicates that sunspots are positive
correlated with the annual precipitation in Shangri-La
during the resonance period. In conclusion, the
analysis shows that the periodic responses of sunspot
activity and annual average precipitation mainly
focus on 8-12a, and the corresponding response
periods pass the significance test at 95% level. The
cross-wavelet power spectrum of sunspot numbers
and annual average precipitation of seven
meteorological stations in Yunnan Province shows
that their resonance periods are consistent. It indicates
that the variation of annual average precipitation is
related to solar activity. From the phase angle of
arrows in figure 1, it can be seen that there is a time
lag relationship between the average annual
precipitation and the solar activity index.
3.2 Result of Time Lag Correlation
Analysis
The response of time series often occurs lead or lag
phenomenon. This paper uses this method to study
whether there is a certain time lag relationship
between the two series. Figure 2 is the result of time
lag correlation analysis between sunspot numbers and
precipitation in Yunnan Province. The time lag
correlation analysis shows that the average annual
precipitation of Kunming, Pu'er, Mengla and
Gongshan meteorological stations lag the sunspot
numbers. The lag time are 9 years, 3 years, 7 years
and 8 years. The correlation coefficients are -0.22,
0.23, 0.2 and 0.12 respectively. The average annual
precipitation of Zhaotong, Lijiang and Shangri-La are
6 years, 8 years and 9 years ahead of the sunspot
numbers. The correlation coefficients are 0.22, 0.31
and 0.2 respectively. The results of the time lag
Figure.2 Time lag correlation analysis between sunspots and precipitation at kunming (a), Pu’er (b), Mengla (c), and
Zhaotong (d), Gongshan (e), Lijiang (f), Shangri-La (g) meteorological station.
ISAIC 2022 - International Symposium on Automation, Information and Computing
228

correlation analysis are basically consistent with the
wavelet analysis except the Zhaotong meteorological
station. It may be caused by the large number of
missing values in the data of the Zhaotong
meteorological station. The figure of the time lag
correlation analysis at Shangri-La meteorological
station is different from other meteorological station,
this may be due to the fact that the Shangri-La region
is part of the Three Rivers area, where the water
distribution has a greater effect on precipitation than
sunspot numbers. This method illustrates the
correlation and time-lag characteristics between
sunspot activity and precipitation.
4 CONCLUSIONS
This paper studies the periodic variation
characteristics of solar activity and precipitation at
seven meteorological stations in Yunnan Province
and analyzes the correlation between time series
based on wavelet analysis and time lag correlation
analysis. The main conclusions are as follows.
Based on the cross-wavelet analysis, we study
the periodic responses of sunspot numbers and
average annual precipitation at seven
meteorological stations in Yunnan Province.
The results show that the periodic responses of
sunspot activity and average annual
precipitation are mainly concentrated in 8-12a,
and the response periodicity has significant
characteristics in the high-power region. From
the phase angle, we can see that there is a certain
lead-lag relationship between sunspot numbers
and average annual precipitation in Yunnan
Province. The seven meteorological stations are
selected from different climate zones, which
indicates that solar activity greatly influences
the annual precipitation in different climate
zones, and there is a good correlation between
them.
Based on the time lag correlation analysis, we
find that the average annual precipitation of
Kunming, Pu'er, Mengla, and Gongshan
meteorological stations all lag the changes in
sunspot numbers. The average annual
precipitation of Zhaotong, Lijiang, and Shangri-
La meteorological stations is ahead of the
changes in sunspot numbers. They are basically
consistent with the results of the cross-wavelet
analysis. However, the correlation coefficient
between sunspots and the annual average
precipitation in different meteorological
stations is different, indicating that the response
of annual average precipitation to solar activity
in different regions is inconsistent.
ACKNOWLEDGEMENTS
This work is supported by Yunnan Academician
Workstation of Wang Jingxiu (202005AF150025),
the National Natural Science Foundation of China
(No. 11863002), and Sino-German Cooperation
Project (No. GZ 1284). We thank Wen Chen for the
help of this paper.
REFERENCES
Li, H, J., Gao, J, E., Zhang, H, C., et al. 2017. Response of
Extreme Precipitation to Solar Activity and El Nino
Events in Typical Regions of the Loess Plateau[J].
Advances in Meteorology, 2017:1-9.
Li, Y., Wen, Y., Lai, H., et al. 2020. Drought response
analysis based on cross wavelet transform and mutual
entropy[J]. AEJ - Alexandria Engineering Journal, 59:
1223-1231.
Zhao, Y., Luo, Y., 2021. Wavelet Analysis on Temperature
and Precipitation Changes in Dabie Mountain of West
Anhui[J]. Journal of Physics: Conference Series,
1732(1): 012105.
Cheng, S, B., Argaud, J, P., Iooss, B., et al. 2021. Error
covariance tuning in variational data assimilation:
application to an operating hydrological model[J].
Stochastic Environmental Research and Risk
Assessment, 35: 1019-1038.
Wang, B., Wang, Y., 1996. Temporal Structure of the
Southern Oscillation as Revealed by Waveform and
Wavelet Analysis[J]. Journal of Climate, 9(9): 1586-
1598.
Chellali, F., Khellaf, A., Belouchrani, A., 2010. Wavelet
spectral analysis of the temperature and wind speed
data at Adrar, Algeria[J]. Renewable Energy, 35(6):
1214-1219.
Alperovich, L., Zheludev, V., Hayakawa, M., 2016. Use of
wavelet analysis for detection of seismogenic ULF
emissions[J]. Radio Science, 38(6): 1-13.
Torrence, C., Webster, P, J., 2010. Interdecadal Changes in
the ENSO–Monsoon System[J]. Journal of Climate,
12(8): 2679-2690.
Ge, Z., 2007. Significance tests for the wavelet power and
the wavelet power spectrum[J]. Annales Geophysicae,
25(11): 2259-2269.
Banerjee, S., Mitra, M., 2014. Application of Cross
Wavelet Transform for ECG Pattern Analysis and
Classification[J]. IEEE Transactions on
Instrumentation and Measurement, 63(2): 326-333.
Grinsted, A., Moore, J, C., Jevrejeva, S., 2004. Application
of the cross wavelet transform and wavelet coherence
to geophysical time series[J]. Nonlinear Processes in
Geophysics, 11(5/6): 561-566.
Application of Wavelet Analysis to Correlation Between Sunspot Activity and Precipitation in Yunnan Province
229
