
Multidimensional Analysis of Educational Indicators of the National
Economy Innovative Development
Olha Ilyash
1,2 a
, Larysa Taranenko
1 b
, Olena Trofymenko
1,2 c
, Nataliia Koba
2 d
and
Marzena Sobczak-Michalowska
3 e
1
National Technical University of Ukraine “Igor Sikorsky Kyiv Polytechnic Institute”, 37 Peremohy Ave., Kyiv, 03056,
Ukraine
2
International University of Finance, 37 Peremohy Ave., Kyiv, 03056, Ukraine
3
University of Economy in Bydgoszcz, 2 Garbary, Bydgoszcz, 85-229, Poland
Keywords:
Educational Indicators, Educational Performance, Innovative Development, Educational and Scientific
Breakthrough, National Economy.
Abstract:
The paper is a study of the educational indicators signifying the national economy innovative development.
The subject of the research is the processes defining the formation and advancement of prerquisites for edu-
cational and scientific breakthrough in Ukraine. The paper is aimed at working out the system for assessing
the educational constituent of the national economy innovative development, which is to ensure an effective
state regulation of educational processes as well as to prevent the risks of reducing the educational security of
the national economy. The study is performed by way of applying such general scientific methods as those
of systemic and complex analyses, research of indicators values’ dynamics, system generalization, statistical
methods and the method of taxonomic analysis. As a result of using these methods as well as on the basis
of a multidimensional analysis of educational indicators of the national economy innovative development, in
particular of the international practices of educational and scientific breakthroughs, the authors advance and
substantiate the measures necessary for the effective state regulation of educational processes.
1 INTRODUCTION
The ongoing processes of globalization, an inten-
sive scientific and technological progress taking place
on the basis of artificial intelligence development,
information technology and transdisciplinary scien-
tific knowledge, increase in the interpersonal and
inter-organizational competition that characterize the
present-day global economic system, etc. change dra-
matically not only economic processes but also the in-
dividual’s role and place in them as well as the nature
of the person’s relationships with other participants of
these processes.
Thus, modern society is on the verge of the fourth
industrial revolution, which embraces the process of
a
https://orcid.org/0000-0002-7882-3942
b
https://orcid.org/0000-0002-4533-9986
c
https://orcid.org/0000-0002-2339-0377
d
https://orcid.org/0000-0002-6444-5872
e
https://orcid.org/0000-0002-9533-8316
formation of the society of knowledge and of the
Industry 4.0 (Kobets and Yatsenko, 2019), where
the total digitalization is accompanied by the emer-
gence of new professions that require new knowl-
edge and skills, and, consequently, innovative ap-
proaches to education and human resources develop-
ment. Clearly, in order to make an industrial break-
through 4.0, humanity must first secure an educational
breakthrough based on the new Education 4.0 system
through implementation of the 4th Sustainable Devel-
opment Goal: “Ensure inclusive and equitable quality
education and promote lifelong learning opportunities
for all” as defined by the UN in 2015.
2 LITERATURE REVIEW
The processes of formation and development of the
Education 4.0 system should be based, in our opin-
ion, on the provisions of innovation theory, the no-
tion of knowledge-based economy, the theory of life-
Ilyash, O., Taranenko, L., Trofymenko, O., Koba, N. and Sobczak-Michalowska, M.
Multidimensional Analysis of Educational Indicators of the National Economy Innovative Development.
DOI: 10.5220/0011930800003432
In Proceedings of 10th International Conference on Monitoring, Modeling Management of Emergent Economy (M3E2 2022), pages 23-37
ISBN: 978-989-758-640-8; ISSN: 2975-9234
Copyright
c
2023 by SCITEPRESS – Science and Technology Publications, Lda. Under CC license (CC BY-NC-ND 4.0)
23

long learning (LLL), of knowledge management, self-
study and other present-day theories and ideas.
Defining the knowledge society, Kok (Kok, 2004)
remarks that this notion encompasses all the aspects
of human activities beginning from high-tech produc-
tion up to artistic professions like in media and ar-
chitecture, where knowledge is provided as the basis
for added value creation. In his turn, Leiber (Leiber,
2018), while considering the knowledge society, em-
phasizes the crucial role of the quality of education
in general and that of higher education viewed as a
social, economic and environmental factor. Agrawal
et al. (Agrawal et al., 2021) highlight a high corre-
lation between information communication technol-
ogy (ICT) and knowledge management. Valero and
Van Reenen (Valero and Van Reenen, 2019) prove
that increases in the number of universities are pos-
itively associated with future growth of GDP per
capita. Supporting this view, Bene
ˇ
sov
´
a and Tupa
(Bene
ˇ
sov
´
a and Tupa, 2017) underline the impact of
technology not only on the emergence of knowledge-
intensive products and services, but also emphasize its
much greater impact on people’s education in general.
After all, only highly qualified and highly educated
specialists will be able to control these technologies.
It is clear therefore the increasing role of organiza-
tional education to adapt the people to changes that
occur as a result of technological and economic inno-
vation. The paper (Engstrand and Enberg, 2020) ex-
plores the role of relational power and discursive po-
sitioning in the knowledge integration process using
a definite interdisciplinary project as an example and
thus emphasises the necessity of carrying out more
research that explicitly explores power in the knowl-
edge integration process.
Thus, recent research (Thakur and Arora, 2022;
Mane and Miravet, 2016; Marchiori et al., 2022;
Kucherova et al., 2021) has shown that human capital
makes a significant contribution to economic growth
and technological development primarily through ed-
ucation, innovation and continuous growth. At the
same time, the limited development of human capital
leads to the use of natural resources as the main source
of income, thereby reducing the level of the countries’
economic development. In addition, the relationship
between human capital and innovation at the country
level is based on the fact that various forms of capi-
tal can be converted into resources and other forms of
economic benefit. However, it is only a properly qual-
ified human capital that can ensure the industrial and
technological development of the country as well as
can serve for its economic growth. Therefore, the as-
sessment of education through the prism of country’s
innovative development, in our opinion, should defi-
nitely include indicators of the level of development
of the country’s human capital.
Nedelko et al. (Nedelko et al., 2019), as a re-
sult of studying the strategies and tools for knowledge
management in innovation and Industry 4.0, empha-
size that the use of the notion of knowledge manage-
ment in Industry 4.0 should not only be encouraged
but rather necessitated. It is well known that for the
emergence of new knowledge and its commercializa-
tion, which is the essence of innovation, it is neces-
sary to ensure close ties between industry and sci-
ence and education (Trofymenko et al., 2021). Thus,
we can state that education and science today are the
starting point and the driving force to ensure the inno-
vative development of business and, consequently, of
national economies.
Considering the above-mentioned tendencies, the
issue of measuring the effectiveness of educational
process in accordance with the dynamic global socio-
economic environment has become quite acute. There
are a number of scientific papers substantiating the
indicators of education performance for individual
countries (Braunstein et al., 2022; Riley and Nuttall,
1994; Csom
´
os, 2020) as well as methodologies pre-
sented by various international organizations, which
include educational indicators (IMD - International
Institute for Management Development, 2022; Dutta
et al., 2020; Schleicher, 2019; UNDP, 2019; World-
Bank, 2021; Schwab, 2018). However, given the ur-
gent need to reform education within the process of
Industry 4.0 formation, there is a necessity to search
for new approaches to assessing educational indica-
tors through the prism of their impact on the inno-
vative development of the state, which will serve the
increase in the efficiency of public administration and
control.
Therefore, this paper is aimed at working out the
system for assessing the educational component of
the national economy innovative development, which
will ensure the effective state regulation of educa-
tional processes as well as will prevent the country
form the risks of reducing the educational security of
the national economy. Accordingly, the main issue of
the study is the definition and analysis of educational
indicators, and the formation of recommendations on
the development of educational indicators at various
levels of state policy to ensure innovative develop-
ment of the economy based on the study of effective
global practices. The hypothesis lies in the idea that
the growth of the indicators of education quality will
lead to an increase in the metric of state innovative
development.
M3E2 2022 - International Conference on Monitoring, Modeling Management of Emergent Economy
24

3 METHODS
In the course of the study the authors employed gen-
eral scientific and statistical methods, as well as the
method of a taxonomic analysis. As is known, a
multidimensional statistical analysis is used to deter-
mine the largest number of features that will affect
the object of study. That is why to define the degree
of a cumulative impact of the factorial characteris-
tics on the level of the national economy innovative
development, the authors offered to apply the taxo-
nomic method. The necessity to opt for this method
is born out of the demand to search for a single in-
tegrating indicator out of the large number of indica-
tors that characterize innovative development, which
allows increasing the efficiency of public administra-
tion and control (Ilyash and Stefaniak, 2012).
As the data base for the use of a taxonomic analy-
sis we chose the educational indicators of innovative
development of the national economy of Ukraine as
of the years 2013–2019. Such indicators include the
Human Development Index (HDI), the level of expen-
diture on education of GDP, the Education Index, the
literacy rate (i.e. expected years of schooling), and
Ranking of national higher education system.
Thus, the human development index is a com-
bined index and an indicator of the educational
component of the country’s innovative development
(WorldBank, 2021). The index measures the coun-
try’s achievements in terms of life expectancy, access
to education, actual income of the citizens, and takes
into account changes in the indices of socio-economic
and gender inequality and multidimensional poverty.
In addition, the human development index is adjusted
by political, economic, social, and environmental fac-
tors, such as: human rights and civil liberties, par-
ticipation in public life, social security, the degree
of territorial and social mobility of population, the
level of cultural development, access to information,
health, unemployment, crime, environmental protec-
tion, environmental impact and others. It should be
mentioned this index comprises the following data:
the acquired human capital; the expected duration of
children’s education at school; results of the standard-
ised testing of schoolchildren; the percentage of adult
survivors and the proportion of children without any
developmental disorders (UNDP, 2019).
The literacy level of the country’s population (ex-
pected time of schooling) is set by authors as a sep-
arate indicator of educational development because it
indicates the general educational level of the popula-
tion.
The education expenditures is one of the key indi-
cators of innovative development. Innovative devel-
opment of the domestic economy and strengthening
the social component of state economic security can
be ensured only by increasing human capital expen-
ditures. Investing in education is a vital means of in-
creasing human capital and prospects of the country’s
economic growth. Therefore, the level of expendi-
tures on education of GDP was chosen as one of the
indicators for taxonomic analysis.
The Education Index, which is a sub-index of the
Human Development Index, should be also included
to the educational indicators.
It is the economic development and competitive-
ness of the country that serve as the indicators of the
country’s economic security and largely depend on
the number of educated and competent professionals,
as well as technologies that increase their productiv-
ity. The higher education sector contributes signifi-
cantly to realisation of these needs. In addition, in the
modern world of alterglobalism, those high-quality
higher education systems, which have broad links at
the international level and contribute to the country’s
global development through the exchange of students,
researchers, projects and ideas, demonstrate a high
level of national economy. Therefore, one of the in-
dicators of the educational component of the state in-
novative development at the global level is the rank-
ing of national higher education systems (U21 Rank-
ing of National Higher Education Systems) which en-
ables assessing the overall higher education system of
different countries at various stages of economic and
social development (Williams and Leahy, 2020).
To conduct a taxonomic analysis of the educa-
tional component of innovative development, it is ra-
tional to perform a sequence of the following method-
ological steps (Ilyash et al., 2021):
• to form a matrix with the initial data necessary for
the study of educational indicators of innovative
development;
• to standardize the values of the indicators matrix;
• to form a reference vector representing the growth
of the innovative development component under
study;
• to calculate the distance between individual vari-
ables and the reference vector; item to define the
taxonomic indicator of innovative development.
In accordance with the outlined algorithmic steps,
it is expedient to form an observation matrix based
on the input data. It should be mentioned that in our
study the units (I
i
) are represented by the innovative
development educational indicators. Within the scope
of these indicated we single out the educational com-
ponent of innovative development (E), while the years
sand for characteristic features.
Multidimensional Analysis of Educational Indicators of the National Economy Innovative Development
25

The construction of the matrix respresenting the
initial data by components comprises the following
steps:
The first step presupposes the use of I
(E)
for the
matrix in order to reveal the educational component
of innovative development (size 5×7).
At the second stage, since the indicators of inno-
vative development have different measurement units,
it is necessary to form a matrix of standardized val-
ues. This procedure is performed by replacing the
criteria values with the coefficients standardized in-
dicators (Ilyash and Stefaniak, 2012) according to the
following formula (1):
Z
i
=
I
i
I
(1)
where:
I
i
is the value of the i
th
indicator;
I is the average value of the i
th
indicator.
After indicators’ standardization, to carry out a
further taxonomic analysis, the features of the obser-
vation matrix are to be divided into those of stimula-
tors and destimulators that determine the direction of
the impact on the national economy innovative devel-
opment. In this case, stimulatory factos have a posi-
tive effect on the development level, while destimula-
tory factors restrain.
Differentiation of the studied factors into stimulat-
ing and destimulating ones is given in the table 1.
The division of the indicators into stimulators and
destimulators can serve as the basis for finding out
the ideal reference vector and forming the values of
the indicators (Ilyash and Stefaniak, 2012) in the fol-
lowing way:
(
I
oi
= max I
i j
(stimulator)
I
oi
= min I
i j
(destimulator)
(2)
After that, we receive a vector-standard of the in-
novative development level within the framework of
educational component. To calculate the integrated
taxonomic index, it is necessary to find the average
distance (C
0
), the mean value of the square root of
the average square of the difference of values of char-
acteristics (S
0
), deviation of the distance between the
point-unit and the upper pole point from the value of
characteristics distance (d
i
) for the educational com-
ponent of innovation development according to the
following formulas (3-6):
1) average distance:
C
0
=
1
m
m
∑
i=1
C
i0
(3)
where:
m – the number of periods;
C
i0
– the distance between the point-unit and the
point E
M4
;
2) the mean value of the square root of the average
square of the difference between the values of charac-
teristics:
S
0
=
s
1
m
m
∑
i=1
(C
i0
− C
0
)
2
(4)
C
0
– the average distance;
C
i0
– the distance between the point-unit and the
point E
M4
;
3) deviation of the distance between the point-unit
and the point the reference vector from the value of
characteristics distance:
C
0
= C
0
+ 2S
0
(5)
d
i
=
C
i0
C
0
(6)
where:
S
0
– the mean value of the square root of the aver-
age square of the difference of values of characteris-
tics;
C
i0
– the distance between the point-unit and the
point E
M4
;
C
0
– the distance.
On the basis of the obtained results, we can de-
fine the taxonomic indicator of the level of the system
economic security by the following formula (7):
K = 1 − d (7)
where:
d – deviation of the distance between the point-
unit and the point E
M4
from the value of characteris-
tics distance.
Thus, the obtained indicator can acquire higher
values with the higher values of stimulants, and, con-
sequently, lower ones with low values of stimulants.
By calculating this indicator, we will be able to an-
alyze the directions and scales of changes that occur
in the system under study, in particular, in the inno-
vation system of the national economy on the basis of
one synthetic feature of the educational component.
4 RESULTS
For the innovative development of the national econ-
omy, the development of human capital assets un-
doubtedly remains the driving force. That is why
the study of educational and scientific direction of in-
novative economic development, which is the basis
for ensuring the capital development, is of an urgent
need. At present, the model of education aimed at
M3E2 2022 - International Conference on Monitoring, Modeling Management of Emergent Economy
26
Table 1: Educational indicators of innovative development (stimulator / destimulator).
Symbol Indicator
Stimulator or
destimulator
E Educational component
I
1
Human Development Index Stimulator
I
2
Level of expenditures on education of GDP, % Stimulator
I
3
Education index Stimulator
I
4
Literacy rate of the country’s population (expected years of schooling) Stimulator
I
5
Ranking of the national higher education system Stimulator
training highly qualified industry personnel is almost
completely lost, while industrial enterprises cannot
function efficiently with a shortage of specialists hav-
ing an up-to-date training. In order to preserve the
industrial potential, the structure of innovative edu-
cation should form a symbiosis of higher education
institutions, research institutes, production facilities
of industrial enterprises and public authorities. How-
ever, the majority of organizations cannot make the
use of human capital resources since they are limited
by the approaches aimed at performing specific tasks
rather than being focused on research and develop-
ment. At the same time, industrial enterprises agree
that managing human capital development is one of
the priorities of innovation progress.
Unfortunately, in Ukraine there is a significant
gap between the knowledge and competencies of the
students who graduate almost without any practical
experience, forcing employers to spend time prepar-
ing them for a particular job (Kahkonen, 2018; Bhat-
tacharya, 2017). To build innovative human capital,
the educational system should include more practical
skills, in particular through the integration of busi-
ness into the educational process, and, thus, provide
the generation-to-come with the up-to-date theoreti-
cal and innovative practical tools.
The research results of the different countries’ ex-
perience on the development of education are given
below.
In particular, such countries as Singapore, China,
India, South Korea, USA, Japan, Finland, Brazil, and
others demonstrated the educational breakthrough
achieved through high quality STEM education, due
to increase in expenditures on education, by means
of supporting fundamental research and a number of
programs aimed at developing the level of general
public digital competence as well as thanks to the
growth in patent productivity in priority sectors of the
economy.
Singapore, for instance, has introduced programs
to set up technical schools and international corpo-
rations to train unskilled workers in the spheres of
information technology, petrochemistry and electron-
ics. The strategy of involving Singapore’s multina-
tional organizations in training its workforce has con-
tributed in the long run to the country’s economic
prosperity. As a result of the education system re-
form taken place in Singapore, minimum compul-
sory educational standards have been introduced for
all schools, English has become an obligatory disci-
pline for all types of schools and a number of other
subjects are tought in English. The government is
constantly investing in the education of Singaporean
students in the best universities world, while creat-
ing at the same time leading research and educational
centers in Singapore. Distinguished results in edu-
cation have been achieved due to implementation of
the Plan of Research and Innovation Enterprises com-
pleted by 2020 (Research, Innovation and Enterprise
Secretariat, 2016).
China’s economic reform program was based on
lowering government norms on prices in education
sphere and increasing investment in education of per-
sonnel (Santacreu and Zhu, 2018).
India initiated a policy of promoting the quality
of the workforce. The introduction of the language
law made English a second national language, which
contributed to the growth of the country’s technologi-
cal development and signing international agreements
with the leading companies in the IT sector.
South Korea, the USA, Japan, and China have
the policy of increasing the share of GDP in research
and development (R&D), which results in the growth
of intensity and quality of research and development
(World Bank, 2019).
In Finland, there are programs to expand cooper-
ation with foreign experts since due to the aging of
its population in some industries, there is a shortage
of workforce. There are also programs aimed at fi-
nancial support of innovations in R&D. One euro in-
vested in innovation for research brings about 10-20
euros net profit, which corresponds to 70% of invest-
ments (compare, for example, in Russia they spend
10% of investments, while in France 90%).
In Brazil, there is the Bolsa Familia Income Trans-
fer Programme (Family Assistance), which provides
Multidimensional Analysis of Educational Indicators of the National Economy Innovative Development
27

monetary benefits to families who send their chil-
dren to school. The government has also introduced
the policy of increasing investments in education to
strengthen human resources.
It seems inevitable that automation, digitalization
and other forms of technology will put an end to mil-
lions of jobs and will create new opportunities for the
workforce. At the same time, it is of vital importance
to prepare the next generation of workers to partic-
ipate in the development of Industry 4.0. It is ed-
ucation that should be the driver of future skills by
means of going beyond the traditional teaching, in-
cluding entrepreneurship, soft leadership, technology
and workforce readiness. Accordingly, it proves the
need to provide such the condition for the develop-
ment of human resources required to meet the chang-
ing demands of the twenty-first century as the im-
provement of quality of primary schools education.
Since the adoption of the Universal Declaration of
Human Rights in 1948, countries have been making
efforts to universalize primary education. However,
the quality of education is going down due to the low
quality of primary education. Thus, in 2019, Ukraine
demonstrates the lowest level of quality of primary
education as compared to the world’s leading coun-
tries. The percentage of students with the highest re-
sults in at least one field (reading, mathematics, and
natural sciences) is only 7.5%, which is from three
to five times lower than in China (49.3%), Singapore
(43.3%), South Korea (26.6%) and Canada (24.1%),
while it accounts for 50% of the quality of primary ed-
ucation in Denmark (15.8%). Some of the advantages
of high quality primary education in Singapore and
South Korea comprise effective leadership, quality
teacher advanced training, high salaries for teachers,
teachers’ professional development strategy, a high
percentage of modern equipment supply, the ability to
work with innovative interactive technologies as well
as social security of teachers (Schwab, 2018). In the
USA, the Regional Councils for Economic Education
and the State Federal Reserve offer the teachers an
annual weekly summer training program based on the
model “Key to Financial Success”. A comparison of
the main indicators of the educational and scientific
breakthrough of Ukraine with countries of progres-
sive development in 2019 is presented in the table 2.
Over the last two centuries, alongside the increase
in the number of students acquiring primary educa-
tion, there has been a steady increase in the level of
literacy of the world population. However, in some
African countries, the literacy rate among young peo-
ple is still below 50.0%. According to the level of
population literacy, Ukraine ranks 51st in the world
ranking of competitiveness. Thus, the average num-
ber of years spent on studying and the expected du-
ration of education in Ukraine is 10,4 years, which
sets it ahead of China (7,8 years) by 2,6 years and be-
low Germany (17,1 years), Canada (13,8 years) and
the United States (13,4 years). Among the possible
threats of insufficient literacy in Ukraine’s popula-
tion, to name but a few, are the state’s non-recognition
of other than official forms, formats and methods of
training, lack of the culture of dual education within
the framework of labor relations, lack of employers’
interest in financing employee training, the employ-
ees’ insufficient practical and soft skills (Karpenko,
2015).
As for the education in Japan, it is almost 32%
funded by private sources. The education in Denmark
is entirely funded by Danish government which guar-
antees free education for all (World Bank, 2019). In
the Netherlands and other countries of Northern Eu-
rope, the government has developed programmes to
provide opportunities to participate in formal and /
or informal education for adults and the unemployed
(64% and 57% of adults and the unemployed have al-
ready participated in these programmes).
A feature of the national education system is a rel-
ative high level of funding, i.e. the maximum amount
of expenditures is allocated on education. Thus, the
indicators of education financing in Ukraine in 2019
exceed the average indicators of the OECD countries
(by 6% of GDP) (Zhylinska et al., 2017), in particu-
lar Denmark (6,5% of GDP), the United States (6%),
Finland (5,7%) and are 2,5 times higher than in Sin-
gapore (2,7%), Japan (3,2%), and China (3,6%). A
common feature of the leading countries in terms of
financing higher education with the insignificant level
of public sector spending is a high share of of funding
provided by the private sources, in particular, in the
United States – 26%, Australia – 23%.
Digital competencies of the population play quite
an important role in the educational and scientific
breakthrough (Bondarchuk et al., 2022). However,
as of 2017, according to the Digital Skills Index
of the European Digital Economy and Society In-
dex (DESI), almost half (44,0%) of the EU popula-
tion does not have the necessary skills to use digi-
tal technologies (Russo, 2020). To ensure an educa-
tional breakthrough in Ukraine, the Digital Agenda
of Ukraine – 2020 was adopted with an aime to use
digital technologies, create a digital society and en-
sure the competitiveness of the country and its citi-
zens. Thanks to digitalization, Ukraine is able to re-
duce the gap in international indicators of competi-
tiveness (Kuybida et al., 2019), since in 2019 it ranked
56th with the index 4,5 economic units (EU) and as
compared to 2016 it increased the level by only 8
M3E2 2022 - International Conference on Monitoring, Modeling Management of Emergent Economy
28
Table 2: Indicators of educational breakthrough in Ukraine and the countries of progressive development in 2019 (based on
(WorldBank, 2021; UNDP, 2019; IMD - International Institute for Management Development, 2022; Schwab, 2018)).
Indicators
Ukraine
Finland
Germany
Denmark
USA
Canada
Australia
South Korea
China
Singapore
Japan
Quality of primary education (%
of students with the highest results
in at least one of the disciplines:
(reading, mathematics, natural sci-
ences, level 5 or 6)
7,50 21,00 19,10 15,80 17,10 24,10 18,90 26,60 49,30 43,30 23,30
The literacy level of the country’s
population (the average number of
years spent studying) and the ex-
pected duration of education
10,40 17,10 12,40 12,60 13,40 13,80 12,40 12,10 7,80 11,90 12,80
Index of digital competencies of
economically active population
4,50 5,10 5,80 5,40 5,30 5,10 5,00 5,00 4,70 5,60 4,40
Expenditures on education, % of
GDP according to IMD data
6,00 5,70 4,10 6,50 6,00 4,40 5,00 5,00 3,60 2,70 3,20
points. The leading countries are Finland (5,8), Sin-
gapore (5,6), Denmark (5,4) and the United States
(5,3). With the support of the National Library Coun-
cil and the Singapore Cybersecurity Agency, curric-
ula have been updated with a view to providing better
cybersecurity awareness and acquiring skills to detect
fake news and protect onself against it. Besides, the
government introduced a route map of teaching tech-
nology intensity, which is a three-year plan to help
small and medium-sized enterprises (SMEs) acceler-
ate technology implementation and help the popula-
tion expand their digital capabilities (e.g., a Memo-
randum on cooperation between SkillsFuture Singa-
pore and Microsoft has been signed aimed at help-
ing make profit for 5000 people and 100 small- and
medium-sized enterprises). Denmark has developed
the Digital Literacy Manifesto, which has inspired
politicians to reflect on digital skills and transforma-
tion.
We shall remark here that the process of monitor-
ing the educational component of innovation devel-
opment should be carried out within the system of in-
dicators: correlation between the level of education
expenditures to GDP, human development index, ed-
ucation level index, literacy level and the rating of
the higher education system. The system of the men-
tioned indicators is presented in the table 3.
According to the report submitted by UNDP in
2019, Ukraine ranked 74th in the human develop-
ment index among 183 countries surveyed. Given
the significant part of the population with higher edu-
cation (82%), Ukraine has an average human devel-
opment index among European countries, which is
0,779 points. At the same time, the share of people
engaged in scientific activities is only 0,34% out of
the total employed population.
It should be added that 66 countries of the world
belong to the category of high level of human de-
velopment, among which: Switzerland (2nd place,
0,955 points), Germany (6th place, 0,947 points),
Great Britain (13th place, 0,931 points), Canada
(16th place, 0,929 points), Estonia (29th place,
0,892 points), Lithuania (34th place, 0,882 points),
Poland (35th place, 0,880 points), Romania (49th
place, 0,828 points), Kazakhstan (51st place, 0,825
points), Russia (52nd place, 0,824 points), Belarus
(53rd place, 0,823 points), Turkey (54th place, 0,820
points), Bulgaria (56th place, 0,816 points), Georgia
(61st place, 0,812 points), Serbia (64th place, 0,806
points).
The World Bank estimates the human capital in-
dex in Ukraine at 0,63 points, so Ukraine ranks 50th
among 157 countries. Thus, a child born in Ukraine
can rely upon acquiring only 63% of the potential
level of human capital, being possible only under con-
dition of receiving complete education and having a
good health. In terms of figures, Singapore (88%),
Hong Kong (81%) and Japan (80%) have been ranked
first for several years in a row. The top ten countries
also include South Korea, Canada, Finland, Macau
and Sweden (about 88%), Ireland and the Netherlands
(79%). The lowest positions in ranking are occupied
by the CAR (29%), Chad (30%) and South Sudan
(31%).
The comparison of the index of human capital
with GDP per capita in the world allows us to trace
Multidimensional Analysis of Educational Indicators of the National Economy Innovative Development
29
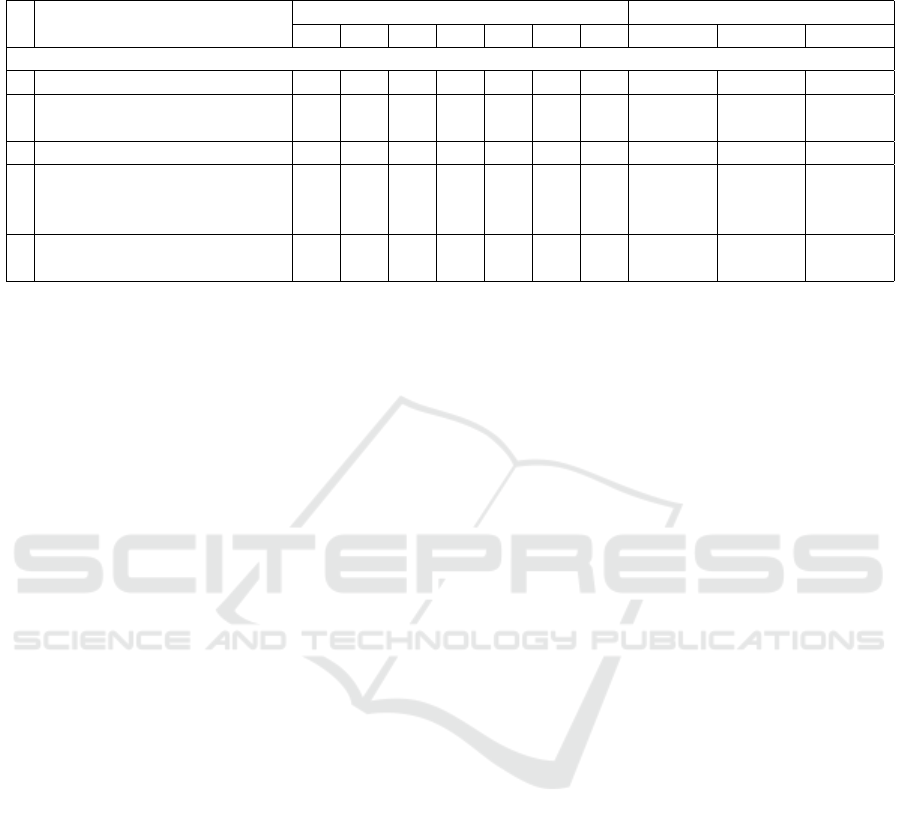
Table 3: The rate of change of the educational component indicators signifying the innovative development of Ukraine
within the period of 2013–2019 (based on (WorldBank, 2021; UNDP, 2019; IMD - International Institute for Management
Development, 2022)).
No
Indicators
Years Growth rate, %
2013 2014 2015 2016 2017 2018 2019 2019/2018 2019/2015 2019/2013
Educational indicators
1. Human development index 0,74 0,75 0,74 0,75 0,75 0,75 0,77 102,67 104,05 104,0
2.
Level of education expenditures
to GDP, %
5,90 6,20 6,70 6,70 6,00 5,90 5,00 84,75 74,63 84,75
3. Education level index 0,791 0,8 0,791 0,792 0,794 0,792 0,799 100,88 101,01 101,01
4.
Literacy level of the country’s
population (expected time of
schooling)
14,90 15,00 14,90 15,10 15,10 15,10 15,10 100,00 101,34 101,34
5.
Ranking of the national higher
education system
49,9 43,9 44,0 42,1 47,7 47,4 45,1 95,15 102,50 90,38
the correlation between the level of the country’s eco-
nomic development and the level of education re-
ceived by human capital (figure 1). Thus, in gen-
eral, the countries with the highest human capital in-
dex have higher GDP per capita: Singapore (0,88
and 652333), Japan (0,80 and 40246), Canada (0,80
and 46194), Finland (0,80 and 48782), Switzerland
(0,80 and 51615), Ireland (0,79 and 78660,96). The
lowest positions are occupied by Congo (0,37 and
553), Yemen (0,37 and 774), Rwanda (0,38 and 820),
Ethiopia (0,38 and 855), Burundi (0,39 and 261). It
should be added that in 2019 the value of the human
development index in Ukraine was 0,63, while GDP
per capita amounted to 3656 (UNDP, 2019).
The total amount of education funding (from pub-
lic, local and private sources) varies from 5,0% to
6,7% of GDP and is characterized by declining dy-
namics. Although the Law of Ukraine “On Educa-
tion” states that education funding should comprise
at least 7% of GDP, in 2019 the amount of financial
support in this area was only 5,0% and the share of
expenditures on education in the budget of Ukraine
comprised 17,1% (State Statistics Service of Ukraine,
2021). Examining the dynamics of this indicator
changing throughout 2014–2019, we can single out
two periods: the 1st period of 2014–2016 is marked
by a decrease of 3,6 percentage points, while the 2nd
period (2016–2019) is characterised by an increase of
1,6 percentage points.
We should also point out that starting from the
year 2015, the consolidated budget expenditures on
education in GDP have also been decreasing. Thus,
despite its unstable dynamics, expenditures on educa-
tion as a percentage ratio of GDP amounted to 6,1% in
2019, while in 2016 it was 5,4%, which is 0,9% lower
than in 2014. At the same time, it should be noted
that in comparison with the EU countries, Ukraine
spends much more on education. Thus, the total ex-
penditure on education from GDP in Poland is 4,6%,
in Latvia – 4,7%, in Italy – 3,8%, Germany – 4,8%,
Estonia – 5,2%, Switzerland – 5,1%, and Romania –
3,0%. The high level of expenditures on education in
Ukraine is explained by the fact that the majority of
Ukrainian higher education institutions are financed
from the state budget (72%), while in other countries
a significant share is made up of private educational
institutions (43%).
Another key indicator of innovative development
in the context of ensuring the economic security of
the country is the Education Index, which is a sub-
index of the Human Development Index (WorldBank,
2021). The optimal value of the indicator for the de-
veloped countries is no less than 0,8 points. That is
why in 2019 Ukraine occupied the 46th rank (0,797
points) which testifies a significant achievement of the
country’s population in education in terms of adult lit-
eracy and the total number of students receiving edu-
cation. Figure 2 shows the general dynamics of the
education index among other indicators comprising
the educational component of innovative development
considered within the analysed period.
The education index also allows estimating the av-
erage number of, as well as the expected duration of
education of the population, which in Ukraine corre-
spond to 11,4 and 15,1 years respectively. Leading
positions in the world are occupied by Australia (22,0
years), Belgium (19,8 years), Sweden (19,5 years),
Finland (19,4 years), Iceland (19.1 years), Denmark
(18.9 years), New Zealand (18,8 years), Ireland (18,7
years), the Netherlands (18,5 years), and Norway
(18,1 years). We will emphasise that creation of con-
ditions for lifelong learning ensures the adaptation
of labor capital to rapid technological changes, and,
consequently, accelerates economic development and
serves for the growth of national economy competi-
tiveness.
M3E2 2022 - International Conference on Monitoring, Modeling Management of Emergent Economy
30
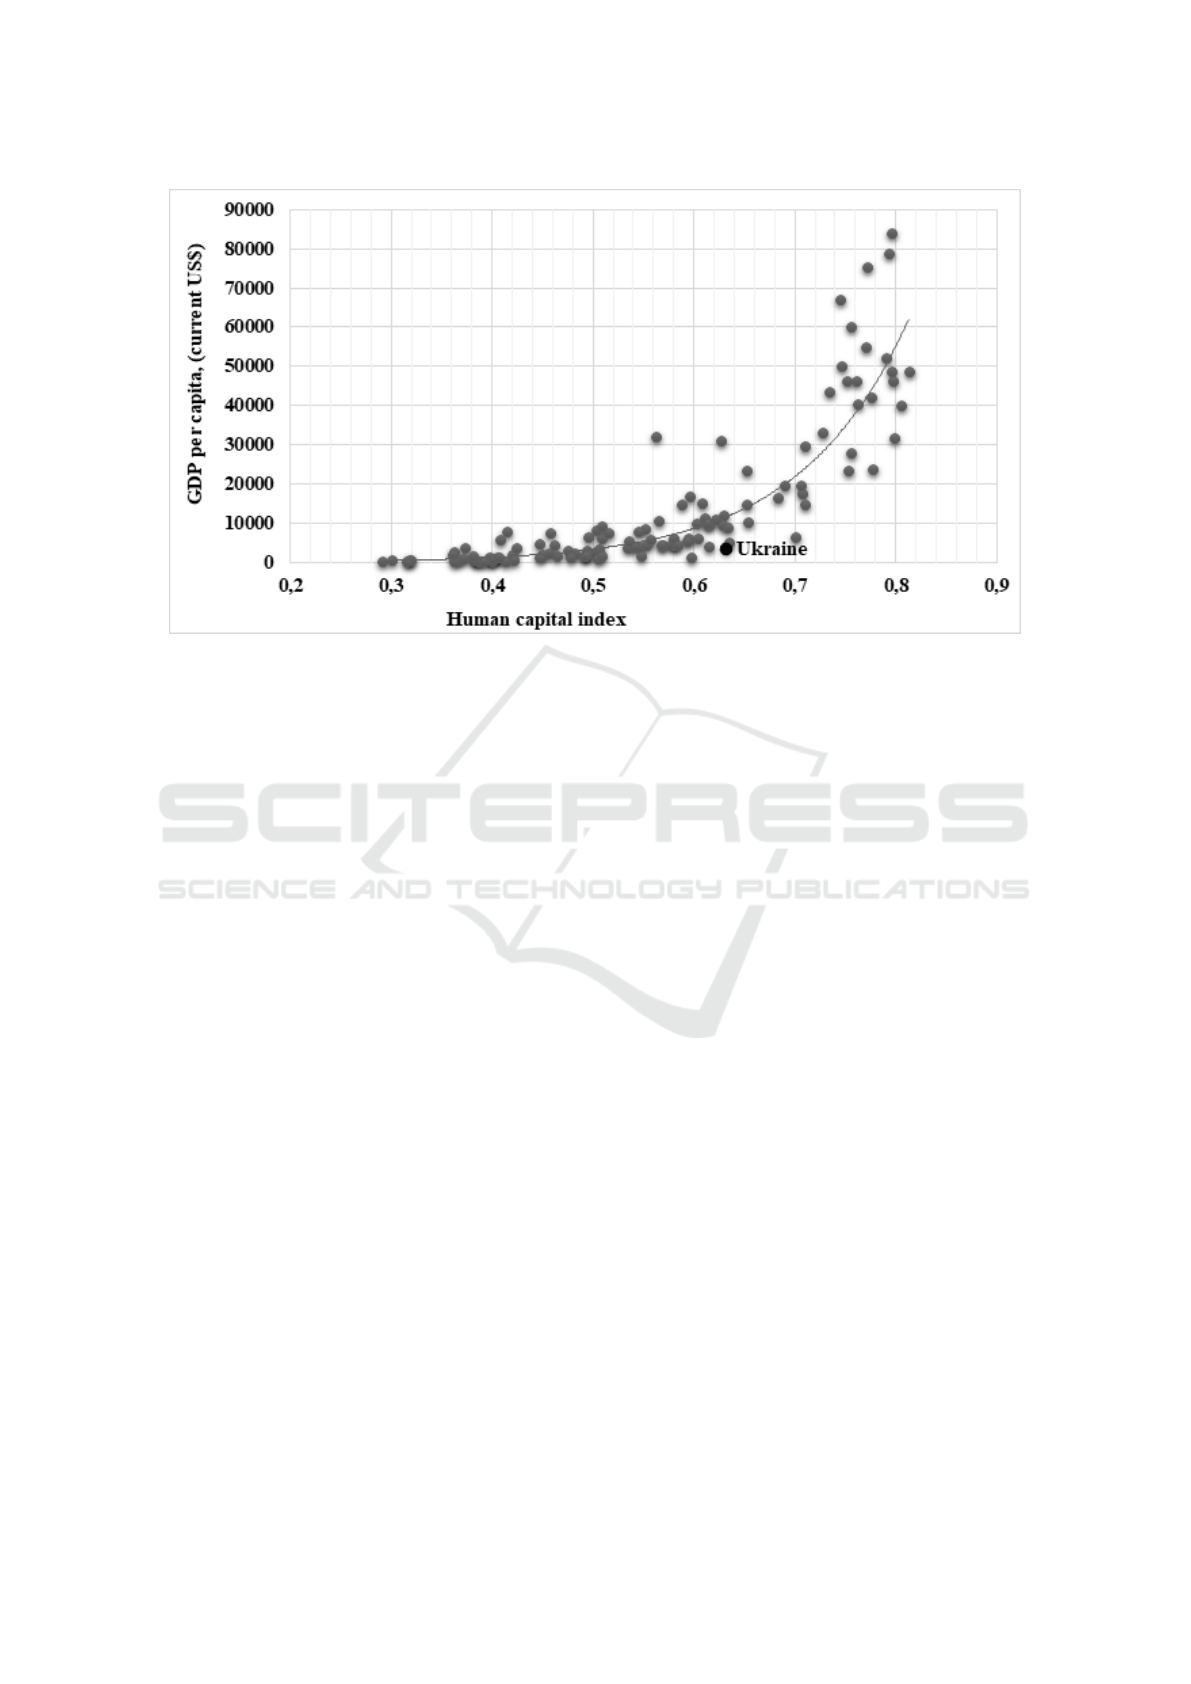
Figure 1: The ratio of the human capital index and GDP per capita of Ukraine and the world in 2019 (based on (UNDP,
2019)).
For instance, in 2020, Ukraine ranked 36th. If to
evaluate this indicator in terms of its individual con-
stituents, we can see that according to the degree of
investments from both the private and public sectors
Ukraine occupies the 27th place (52,6 points); as to
the public policy and regulation as well as the pos-
sibility of acquiring education, Ukraine takes 39th
place (70,6 points); according to the level of interna-
tional cooperation, which demonstrates the degree of
openness of the higher education system, Ukraine is
at the 38th place (40,4 points); considering the quality
of scientific research, scientific publications, compli-
ance of higher education with the demands of the na-
tional labor market, including further employment of
educational institutions’ graduates, Ukraine occupies
42nd place with a score of 28,7 points. At the same
time, the highest ranking include the USA, Switzer-
land, Denmark, Singapore, Sweden, Great Britain,
Canada, Finland, Australia, the Netherlands, and Nor-
way, where the overall indicator value is no less than
80 points.
It is worth noting that recently there has been a
tendency to reduce the number of higher education
institutions. Thus, in 2019, the Ministry of Educa-
tion and Science of Ukraine granted the right to carry
out activities in the field of higher education only to
281 educational institutions, which is 25% less than
in 2010. A similar tendency is typical of the indica-
tor “the number of students per 10000 of population”,
which during the last 9 years dropped 0,6 times from
476 to 302 students. The reasons for this negative
tendency is the decrease in the birth rate, which, in
its turn, led to a reduction in the number of university
applicants and consequently in a number of students
in 2019 by 63% as compared to 2010 (figure 3). Re-
garding the academic and teaching staff in the field of
education, it should be mentioned that there are 14,25
students per teacher in secondary schools, and 10,75
students per one teacher in higher educational insti-
tution, which is 1,5 times lower comparing with the
average indicator in the majority of economically de-
veloped countries.
As for education expenses, there has been a grad-
ual increase in private sector expenditures on R&D
(by UAH 177 billion or 66,6% within the period of
2013–2019), the following indices remain low: the
levels of expenditure on education (5,0% of GDP
in 2019 and a decrease by 0,9 percentage points
by 2013), implementation of scientific and techni-
cal work (0,43% and 0,27 percentage points, respec-
tively), ranking of the national system of higher edu-
cation (45,1% and a decrease by 4,8 percentage points
by 2013), the amount of scientific and technical work
being realized (0,3% to GDP and a decrease by 0,17
percentage points by 2013) and specialists who per-
form scientific and technical work (0,48% out of the
total number of employees and a decrease by 0,32
percentage points by 2013). It is also observed de-
clining in the level of patent productivity, reduction in
the number of specialists involved in R&D implemen-
tation, failing to maintain leading positions in pub-
lic funding of scientific and technical work, budget
funding including (State Statistics Service of Ukraine,
2021).
Multidimensional Analysis of Educational Indicators of the National Economy Innovative Development
31
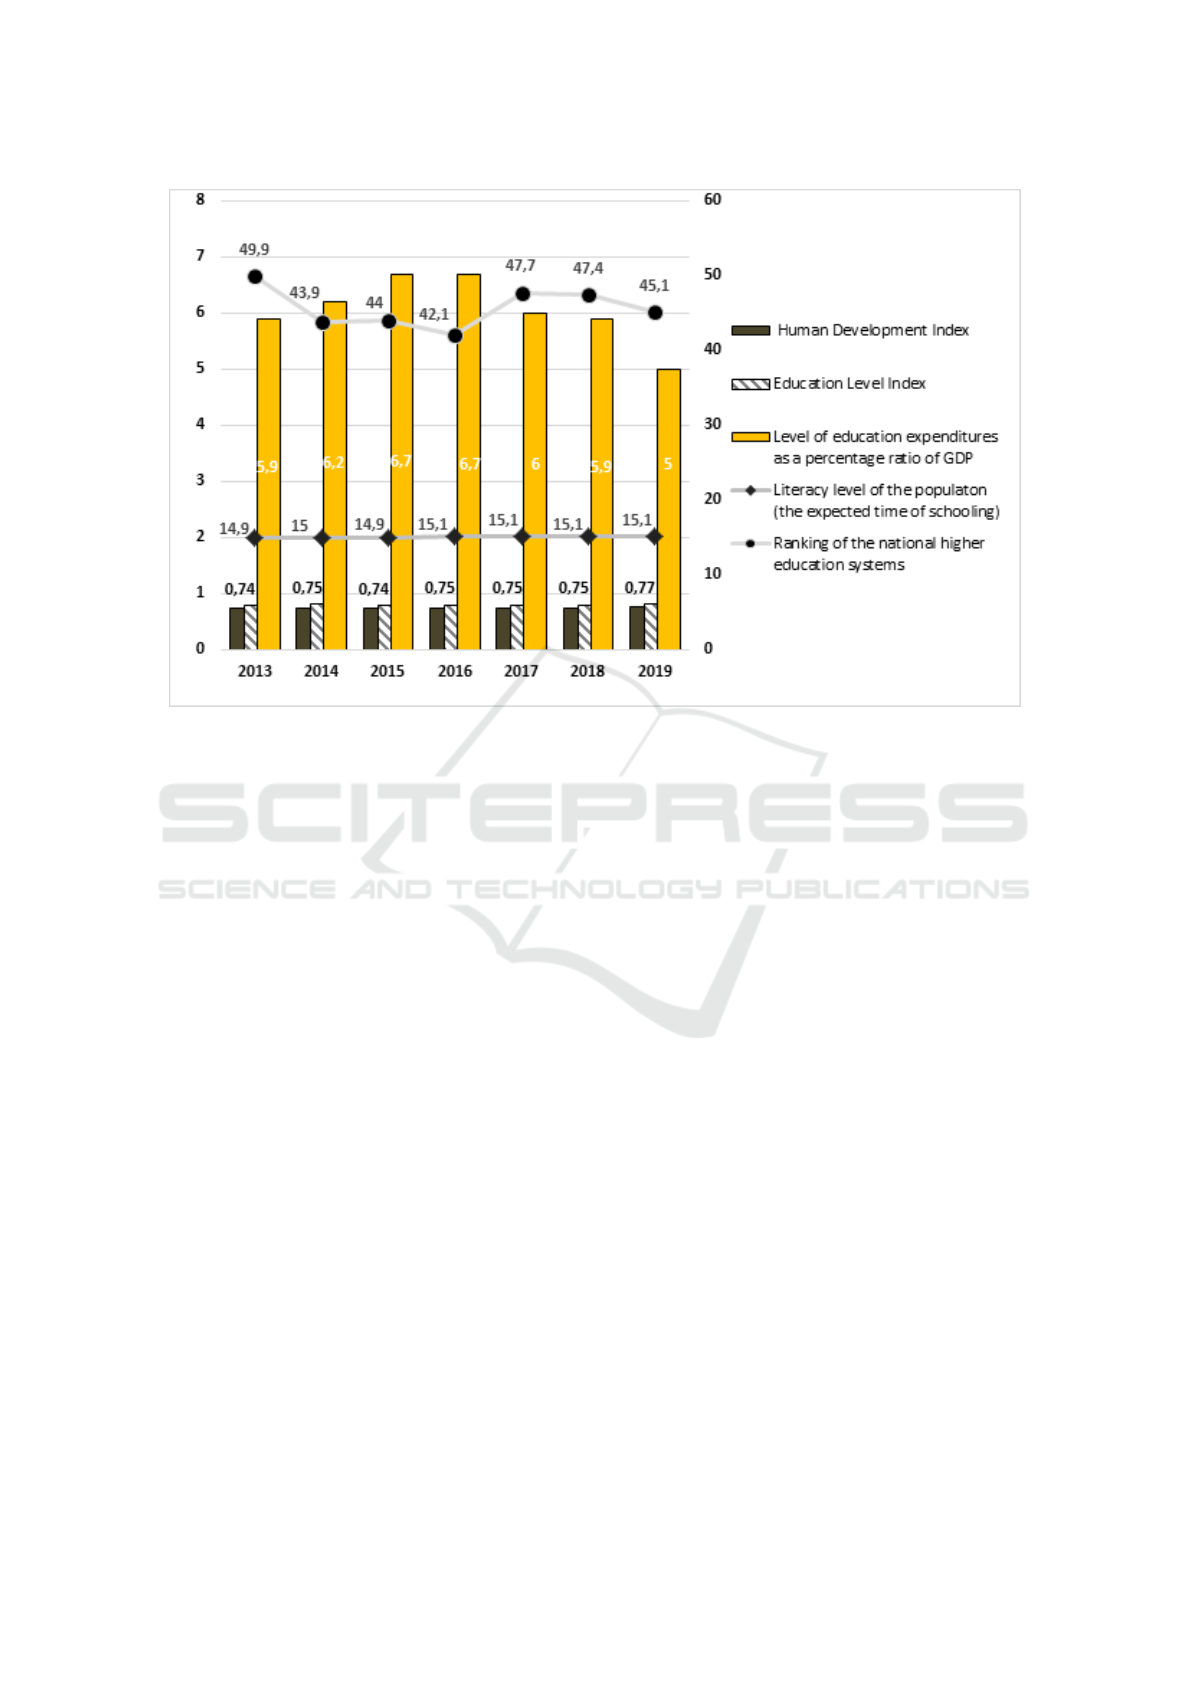
Figure 2: Changes in the education index within the system of indicators comprising the educational component of Ukrainian
innovative development from 2013 to 2019 (based on (Williams and Leahy, 2020; UNDP, 2019; WorldBank, 2021)).
To overcome the negative phenomena in the field
of education, it is necessary, first of all, to build the
relevant skills and competencies in specialists-to-be
through a STEM-oriented approach to teaching and
learning (Le et al., 2021; Hrynevych et al., 2021).
Thus, in the UK, to meet the demands for specialists
in the STEM sphere it is necessary to have more than
100 thousand people graduate by 2020, while in Ger-
many there is a shortage of 210 thousand workers in
natural sciences, mathematics, technology and com-
puter science. However, to ensure the dynamic de-
velopment of the national economy, it is essential to
either significantly increase the intellectual potential
of STEM specialists, or there should be a transition
of the economic development to a new phase with the
use of technologies of a new generation (Kelley and
Knowles, 2016). For the development of digitaliza-
tion processes it is important also taking into account
such world experience as Digital Competence Pro-
gram, the Danish “Digital Literacy Manifesto” (Kuy-
bida et al., 2019).
Thus, modernisation of the education system must
be carried out taking into account the directions of the
international economy development as well as defin-
ing the role and place of the country in the global di-
mension. With such an approach to the education sys-
tem formation in a short period of time Ukraine will
have had the trained personnel of necessary special-
izations.
After studying the above mentioned factors influ-
encing education development in Ukraine as well as
in other countries, we have applied the taxonomic
analysis. First, we compiled a matrix of input data
I
M4
:
0,74 0,75 0,74 0,75 0,75 0,75 0,77
5,90 6,20 6,70 6,70 6,00 5,90 5,00
0,79 0,80 0,79 0,79 0,79 0,79 0,79
14,9 15,0 14,9 15,1 15,1 15,1 15,1
49,9 43,9 44,0 42,1 47,7 47,4 45,1
The next step was the formation of a matrix of
standardized values of Z
M4
:
0,99 1,00 0,99 1,00 1,00 1,00 1,03
0,95 1,00 1,08 1,08 0,97 0,95 0,91
1,00 1,01 1,00 1,00 1,00 1,00 1,01
0,99 1,00 0,99 1,00 1,00 1,00 1,00
1,10 0,97 0,97 0,93 1,05 1,04 0,99
According to the results of the chosen methodol-
ogy application, we received the vector of the educa-
tional component being the standard of the level of
innovative development within the framework of the
educational component:
E
M4
= (1.03; 1.11; 1.01; 1.00; 1.10)
M3E2 2022 - International Conference on Monitoring, Modeling Management of Emergent Economy
32
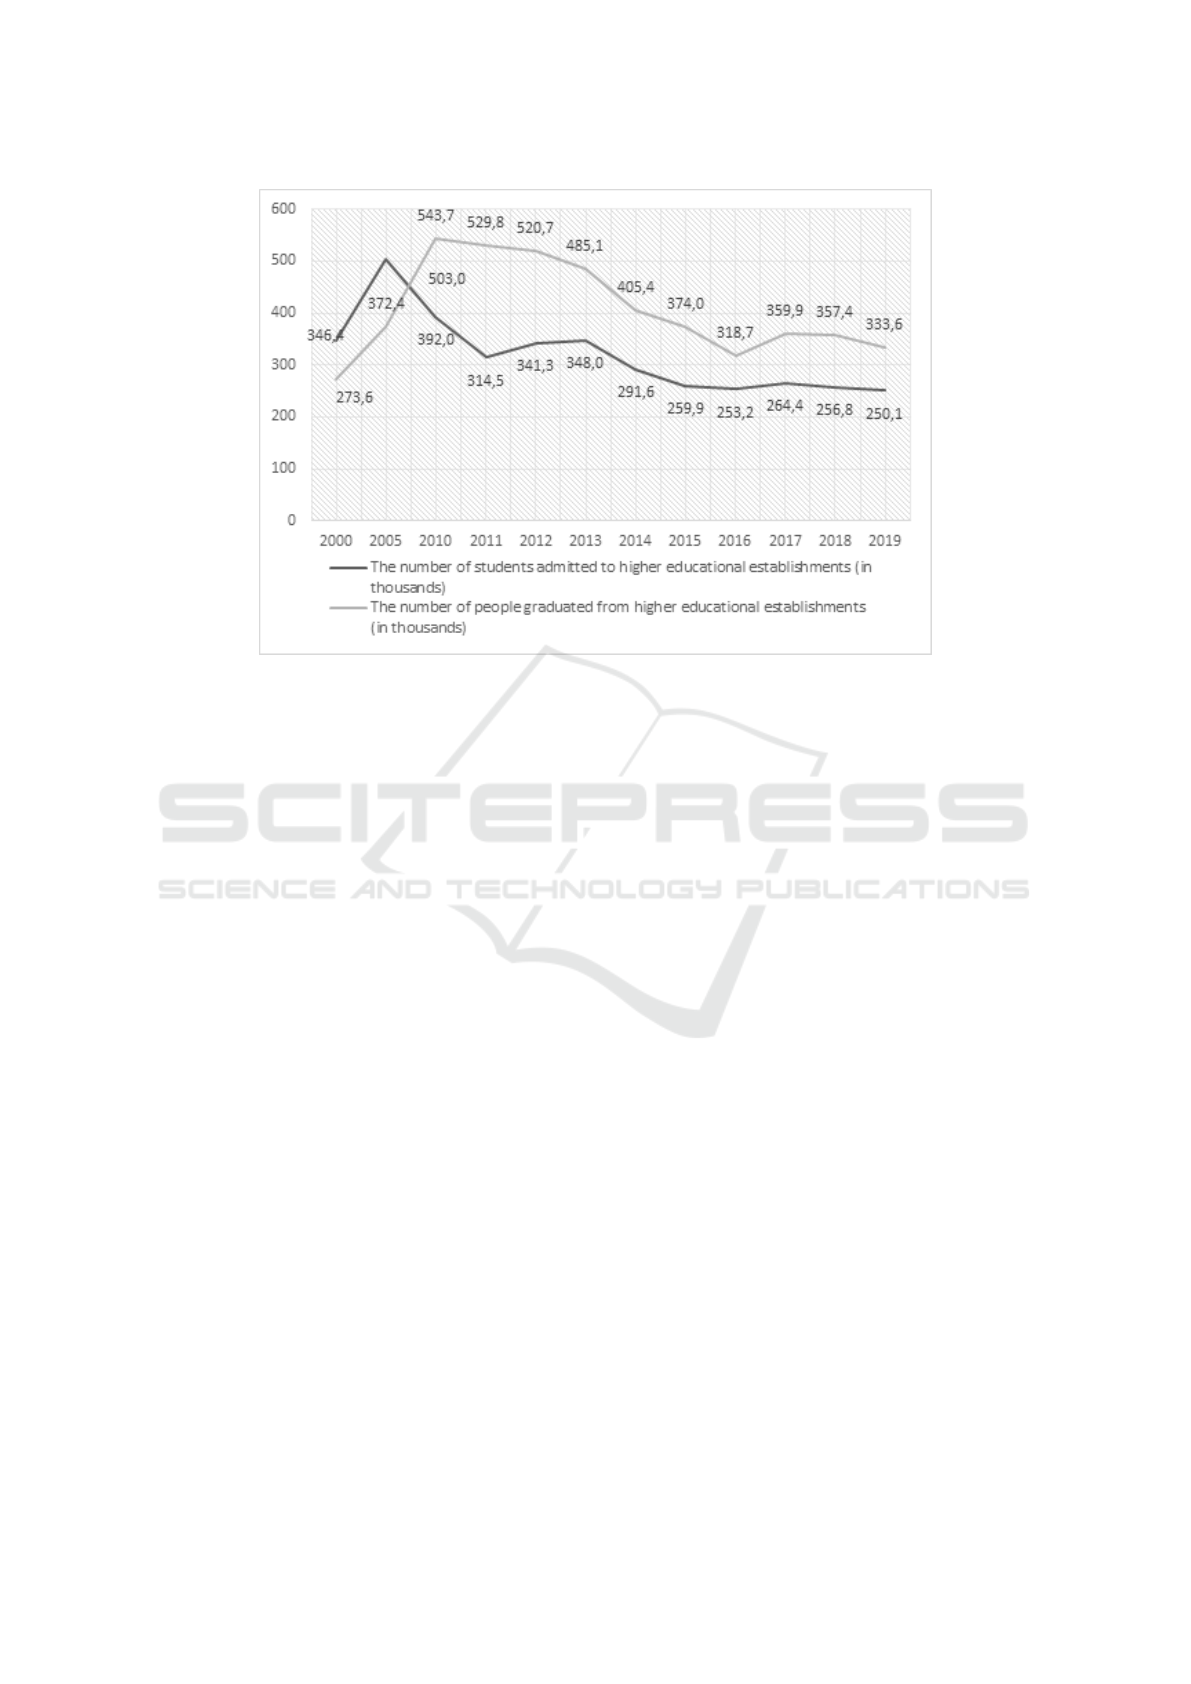
Figure 3: Dynamics of the indicators of higher education in Ukraine in 2000, 2005 and during the period from 2010 to 2019
(based on (Williams and Leahy, 2020; UNDP, 2019; WorldBank, 2021)).
At the next step of our research we calculated the
taxonomic indicators of the educational component of
the country’s innovative development.
The closer the value of the taxonomic coefficient
to one, the greater is the impact of a particular ed-
ucational indicator on the national economy innova-
tive development. The calculations of taxonomic in-
dicators of the educational component of the national
economy innovative development within the period
from 2013 to 2019 are given in the table 4.
The taxonomic indicator’s dynamics in the context
of the educational component of the country’s innova-
tive development is shown in figure 4.
Despite the average value of the human develop-
ment index of European countries, the taxonomic in-
dicator of the educational component as a part of in-
novative development is characterized by a low share
(0,008).
Thus, the taxonomic analysis of the educational
component of the national economy innovative devel-
opment proves its negative dynamics, which signifies
the importance of taking into account the changes in
educational indicators as well as timely response to
these changes for the effective state regulation of the
human capital development, which serves as the ba-
sis for the development of innovation and prevention
from the risks of reducing educational security of the
national economy.
5 DISCUSSION AND
CONCLUSIONS
The developed in the paper advanced system for as-
sessing the educational constituent of the national
economy innovative development, performed on the
basis of taxonomic analysis allows taking into ac-
count the main indicators of the educational devel-
opment in the country, thus simplifying the analysis
of their impact on the national innovation system and,
thus, serves as an effective tool for finding optimal so-
lutions in the state regulation of educational processes
as the basis for innovative activities of all its partici-
pants.
As a result of the performed research, it was found
out that the potential of the educational and scientific
components of the national economy of Ukraine in-
novative development is not realized to its full. These
results elucidate the reasons for Ukraine’s weak po-
sition in the state innovative economic development,
at present being one of the most important factors of
economic security. Therefore, judging from the re-
search results, in order to guarantee the national econ-
omy innovative development, the primary task is to
ensure the growth of taxonomic indicators within the
educational component.
In particular, the lack of systematic managerial
decisions by state authorities in solving problems of
educational policy development requires scientific re-
search to put forward proposals and set primary func-
Multidimensional Analysis of Educational Indicators of the National Economy Innovative Development
33
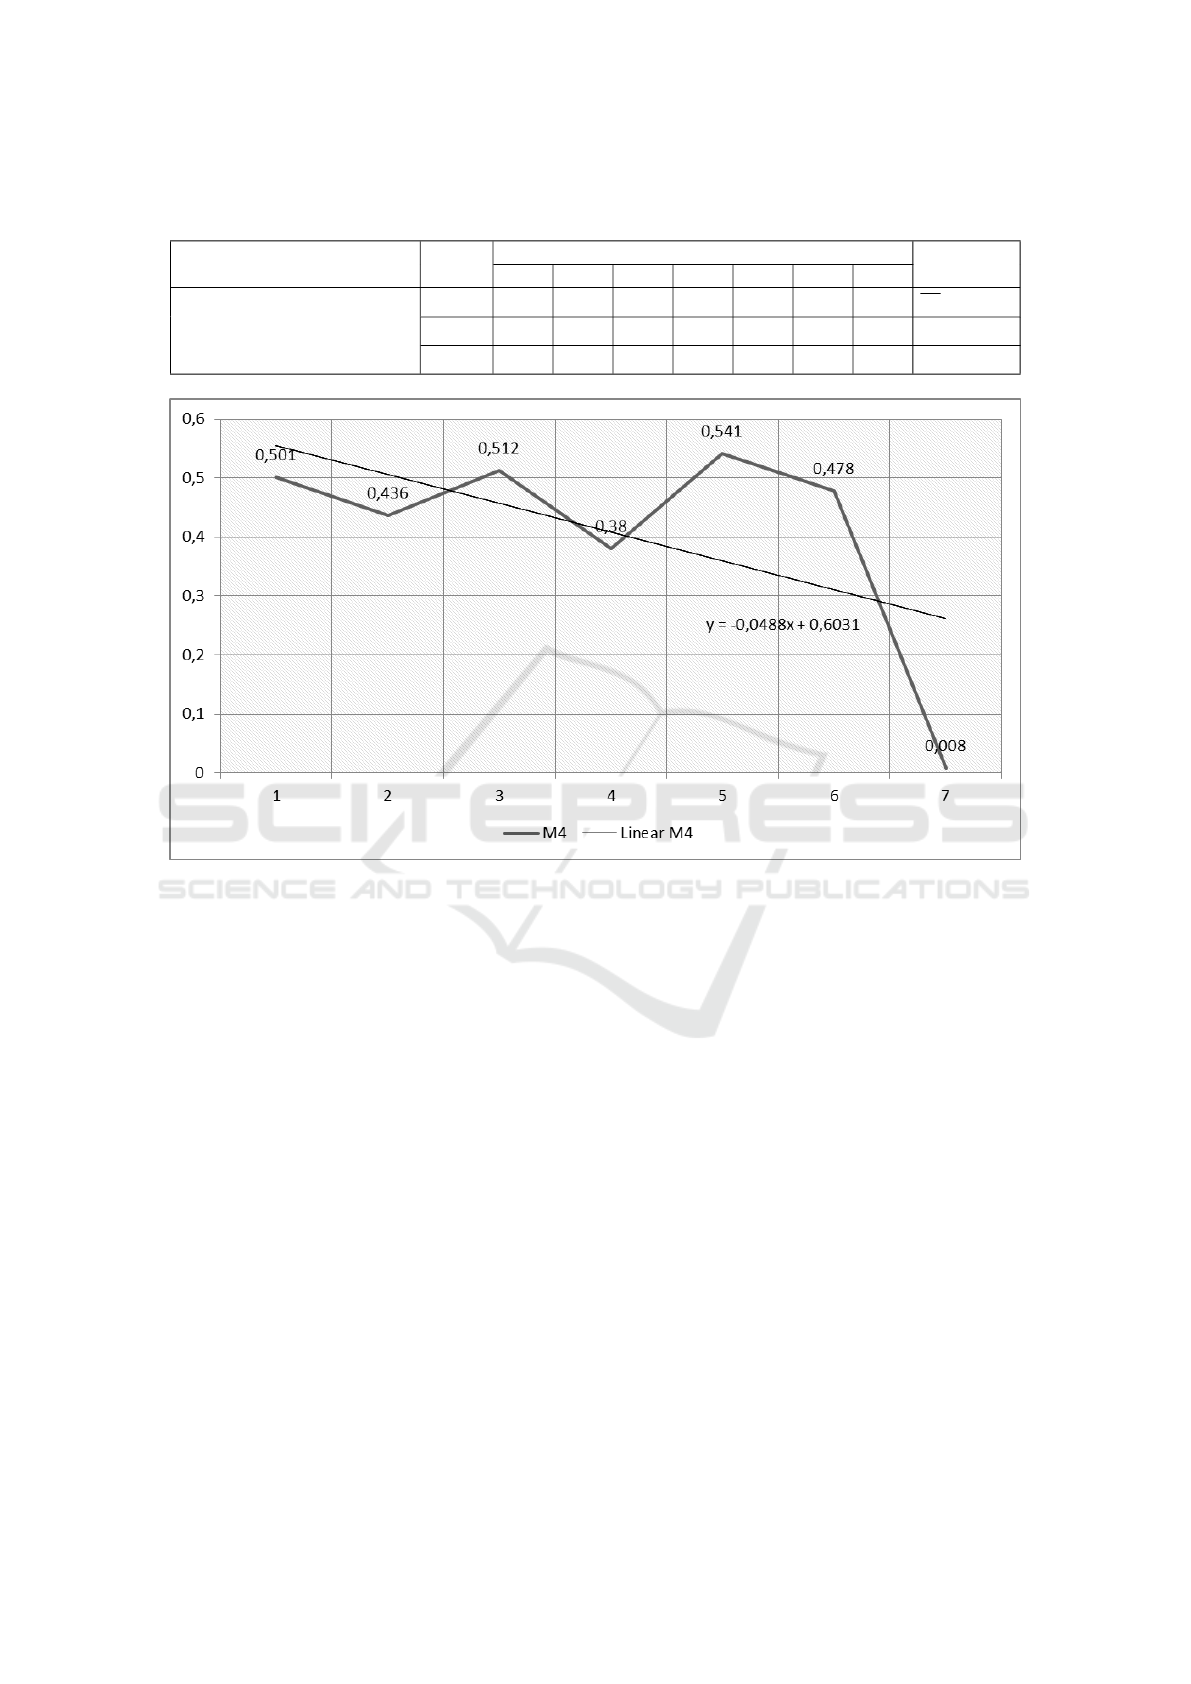
Table 4: Values of taxonomic indicators of the educational component in the system of the country’s economic security within
the period from 2013 to 2019.
Title Indices
Years
Values
2013 2014 2015 2016 2017 2018 2019
Educational component (M4)
C
(4)
i0
0,139 0,157 0,136 0,173 0,128 0,146 0,300 C
0
= 0, 179
d
(4)
i
0,499 0,564 0,488 0,620 0,459 0,522 0,992 S
0
= 0, 055
K
(4)
i
0,501 0,436 0,512 0,380 0,541 0,478 0,008 C
0
= 0, 279
Figure 4: Dynamics of the taxonomic indicator of the country’s innovative development (from a perspective of an educational
component) within the period from 2013 to 2019.
tions of corresponding ministries and agencies in or-
der to ensure the innovative development of the na-
tional economy. According to the results of the
present study the primary functions of the state pol-
icy to ensure growing of the educational component
of the national economy innovative development have
been defined. In particular, at the level of the Ministry
of Education and Science of Ukraine it is expedient to
introduce the Strategy of accelerated formation of the
teachers’ educational potential. This will contribute
to the spread of innovation in the education system of
Ukraine in the context of global digitalization. Based
on the high indicators of education in Japan, Den-
mark and the Netherlands obtained in the process of
the conducted research and taking into account the
directions of their development,it is advisable to in-
troduce the programs of learning English as a first
foreign language into primary school; to develop, in
cooperation with private educational institutions, ed-
ucational programs aimed at introducing up-to-date
teaching methods and programs to provide the oppor-
tunities for adults and the unemployed to take part
in formal and / or informal education. A number of
programs should be initiated to start technical schools
and fee-paying international corporations to train un-
skilled workers in the field of information technology,
petrochemistry and electronics (those who could not
get industrial jobs, the government could increase the
number of labor-intensive retail services such as in
the sphere of tourism and transport). Taking into ac-
count the analysis of the development of human cap-
ital, it is advisable to take the experience of Singa-
pore as a basis,and to recommend to develop a Strat-
egy for Involving Multinational Organizations in La-
bor Training in Ukraine, and to work out a Strategy
for uniting the country’s largest technical universities
with the purpose to develop advanced clusters for the
research of future technologies and ensure the pres-
ence of the association members in public, political
and economic circles to warrant a high level of train-
ing of future personnel.
At the level of the Department of Scientific and
Technical Development and the Ministry of Economy
of Ukraine it is worthwhile to introduce a New Plan
M3E2 2022 - International Conference on Monitoring, Modeling Management of Emergent Economy
34

for the Development of Research Innovative Enter-
prises until 2025, that allows to take into account the
successful USA experience.
At the level of the Ministry of Finance of Ukraine,
alongside the Ministry of Economy of Ukraine, it
is important to assist small and medium enterprises
(SMEs) in accelerating technology implementation
and helping the population expand its digital poten-
tial.
At the level of the Cabinet of Ministers of Ukraine
it is expedient to introduce Programs of funding edu-
cational institutions regardless of the form of owner-
ship, to develop an effective formula of mixed financ-
ing in various proportions, which implies a gradual re-
duction of state funding while increasing the share of
private funding (Singapore experience), to stimulate
government to invest in the education of Ukrainian
students in the best universities in the world, while
creating leading research and educational centers at
home.
At the level of the Ministry of Digital Transfor-
mation of Ukraine, it is recommended to introduce
an online resource with a view to increasing the dig-
ital competence of citizens, following the example of
Digital Competence. The introduction of the ana-
logue of such a program will give impetus to digi-
tal initiatives, the increase in digital competencies of
Ukrainian citizens as well as the use of the Danish
“Digital Literacy Manifesto”, which will stimulate the
development of digital skills and critical thinking.
Implementation of the suggested measures within
the framework of achieving educational and scientific
breakthrough will allow to increase the overall indi-
cator of the educational component in order to ensure
the national economy innovative development.
The limitations of the study are impossibility to
take into account the state of education in Ukraine
during the war. In our opinion, the deterioration of the
state of the educational component of the state’s inno-
vative development is expected and obvious. Among
the positive expected educational trends is the growth
of digital literacy of the population and the develop-
ment of new technologies. Therefore, the study of
the educational component and the development of
mechanisms to ensure its strengthening in the post-
war period will be an important and priority area of
the future research.
ACKNOWLEDGEMENTS
This study was carried out in the framework of co-
operation with the Ministry of Economy of Ukraine
(was named the Ministry of Economic Development,
Trade and Agriculture of Ukraine at the moment of
the project) under the project ”Synergy of knowledge,
experience and creativity for the future”.
REFERENCES
Agrawal, A., Kumar, C., and Mukti, S. K. (2021). Role
of Information and Communication Technology (ICT)
to Enhance the Success of Knowledge Management
(KM): a Study in a Steel Plant. Journal of the Knowl-
edge Economy, 12(4):1760–1786. https://doi.org/10.
1007/s13132-020-00694-6.
Bene
ˇ
sov
´
a, A. and Tupa, J. (2017). Requirements for Ed-
ucation and Qualification of People in Industry 4.0.
Procedia Manufacturing, 11:2195–2202. https://doi.
org/10.1016/j.promfg.2017.07.366.
Bhattacharya, A., editor (2017). Strategic human
capital development and management in emerg-
ing economies. IGI Global. https://doi.org/10.4018/
978-1-5225-1974-4.
Bondarchuk, O., Balakhtar, V., Gorova, O., Lytvynenko, N.,
Pinchuk, N., Shmanko, O., Kiv, A., and Oleksiuk, V.
(2022). Features of responsibility of future specialists
of the socionomic professions as an indicator of their
digital competence. Educational Technology Quar-
terly, 2022(1):35–55. https://doi.org/10.55056/etq.12.
Braunstein, A., Deutscher, V., Seifried, J., Winther, E., and
Rausch, A. (2022). A taxonomy of social embed-
ding – a systematic review of virtual learning simu-
lations in vocational and professional learning. Stud-
ies in Educational Evaluation, 72:101098. https://doi.
org/10.1016/j.stueduc.2021.101098.
Csom
´
os, G. (2020). Introducing recalibrated academic
performance indicators in the evaluation of individu-
als’ research performance: A case study from East-
ern Europe. Journal of Informetrics, 14(4):101073.
https://doi.org/10.1016/j.joi.2020.101073.
Dutta, S., Lanvin, B., and Wunsch-Vincent, S., edi-
tors (2020). Global Innovation Index 2020: Who
Will Finance Innovation? Ithaca, Fontainebleau,
and Geneva, 13 edition. https://www.wipo.int/edocs/
pubdocs/en/wipo
pub gii 2020.pdf.
Engstrand,
˚
A.-K. and Enberg, C. (2020). The power in posi-
tionings: A Foucauldian approach to knowledge inte-
gration processes. Management Learning, 51(3):336–
352. https://doi.org/10.1177/1350507620904307.
Hrynevych, L., Morze, N., Vember, V., and Boiko, M.
(2021). Use of digital tools as a component of stem
education ecosystem. Educational Technology Quar-
terly, 2021(1):118–139. https://doi.org/10.55056/etq.
24.
Ilyash, O., Trofymenko, O., Dzhadan, I., and Tsarova,
T. (2021). Ecological and economic effects of in-
dustrial and technological development. IOP Con-
ference Series: Earth and Environmental Science,
915(1):012004. https://doi.org/10.1088/1755-1315/
915/1/012004.
Ilyash, O. I. and Stefaniak, V. I. (2012). Zastosuvannia tak-
sonomichnoho analizu yak instrumentu derzhavnoho
Multidimensional Analysis of Educational Indicators of the National Economy Innovative Development
35

rehuliuvannia ta otsinky rivnia sotsialnoi bezpeky
Ukrainy [Applying of taxonomic analyses as a tool of
state regulation and estimation of the social safety’s
level of Ukraine]. Ekonomichnyi prostir, (65):80–91.
IMD - International Institute for Management De-
velopment (2022). World Competitiveness
Center Rankings. https://www.imd.org/centers/
world-competitiveness-center/rankings/.
Kahkonen, S. (2018). Why Ukraine’s Educa-
tion System is Not Sustainable. https:
//www.worldbank.org/en/news/opinion/2018/09/12/
why-ukraines-education-system-is-not-sustainable.
Karpenko, M. M. (2015). Osvita protiahom zhyttia
yak chynnyk liudskoho rozvytku. Analitychna za-
pyska [Lifelong learning as a factor of human de-
velopment. Analytical note]. http://old2.niss.gov.ua/
articles/1865/.
Kelley, T. R. and Knowles, J. G. (2016). A conceptual
framework for integrated STEM education. Interna-
tional Journal of STEM education, 3(1):1–11. https:
//doi.org/10.1186/s40594-016-0046-z.
Kobets, V. and Yatsenko, V. (2019). Influence of the
Fourth industrial revolution on divergence and con-
vergence of economic inequality for various coun-
tries. Neiro-Nechitki Tekhnolohii Modelyuvannya
v Ekonomitsi, 2019(8):124–146. https://doi.org/10.
33111/nfmte.2019.124.
Kok, W. (2004). Facing the challenge: the Lis-
bon strategy for growth and employment.
Office for Oficial Publications of the Eu-
ropean Communities, Luxembourg. https:
//www.bmuv.de/fileadmin/bmu-import/files/pdfs/
allgemein/application/pdf/facing the challenge.pdf.
Kucherova, H., Honcharenko, Y., Ocheretin, D., and Bil-
ska, O. (2021). Fuzzy logic model of usability of
websites of higher education institutions in the con-
text of digitalization of educational services. Neiro-
Nechitki Tekhnolohii Modelyuvannya v Ekonomitsi,
2021(10):119–135. https://doi.org/10.33111/nfmte.
2021.119.
Kuybida, V., Petroye, O., Fedulova, L., and Androshchuk,
G. (2019). Digital competences as a condition to the
development of quality of human capital. Zbirnyk
naukovykh prats Natsionalnoi akademii derzhavnoho
upravlinnia pry Prezydentovi Ukrainy, (1):118–133.
http://nbuv.gov.ua/UJRN/znpnadu 2019 1 16.
Le, L. T. B., Tran, T. T., and Tran, N. H. (2021). Challenges
to STEM education in Vietnamese high school con-
texts. Heliyon, page e08649. https://doi.org/10.1016/
j.heliyon.2021.e08649.
Leiber, T. (2018). Impact evaluation of quality manage-
ment in higher education: a contribution to sustain-
able quality development in knowledge societies. Eu-
ropean Journal of Higher Education, 8(3):235–248.
https://doi.org/10.1080/21568235.2018.1474775.
Mane, F. and Miravet, D. (2016). Using the job require-
ments approach and matched employer-employee data
to investigate the content of individuals’ human capi-
tal. Journal for Labour Market Research, 49(2):133–
155. https://doi.org/10.1007/s12651-016-0203-3.
Marchiori, D. M., Rodrigues, R. G., Popadiuk, S., and
Mainardes, E. W. (2022). The relationship between
human capital, information technology capability, in-
novativeness and organizational performance: An in-
tegrated approach. Technological Forecasting and So-
cial Change, 177:121526. https://doi.org/10.1016/j.
techfore.2022.121526.
Nedelko, Z., Jev
ˇ
senak, S., et al. (2019). Strategies and
tools for knowledge management in innovation and
the future industry. In The role of knowledge trans-
fer in open innovation, pages 179–202. IGI Global.
https://doi.org/10.4018/978-1-5225-5849-1.ch009.
Research, Innovation and Enterprise Secretariat
(2016). Research Innovation and Enter-
prise 2020 Plan: Winning the Future through
Science and Technology. https://www.mti.
gov.sg/-/media/MTI/Resources/Publications/
Research-Innovation-and-Enterprise-RIE-2020/
RIE2020.pdf.
Riley, K. A. and Nuttall, D. L., editors (1994). Mea-
suring Quality: Education Indicators: United King-
dom and International Perspectives . Routledge.
https://eric.ed.gov/?id=ED374559.
Russo, V. (2020). Digital Economy and Society Index
(DESI). European guidelines and empirical applica-
tions on the territory. In Qualitative and Quantita-
tive Models in Socio-Economic Systems and Social
Work, pages 427–442. Springer. https://doi.org/10.
1007/978-3-030-18593-0 31.
Santacreu, A. M. and Zhu, H. (2018). Has China
Overtaken the U.S. in Terms of Innovation?
https://www.stlouisfed.org/on-the-economy/2018/
march/china-overtaken-us-terms-innovation.
Schleicher, A. (2019). PISA 2018: Insights and Inter-
pretations. OECD Publishing. https://www.oecd.
org/pisa/PISA%202018%20Insights%20and%20Inter
pretations%20FINAL%20PDF.pdf.
Schwab, K., editor (2018). The Global Competitiveness Re-
port 2018. World Economic Forum, Cologny/Geneva.
https://www3.weforum.org/docs/GCR2018/05Full
Report/TheGlobalCompetitivenessReport2018.pdf.
State Statistics Service of Ukraine (2021). Statistics. http:
//www.ukrstat.gov.ua/.
Thakur, P. and Arora, R. (2022). Exploring the Rela-
tionship Between Satisfaction and Intention to Stay
Among Millennial Employees: The Moderating Role
of Managerial Support. International Journal of Hu-
man Capital and Information Technology Profession-
als (IJHCITP), 13(1):1–17. https://doi.org/10.4018/
ijhcitp.293229.
Trofymenko, O., Shevchuk, O., Koba, N., Tashcheiev,
Y., and Pavlenco, T. (2021). Knowledge and
innovation management for transforming the field
of renewable energy. In International Conference
on Artificial Intelligence and Sustainable Comput-
ing, pages 73–87. Springer. https://doi.org/10.1007/
978-3-030-82322-1 6.
UNDP (2019). Human Development Report 2019. Beyond
income, beyond averages, beyond today: Inequalities
in human development in the 21st century. https://doi.
org/10.18356/838f78fd-en.
M3E2 2022 - International Conference on Monitoring, Modeling Management of Emergent Economy
36

Valero, A. and Van Reenen, J. (2019). The economic im-
pact of universities: Evidence from across the globe.
Economics of Education Review, 68:53–67. https:
//doi.org/10.1016/j.econedurev.2018.09.001.
Williams, R. and Leahy, A. (2020). U21 Ranking of Na-
tional Higher Education Systems 2020. https://doi.
org/10.6017/ihe.2016.84.9107.
World Bank (2019). World Development Report 2019 : The
Changing Nature of Work. World Bank, Washington,
DC. https://doi.org/10.1596/978-1-4648-1328-3.
WorldBank (2021). The Human Capital Index 2020 Up-
date: Human Capital in the Time of COVID-19. https:
//doi.org/10.1596/978-1-4648-1552-2.
Zhylinska, O., Melnychuk, O., Antoniuk, L., Humenna,
O., Radchuk, A., Stoliarchuk, Y., Taruta, S., Khar-
lamova, H., Chala, N., and Shnyrkov, O. (2017).
Ukraina — 2030: Doktryna zbalansovanoho rozvytku
[Ukraine – 2030: The doctrine of balanced develop-
ment]. Kalvariia, Lviv, 2 edition. http://ukraine2030.
org/img/ book/E-Book-Doctrine-2030.pdf.
Multidimensional Analysis of Educational Indicators of the National Economy Innovative Development
37
