
Empirical Evidence of Intangible Assets Improve the Financial
Performance of Slovak ICT Companies
Serhii F. Lehenchuk
1 a
, Tetiana A. Vakaliuk
1,2,3 b
, Tetiana P. Nazarenko
1 c
,
Zuzana Kuba
ˇ
s
ˇ
c
´
ıkov
´
a
4 d
and Zuzana Juh
´
aszov
´
a
4 e
1
Zhytomyr Polytechnic State University, 103 Chudnivsyka Str., Zhytomyr, 10005, Ukraine
2
Institute for Digitalisation of Education of the National Academy of Educational Sciences of Ukraine,
9 M. Berlynskoho Str., Kyiv, 04060, Ukraine
3
Kryvyi Rih State Pedagogical University, 54 Gagarin Ave., Kryvyi Rih, 50086, Ukraine
4
University of Economics in Bratislava, Dolnozemsk
´
a cesta 1, 852 35 Petr
ˇ
zalka, Slovakia
Keywords:
Intangible Assets, Intellectual Capital, Financial Performance, ICT Companies.
Abstract:
In the conditions of the knowledge economy, the financial performance of high-tech enterprises largely de-
pends on the efficiency of the processes of creating and using intangible assets. To increase it, it is necessary
to build an effective intangible investment policy, which should be based on an understanding of the role of cer-
tain types of intangible assets in increasing financial performance. The hypothesis of the study is the existence
of a significant positive impact of intangible assets on the financial performance of ICT companies. A sample
of 180 Slovak ICT companies for the period 2015–2019 has been investigated. The primary research method
was the regression analysis of panel data, which was carried out using the GRETL software package. Four re-
gression models were formed based on using such dependent variables as Return on Assets, Net Profit Margin,
Assets Turnover, and Return on Equity. Each of the selected models included eight independent variables –
Research and Development Intensity, Research and Development Intensity Squared, Software, Intellectual
Property Rights, Acquired Intangible Assets, Leverage, Size, and Dummy variable for ICT sub-sectors. For
each of the models, an estimate panel data parameter was chosen based on the F-statistics test, Breusch-Pagan
test, and Hausman test (Model 1-3 – Pooled OLS model, Model 4 – Fixed Effects Method). Adequacy of
each of the models to the generated data was checked on the basis of the Normality test, Autocorrelation test
(Wooldridge test for autocorrelation), and Heteroscedasticity test (White test, Wald test). The hypothesis of
the study was partially confirmed, since only RDI, RDI2 and AIA have a significant positive impact on the
financial performance of Slovak ICT companies. The strength and direction of influence of independent vari-
ables vary depending on the indicator characterizing financial performance. Only the independent variable
AIA has a permanent inverse effect on all indicators of financial performance of Slovak ICT companies. It
was established that the level of influence of control variables on indicators of financial performance is partial
and multidirectional, and applies only to certain types of them.
1 INTRODUCTION
Over the last three decades, a significant number of
scientists have been actively discussing the change in
the role of different types of capital in the process of
creating economic value of enterprises and ensuring
a
https://orcid.org/0000-0002-3975-1210
b
https://orcid.org/0000-0001-6825-4697
c
https://orcid.org/0000-0001-7702-8122
d
https://orcid.org/0000-0001-6739-1278
e
https://orcid.org/0000-0001-8592-0137
their sustainable and long -term success. In particular,
it is reminded on the determining role of intellectual
capital in this process by shift in the “production mix”
and management’s focus, moving from the industrial
focus (of capital and labour) to intellectual capital and
trade in ideas, based on intellectual property rights,
especially patents for its connection to technology
(Daum, 2002; Abeysekera, 2008; Moberly, 2014; Ull-
berg et al., 2021). Under these conditions, the value
of enterprises and their profitability become more de-
pendent on their ability to effectively realize their ex-
isting innovative potential and to use their capitalized
38
Lehenchuk, S., Vakaliuk, T., Nazarenko, T., KubaÅ ˛aÄ Ã kovà ˛a, Z. and Juhà ˛aszovà ˛a, Z.
Empirical Evidence of Intangible Assets Improve the Financial Performance of Slovak ICT Companies.
DOI: 10.5220/0011931000003432
In Proceedings of 10th International Conference on Monitoring, Modeling Management of Emergent Economy (M3E2 2022), pages 38-52
ISBN: 978-989-758-640-8; ISSN: 2975-9234
Copyright
c
2023 by SCITEPRESS – Science and Technology Publications, Lda. Under CC license (CC BY-NC-ND 4.0)

intangible assets. This issue is even more relevant
in the period of overcoming the consequences of the
COVID-19 pandemic and in the context of the intro-
duction of a proactive sanctions policy of world lead-
ers, which results in a reduction in trade in traditional
goods and services, given the growth of the market
of unique intellectual technologies, which ensure the
formation of a stable value for enterprises.
In such new conditions, the economy of devel-
oped countries becomes increasingly dependent on
the development of national intellectual capital. And
for a large number of enterprises their financial per-
formance depends on the effectiveness of implemen-
tation of the policy on creation of new and use of
available intangible assets, ensuring their incorpora-
tion into the activity of the enterprise, the establish-
ment of their effective partnership, stewardship and
control. At the same time, the activity of enterprises
under such conditions is characterized by frequent oc-
currence of network effects, high probability of occur-
rence of market and technological risks, which pro-
vides the necessity of rethinking their business strate-
gies, which will include realization of strategic initia-
tives on intangible values. This is especially relevant
for high-tech enterprises, whose activity is character-
ized by high level of usage of intangible assets and
is aimed at creation of innovative technological prod-
ucts and services.
The presence of such economic changes in the
global business environment makes it necessary to
search for new theories and policies that would enable
the scientific substantiation of decisions and behav-
ior of management of companies with a high share of
intangible assets used in the process of development
and design of technological products and services to
ensure their strong financial performance.
To determine impact of impossible assets on com-
panies performance, the activity of Slovak compa-
nies from information and communications technol-
ogy (ICT) sector was analyzed. Such enterprises,
which relate to processes of processing, storage and
transfer of information, production of computers and
telecommuting devices, and also provision of related
services, belong to high-tech enterprises, the process
of creating value in which depends to a large extent on
effective use of intangible assets. Investing in high-
tech intangible assets of ICT sector enterprises should
lead to the improvement of their financial indicators.
However, as the studies Hu
ˇ
nady et al. (Hu
ˇ
nady et al.,
2019), Slovakia still has only very small proportion
of business R&D in ICT sector. This is evidence of
the cautious policy of Slovak ICT companies to im-
plement intangible investments as a result of the exis-
tence of significant risks and uncertainty as to the re-
turn of such investments. Therefore, in order to min-
imize such risks and eliminate uncertainty, in order
to build an effective intangible investment policy at
ICT enterprises need to identify features of relations
between different types of intangible assets and dif-
ferent financial performance indicators.
In the Slovak Republic over the past ten years,
there has been active development of the ICT sector.
In particular, the number of employees involved in the
information and communication technology services
sector in Slovakia increased from 28905 in 2009 to
53676 in the 2019 year (SARIO, 2021). This shows
an increase in staff almost doubled in 10 years. ICT
industry currently occupies an important place in the
structure of the Slovak economy, representing 4,2%
of GDP, and at the same time has a noticeable influ-
ence on other related industries. This industry is very
attractive for investors due to the presence of signif-
icant potential for growth due to a number of advan-
tages in comparison with other branches of economy
in Slovakia: High level of adaptation of ICT to the
activity of enterprises; high value added and wages
(1,2 – 4,0 ths. eur.); well-developed ICT related edu-
cational system; well-developed ICT institutional net-
work; diversification of telecommunication segment;
strategic geographical location from the perspective
of time zonation; high quality data and network cover-
age; attractive investment incentives for the ICT sec-
tor (SARIO, 2021). In addition, ICT sector is ac-
tively supported by Slovak government, as a result,
investors are offered attractive investment incentives
for the ICT sector (tax reliefs; cash grants; contribu-
tions for the newly created jobs; rent/sale of real estate
for a discounted price) and special R&D tax regime
(200% of the R&D expenses can be deducted from
the tax base) (SARIO, 2021). Thus, impact research
of intangible assets impact on financial performance
of Slovak ICT companies in modern conditions, there
is a particularly urgent need to define the directions of
development and ways of adjustment of their intangi-
ble investment policy.
Based on the important role of intangible assets
in ensuring the efficiency of high-tech companies re-
search hypothesis was formulated. The hypothesis of
the study is the existence of a significant positive im-
pact of intangible assets on the financial performance
of ICT companies. Because the force of such influ-
ence may also depend from company size, level of
borrowed capital and belonging to sub-sector of ICT
industry, these factors should also be taken into ac-
count in the analysis impact of intangible assets on the
financial performance, and the results obtained should
be used in formulating recommendations to manage-
ment of Slovak ICT companies for investments in in-
Empirical Evidence of Intangible Assets Improve the Financial Performance of Slovak ICT Companies
39

tangible assets.
2 THEORETICAL BACKGROUND
Problems of influence of intangible assets in their
broad (economic) understanding on financial perfor-
mance of high-tech companies are paid considerable
attention of academicians. First of all, this is condi-
tioned by the decisive role of intellectual capital for
such enterprises in the context of the development of
knowledge economy, which is based on ideas, R&D,
innovations and technological progress. Scientists an-
alyze of the impact of different intangible values on fi-
nancial performance: intangible assets (the concept of
IAS 38 (Deloitte Touche Tohmatsu Limited, 2022)),
intellectual capital (as a combination of human, orga-
nizational, and client capital), or separate components
of two data. These studies cover different types of en-
terprises from different countries of the world, which
represent different sectors of the economy. Since in-
tellectual capital includes, to the most extent, all in-
tangible assets that are the result of human intellectual
activity, this article also analyzes the impact of intel-
lectual capital and its components on the financial per-
formance of ICT companies. In addition, a number
of researchers are conducting studies of the impact
of intangible assets both on individual components of
financial performance, in particular, on profitability,
and on broader categories, in particular, on total per-
formance of the company or companies value.
Table 1 lists the number of articles and their quota-
tions, which reveal the relationship between “Intangi-
ble assets” / “Intellectual capital” and “Financial per-
formance” in science-based databases of Scopus, Web
of Science and Google Scholar.
The results of analysis of scientific databases are
obtained (table 1) testify to the existence of a consid-
erable number of publications in this direction of re-
searches, as well as their influence on scientific works
of other authors, which is confirmed by a considerable
number of references to data of other authors and their
constant growth from year to year. The cluster analy-
sis of the key words of the articles from the databases
of the Scopus and Web of Science on the basis of the
use of VOSviewer allowed to confirm this conclusion.
There was also a large number of publications that
examined the impact of structural elements of intan-
gible assets or intellectual capital (research and devel-
opment, intangible resources, customer capital, struc-
tural capital, human capital, social capital, relational
capital) on financial performance (figure 1). In addi-
tion, publications have been identified that investigate
the impact of intangible assets or intellectual capital
on other types of indicators that characterize the per-
formance of the enterprise – firm performance, busi-
ness performance, corporate performance, firm value,
effectiveness, efficiency, profitability, ROA, competi-
tive advantage etc. (figure 2).
Little attention is paid directly to the issue of im-
pact of intangible values on financial performance of
ICT companies, although the presence of significant
positive relationships between with two variables is
confirmed in the vast majority of results. Gan and
Saleh (Gan and Saleh, 2008) the connection between
intellectual capital components was studied corporate
performance of high-techn companies listed on Bursa
Malaysia, in particular, profitability, and productivity.
Based on the use of regression analysis, it was found
that companies with larger intellectual capital as a rule
have better profitability (ROA) and more efficient pro-
ductivity (ATO).
Li and Wang (Li and Wang, 2014) investigated the
impact of different intangible assets (R&D expendi-
ture, employee benefit, sales training) on profitability
indicators (ROA) of Hong Kong Listed IT companies
using regression analysis. They found a positive rela-
tionship between intangible assets and ROA.
D
ˇ
zenopoljac et al. (D
ˇ
zenopoljac et al., 2016) ex-
amined the role of intellectual capital and its key com-
ponents in provision for financial performance (ROA,
ROE, ROIC, ATO) of Serbian ICT sector companies
during 2009–2013. They used Value-added intellec-
tual coefficient (VAIC) as a measure of the IC contri-
bution to value creation. The results obtained by the
authors revealed that only one component of VAIC –
CEE (capital-employed efficiency) had a significant
impact on financial performance indicators, except
for the indicator ROIC. Khan (Khan, 2018) also used
VAIC as firms intangibility measure when analyzed
the impact of intellectual capital on the financial per-
formance of the 51 Indian IT companies for the period
2006–2016. He found a significant positive associa-
tion of VAIC with profitability, and an insignificant
relationship with productivity, and significant positive
association of CEE with profitability and productivity
of Indian IT companies.
Zhang (Zhang, 2017) analysed the relationship be-
tween degree of intangible assets and profitability for
17 Chinese listed telecommunication firms’ for the
period from 2014 to 2016. He found a positive and
significant effect of Intangible assets ratio on ROA.
Also, he emphasized the possibility of the inaccuracy
of the obtained results due to the conservative nature
of Chinese accounting standards rules in measuring
intangible assets.
Hu
ˇ
nady et al. (Hu
ˇ
nady et al., 2019) examined the
role of innovations in performance of ICT sector com-
M3E2 2022 - International Conference on Monitoring, Modeling Management of Emergent Economy
40
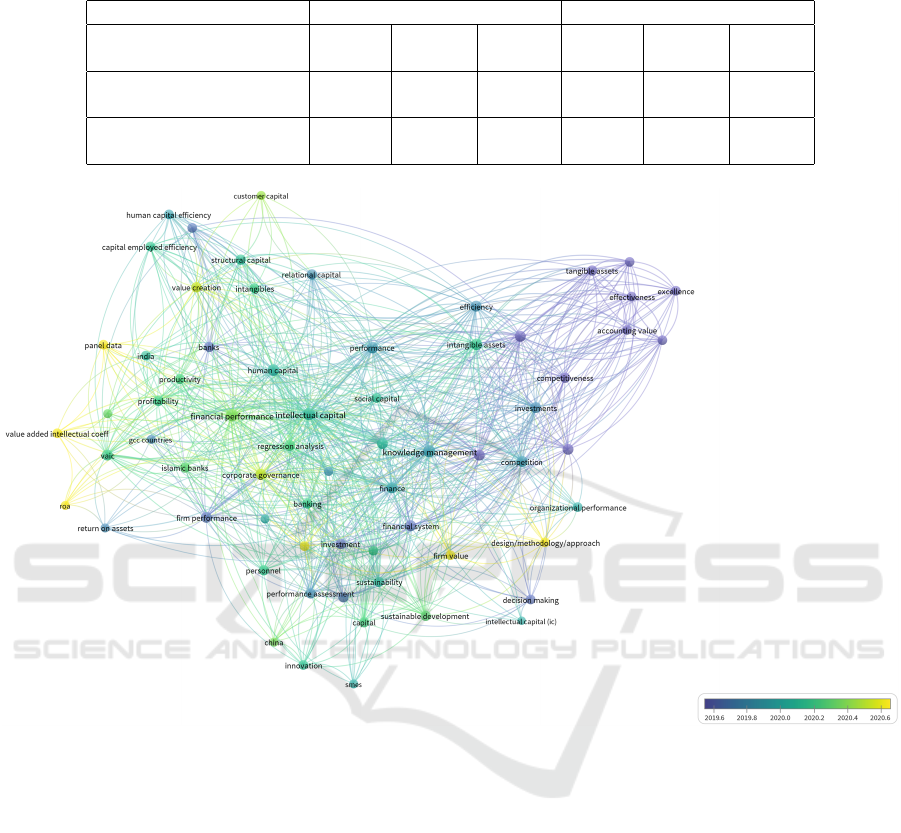
Table 1: Number of scientific articles by direction of researches and their quotations in academic literature for the period
2018–2022 as of July 01, 2022 (via Scopus, Web of Science and Google Scholar databases).
Results found Sum of the times cited
Searching phrases Scopus Web of Google Scopus Web of Google
Science Scholar Science Scholar
“Intangible assets” and 161 576 21 894 16100 38
“Financial performance”
“Intellectual capital” and 329 970 494 2530 13904 2235
“Financial performance”
Figure 1: Bibliometric map of publications’ keywords on the query “Intangible assets”, “Intellectual capital” and “Financial
performance” according to Scopus database in 2018–2022.
panies from 24 countries during the years 2008–2016.
Using regression analysis for macro-level data, they
found positive effect of R&D expenditure on apparent
labour productivity and value added in ICT sector.
Qureshi and Siddiqui (Qureshi and Siddiqui,
2020) analyzed an effect of intangible assets on finan-
cial performance (ROA, ROE, ROIC, ATO and NPM)
of the 80 global technology firms for the period from
2015 to 2018. They confirmed a significant nega-
tive effect of intangible assets on ROE, ROIC, ATO,
and insignificant positive impact on companies’ prof-
itability. Moreover, the force of this influence consid-
erably varies depending on the country’s innovative
development.
Lopes and Ferreira (Lopes and Ferreira, 2021)
also investigated the impact of intangibles on the
performance indicators of major world technologi-
cal firms (Turnover, ROA, ROE, ROS, EPS), have
received evidence of existence of negative correla-
tion between all intangible variables, control variables
(Size, Leverage) with ROA. These conclusions are
also confirmed in labor Sundaresan et al. (Sundare-
san et al., 2021), which investigated the impact of
intangible assets on financial performance of 38 Tai-
wanese listed technology firms for the period 2015–
2019. The authors also revealed the existence of a
lack of a significant relationship between intangible
assets and ROA, but found significant influence of
size on ROA. At the same time, they confirmed signif-
icant impact of intangibles on ROE. Received Lopes
and Ferreira (Lopes and Ferreira, 2021), Sundaresan
et al. (Sundaresan et al., 2021) the results of the ROA
are in direct contradiction with most of the conclu-
sions obtained by the authors who studied impact of
Empirical Evidence of Intangible Assets Improve the Financial Performance of Slovak ICT Companies
41
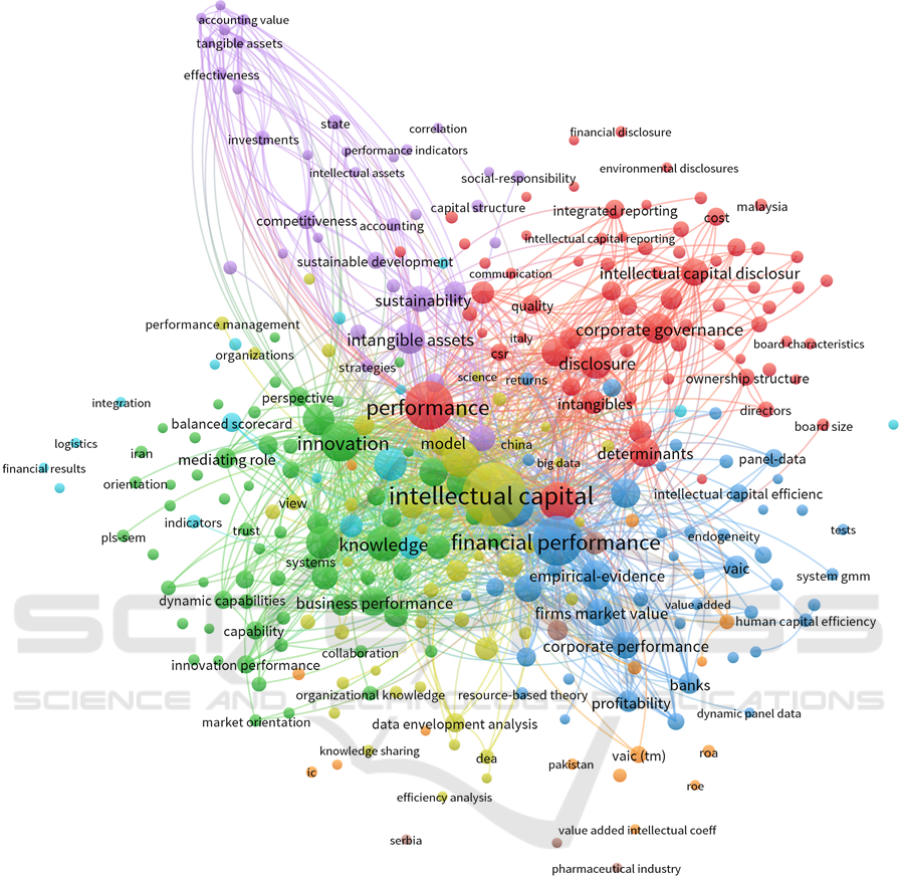
Figure 2: Bibliometric map of publications’ keywords on the query “Intellectual capital” and “Financial performance” ac-
cording to Web of Science database in 2018–2022.
intangibles on performance of ICT companies.
Radoni
´
c et al. (Radoni
´
c et al., 2021) studied the
role of intellectual capital components (human, rela-
tional, structural and innovation capital) in ensuring
the achievement of financial performance indicators
(ROA, ROE, Net Profit, etc.) of South-East Europe
IT industry companies. In their study, as a theoretical
background they used a resource-based view on intel-
lectual capital, which involves analyzing the impact
of its individual components on financial performance
indicators. In particular, the authors established that
innovation capital has the strongest impact and hu-
man capital has an indirect impact on the financial
performance of IT companies. A similar resource-
based approach was also used by Serpeninova et al.
(Serpeninova et al., 2022), who as a result of a study
of the impact of intellectual capital on the profitabil-
ity of Slovak software development companies (ROA,
NPM, GPM, EBITM) found an absence of a signifi-
cant relationship between them. The authors consid-
ered the main reason for this to be the imperfection
of the current accounting standards, for instance, IAS
38, in terms of criteria for recognizing and evaluating
the intellectual capital of enterprises.
The analysis of studies on the issues of the re-
search made it possible to establish the existence of
M3E2 2022 - International Conference on Monitoring, Modeling Management of Emergent Economy
42

mutually contradictory evidence regarding the impact
of intangible assets on the financial performance. In
general, this does not allow the management of enter-
prises to effectively control intangible values aimed
at creating internal value, and for investors – to re-
ceive clear signals for making effective investments.
Considering the above, the following objectives were
formulated: to measure the relationship between in-
tangible assets and the financial performance of Slo-
vak ICT companies; to investigate which components
of intangible assets have the most significant or in-
significant impact on the financial performance of
Slovak ICT companies; to form recommendations for
improving the investment policy of ICT companies,
based on the level of significance of the elements of
intangible assets from the point of view of increasing
financial results.
3 DATA AND METHODOLOGY
Sample selection. To determine whether intangible
assets stimulate financial performance, was analyzed
sample of 180 Slovak ICT companies for the period
2015–2019. In particular, the panel data information
from financial statements of such enterprises, avail-
able in the open access, as well as the information
from database “FinStat” was used to form panel data.
Only those companies, for which the necessary infor-
mation for the 5-year period was available, were in-
cluded in the sample. The selected 180 companies
provide a valid and complete set of data in order to
carry out relevant statistical analysis.
Investigated enterprises proceeding from EU Eco-
nomic Activity Classification and from the SK NACE
2 classification belongs to group 26 “Manufacture
of computer, electronic and optical products”, in-
cludes direct production of computers, computer pe-
ripheral equipment (input device, output device, in-
put/output device), communication equipment (public
switching equipment, transmission equipment, cus-
tomer premises equipment), measuring, medical, nav-
igation, radio, optical and other electronic equipment,
as well as production of various types of accessories
for such products (electrical boards, magnetic and op-
tical media, etc.). In order to take into account the
influence sub-sectors affiliation on financial perfor-
mance of ICT companies two groups were allocated
in their composition. The first group included enter-
prises dealing with the production of different types of
electronics and components, and the second group in-
volved enterprises producing communication equip-
ment and components.
Based on the form of ownership, most of the com-
panies investigated – 160, companies with limited li-
ability, 16 – is a joint-stock company, 2 – production
cooperative, 1 – limited partnership, 1 – general part-
nership. By type of ownership, the companies investi-
gated are divided as follows: private domestic – 64%;
foreign – 21%; international with a predominant pri-
vate sector – 13%; cooperative – 1%; state – 1%.
Variables. In the research for characteristics of
financial performance of ICT companies were used
four dependent variables – Return on Assets, Net
Profit Margin, Return on Equity, Assets Turnover,
and used in their work by researchers for simiral em-
pirical analysis of the relationship between intangi-
bles values and company financial performance (Gan
and Saleh, 2008; D
ˇ
zenopoljac et al., 2016; Qureshi
and Siddiqui, 2020; Sundaresan et al., 2021; Radoni
´
c
et al., 2021; Serpeninova et al., 2022). For explana-
tion of a relation between intangible assets and finan-
cial performance of ICT companies used intangible
assets variables – Research and Development Inten-
sity, Research and Development Intensity Squared,
Software, Intellectual Property Rights, Acquired In-
tangible Assets. The election of such independent
variable is justified by the financial statements of Slo-
vak ICT companies in the disclosure of information
about intangible assets. As it was revealed Hu
ˇ
nady
et al. (Hu
ˇ
nady et al., 2019), the firm’s ICT sector
account for significant share of total business R&D
expenditure in economy in most countries. There-
fore, in the analysis impact of intangible assets on fi-
nancial performance of ICT sector an important role
should be assigned to R&D indicators. As a result,
the study does not use the indicator of R&D costs
but uses two calculation ratios that characterize the
R&D of the companies. In addition, based on pre-
vious studies (Ievdokymov et al., 2020; Zavalii et al.,
2022; Serpeninova et al., 2022) in our study used three
control variables – Leverage, Size and Dummy vari-
able for ICT sub-sectors. Use of these variables will
allow to control for a significant effects of company
size, level of borrowing capital, and unseen role of
ICT sub-sectors affiliation.
Types, calculation procedures, and abbreviations
used in the Variables study are shown in table 2.
The dynamics of four indicators, that character-
ize financial performance of Slovak ICT companies
(ROA, NPM, ROE, ATO) for the period 2015–2019
showed in figure 3.
Figure 1 displays the change in time of financial
performance indicators for the 2015–2019 period. It
allows to identify a number of common trends: Si-
multaneous growth in all indicators for 2017–2018
years; decrease in ATO, ROA and NPM indicators for
2015–2016 years, their growth in 2016–2018 years,
Empirical Evidence of Intangible Assets Improve the Financial Performance of Slovak ICT Companies
43
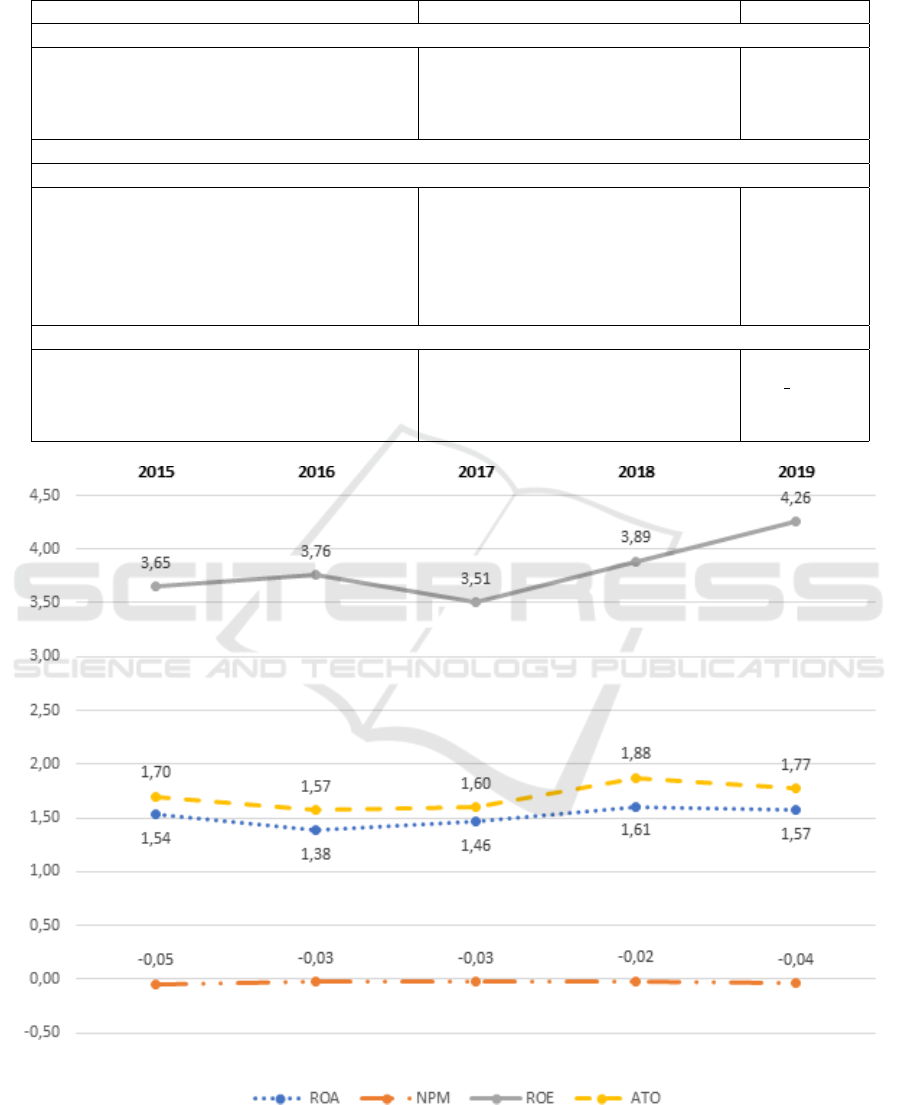
Table 2: Variable definitions and abbreviations.
Variable Calculation (Source) Abbreviation
Dependent Variables
Return on Assets Net turnover / Total Assets ROA
Net Profit Margin Net profit / Total Sales NPM
Assets Turnover Total Sales / Total Assets ATO
Return on Equity Net profit / Total Equity ROE
Independent Variables
Intangible Assets Variables
Research and Development Intensity Capitalized R&D Costs / Total Sales RDI
Research and Development Intensity Squared Squared function of RDI RDI2
Software Software (Intangible Asset) SOFT
Intellectual Property Rights Valuable Intellectual Property Rights IPR
Acquired Intangible Assets Acquired long-term intangible assets AIA
are charged until the time of their use
Control Variables
Leverage Total liabilities / Total Assets LEV
Size Logarithm of Total Assets l SIZE
Dummy variable for ICT sub-sectors 1 for electronic producers, DVICTSS
0 for communication producers
Figure 3: Dynamics of financial performance indicators of Slovak ICT companies for the 2015-2019 period.
as well as their simultaneous decrease in 2018–2019;
during 2018–2019 years only growth of ROE indica-
tor occurs. In general, common behavior was found
for ATO, ROA and NPM, as well as almost com-
pletely different behavior of ROE compared to these
indicators.
M3E2 2022 - International Conference on Monitoring, Modeling Management of Emergent Economy
44

4 RESEARCH MODELS
To understand the relationship between intangible as-
sets and financial performance indicators, this study
examined four following models:
Model 1: ROA
it
= α + β
1
· RDI
it
+ β
2
· RDI2
it
+
β
3
· SOFT
it
+ β
4
· IPR
it
+ β
5
· AIA
it
+ β
6
· LEV
it
+ β
7
·
l SIZE
it
+ β
8
· DVICTSS
it
+ ε
it
Model 2: NPM
it
= α + β
1
· RDI
it
+ β
2
· RDI2
it
+
β
3
· SOFT
it
+ β
4
· IPR
it
+ β
5
· AIA
it
+ β
6
· LEV
it
+ β
7
·
l SIZE
it
+ β
8
· DVICTSS
it
+ ε
it
Model 3: ATO
it
= α + β
1
· RDI
it
+ β
2
· RDI2
it
+
β
3
· SOFT
it
+ β
4
· IPR
it
+ β
5
· AIA
it
+ β
6
· LEV
it
+ β
7
·
l SIZE
it
+ β
8
· DVICTSS
it
+ ε
it
Model 4: ROE
it
= α + β
1
· RDI
it
+ β
2
· RDI2
it
+
β
3
· SOFT
it
+ β
4
· IPR
it
+ β
5
· AIA
it
+ β
6
· LEV
it
+ β
7
·
l SIZE
it
+ β
8
· DVICTSS
it
+ ε
it
where: ROA, NPM, ATO, ROE – dependent vari-
ables, where i is entity and t is time;
α – Identifier;
µ – Variance introduced by the unit-specific effect
for unit i;
β – Regression coefficient;
RDI, RDI2, SOFT, IPR, AIA – independent intan-
gible variables, LEV, l SIZE, DVICTSS – indepen-
dent control variables;
ε
it
– error term.
Figure 4 shows the conceptual framework of the
study.
5 RESULTS
5.1 Descriptive Statistics and
Correlations
The descriptive statistics (observation, mean, median,
standard deviation, minimum, maximum) of a full
sample are presented in table 3.
From table 3 it can be observed that the full sam-
ple is measured with 180 units. The largest devia-
tions in variables are related to SOFT (5,95·10
4
), IPR
(2,89·10
4
), AIA (1,61·10
5
) and ROE (4,30). Large
differences between the minimum and the maximum
values of ROA, ATO, and ROE show that the finan-
cial performance levels of ICT companies are quite
distinct. For some variables (ATO, LEV, IPR, AIA,
l SIZE) the mean value is greater than the standard
deviation value, as a result, the data in these variables
have a small distribution. ROA, NPM, and ROE have
a higher standard deviation than their mean. This in-
dicates a relatively large set of ratios that will char-
acterize the normal distribution curve and will not be
outliers. The closeness of the mean (13,5) and me-
dian (13,3) values for l SIZE indicates a high level of
symmetry in the distribution of range values, that is,
the size of the studied enterprises. The mean value of
the LEV ratio is 0,438, and this means that approxi-
mately 44% of the total assets of ICT companies are
financed through borrowed resources.
In general, correlation matrix of variables used
in Models 1-4 (figure 5), testifies to absence multi-
collinearity problem, since in most cases, the corre-
lation coefficient is less than 0,5 (–0,5). The only
exception is the high correlation coefficient between
variables RDI and RDI2 (0,9), which is understand-
able given that RDI2 is a squared function of RDI.
However, as
¨
Ozkan (
¨
Ozkan, 2022) notes, the prac-
tice of applying such mutually-correcting indicators is
normal in the regression analysis performed to check
the effect of interrelated variables on financial perfor-
mance indicators. In particular, simultaneous use in
regression models of variables RDI and RDI2 allows
to detect presence U-inverted relation between R&D
and financial performance of a company.
5.2 Selection of Estimate Panel Data
Parameter
The choice of estimate panel data parameter for each
of the selected models plays an important role in
the regression analysis of panel data. This param-
eter should be adequately correlated with the data
used in the corresponding model. Proceeding from
F-statistics test for Model 1 F(179; 712) = 1,17767
with p-value 0,0766456, which is more than 0,05 and
confirms null hypothesis in relation to pooled OLS
model. The need for such a choice estimate pa-
rameter for Model 1 also confirmed the application
Breusch-Pagan test, according to which chi-square (1)
> 2,04561 p-value = 0,152645, which is larger than
0.05 and confirms zero hypotheses. The use of F-
statistics test and Breusch-Pagan test also confirmed
the need for use pooled OLS model as a quality esti-
mate parameter for Model 2. For Model 3 after ap-
plication F-statistics test it was received F(179; 712)
= 1,23387 with p-value 0,0331413, that is less than
0,05 and testifies to the adequacy of application Fixed
effects method (FEM). However, this conclusion is
refuted as a result Breusch-Pagan test, according to
chi-square (1) > 3,58479 p-value = 0,0583107, which
is larger than 0,05 and confirms zero hypothesis of
adequacy pooled OLS model. Considering the re-
sults Hausman test (p-value = prob(chi-square (8) >
4,34179) = 0,825045), according to which more ap-
propriate is the application of Random effects method
(REM) than FEM, for Model 3 more appropriate also
Empirical Evidence of Intangible Assets Improve the Financial Performance of Slovak ICT Companies
45
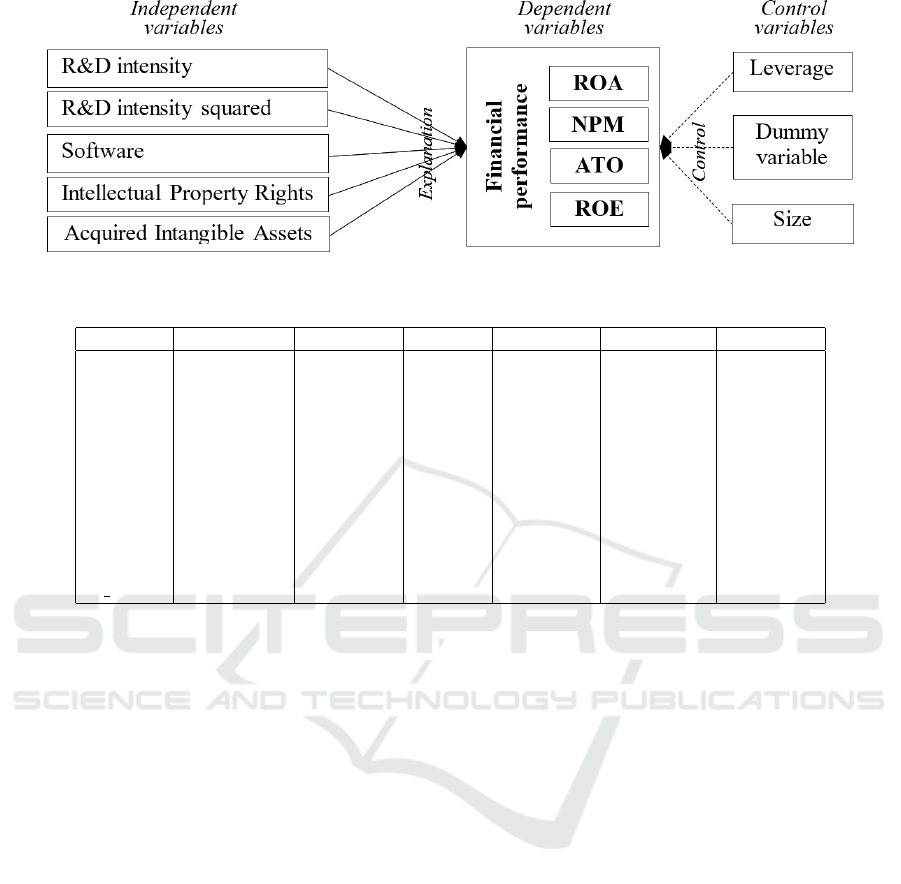
Figure 4: Conceptual framework of the study.
Table 3: Descriptive statistics of variables (based on observations 1:1 – 180:5).
Variables Observation Mean Median St. Dev. Minimum Maximum
ROA 180 1,51 1,27 1,52 2,75e-005 24,9
NPM 180 -0,0325 0,00798 0,501 -6,80 2,97
ATO 180 1,70 1,39 1,61 6,88e-005 24,6
ROE 180 3,81 2,33 4,30 0,000120 38,2
LEV 180 0,438 0,429 0,265 0,000 0,988
RDI 180 0,129 0,000 0,652 -0,0346 9,91
RDI2 180 0,442 0,000 4,96 0,000 98,2
SOFT 180 2,00e+004 0,000 5,95e+004 0,000 5,18e+005
IPR 180 8,27e+003 0,000 2,89e+004 -2,57e+004 2,67e+005
AIA 180 2,00e+004 0,000 1,61e+005 0,000 3,20e+006
l SIZE 180 13,5 13,3 2,00 8,35 18,9
consider the application of pooled OLS model. For
Model 4 after application of F-statistics test F(179;
712) = 1,32394 of p-value 0,00693691, which is less
than 0,05 and shows the adequacy of application of
FEM. This is the test followed by the p-value = P(chi-
square (1) > 6,04321) = 0,0139599.
5.3 Assumption Test Results
To verify the adequacy of the Panel data for Mod-
els 1-4 that is collected about ICT companies, it
should be diagnosed using Normality test, Autocor-
relation test and Heteroscedasticity test. Normality
test for all Models 1-4 allowed to detect abnormal
distribution of the error. For example, for Model 1
for chi-square (2) = 4119,75 p-value = 0, which is
less than 0,05, and does not confirm zero hypothe-
ses about the normal distribution of balances. Re-
view null hypothesis about no first-order autocorre-
lation based on usage Wooldridge test for autocor-
relation allowed to confirm it for all four models.
In particular, for all Models 1-4 p-value it is more
than 0,05 (0,73367; 0,923389; 0,193049; 0,227822),
confirming null hypothesis. White test was used to
check the heteroscedasticity of a models 1–3. Since
the obtained p-value for each of the three models
(0,284134; 0,999935; 0,421088) is more than the crit-
ical value, the zero hypothesis about the absence of
heteroscedasticity is forgiven. For Model 4 with es-
timate parameter FEM was applied non-parametric
Walk test, which also was established the presence
of heteroscedasticity. In particular, chi-square(180)
= 78593,1 p-value = 0 was received. Since p-value is
less than 0,05, there is an inhomogeneous observation
and a different variance of a Model 4 random error,
which confirms the existence of heteroscodesticity.
To solve the problem of inadequacy of all Mod-
els 1–4 used by this data due to the problem of im-
proper distribution of the error and heteroscedasticity,
the use of robust estimators is proposed. They help
minimize or eliminate impact of outliers in a Mod-
els 1-4, improving the results of panel data regres-
sion analysis. Practice of use robust standard errors
in regression analysis was also used in research of sci-
entists who study the impact of intangible assets and
their components on the performance of enterprises
(
¨
Ozkan, 2022; Serpeninova et al., 2022).
5.4 Panel Data Regression Results
Model 1 (ROA). Tables 4–5 show the results of
regression analysis performed using pooled OLS
model. They show how the independent variable will
affect the dependent variable, which of the regres-
M3E2 2022 - International Conference on Monitoring, Modeling Management of Emergent Economy
46
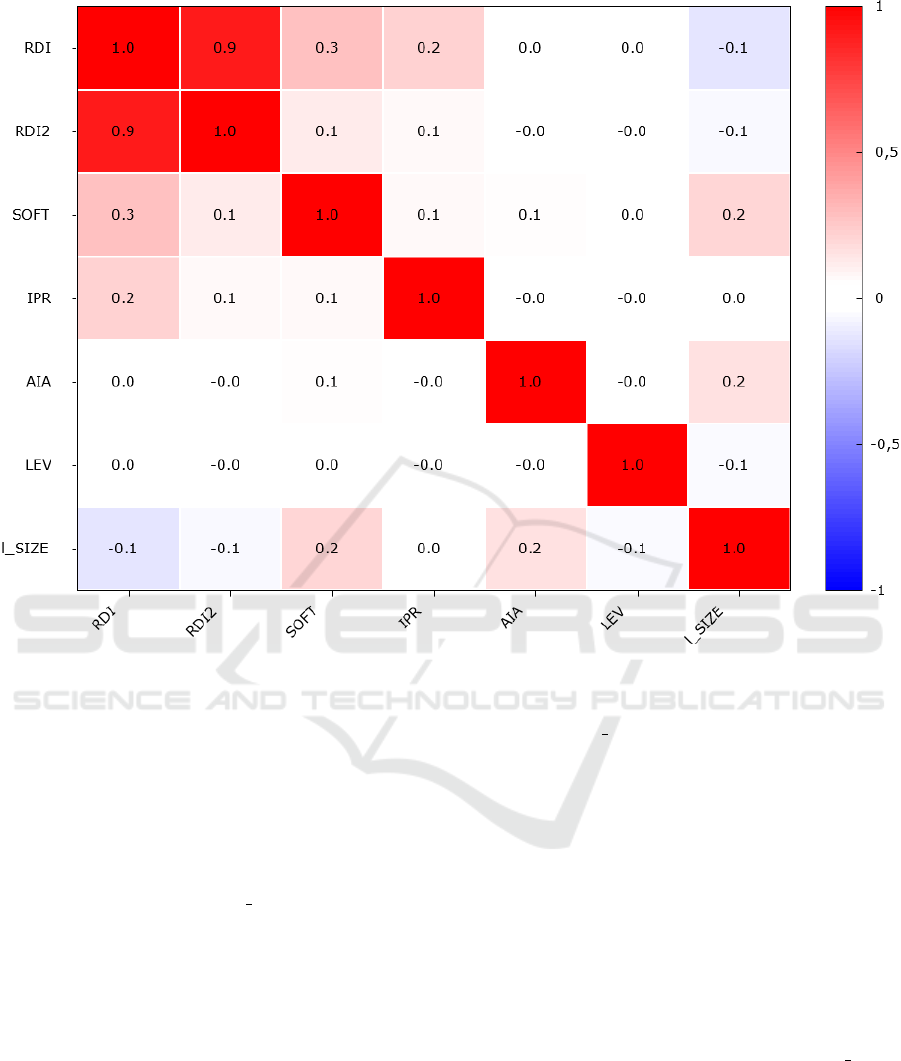
Figure 5: Correlation matrix of variables used in Models 1-4 (calculated via GRETL software package).
sions have significant influence, force and direction
of such influence.
Model 1 can be interpreted through the following
equation:
ˆy = 1, 83324 − 1, 16410 · 10
−6
x
1
+ 0, 110937x
2
+
1, 65440 · 10
−6
x
3
+ 1, 34184 · 10
−6
x
4
− 4, 98766 ·
10
−7
x
5
− 0, 137738x
6
− 0, 0379800x
7
+ 0, 168307x
8
where: ˆy – ROA; x
1
– RDI; x
5
– AIA; x
2
– RDI2;
x
6
– LEV; x
3
– SOFT; x
7
– l SIZE; x
4
– IPR; x
8
–
DVICTSS.
Based on the results of the regression analysis,
const, RDI, RDI2, SOFT and AIA are statistically
significant (there are stars in the last column of ta-
ble 4), having the highest level of significance at the
1% level. Accordingly, these indicators have the high-
est impact on ROA. In addition to RDI and AIA, other
significant indicators have a direct impact on ROA
and RDI and AIA are rotating. The presence of a dif-
ferent direction of influence in RDI and RDI2 indi-
cates the presence of U-inverted relationship between
R&D and ROA (Lehenchuk et al., 2022). Similar
U-inverted behavior is common to most of the costs
of non-material nature, in particular, social and envi-
ronmental costs (Sokil et al., 2020). The results also
show that there is no significant influence of control
variables (Lev, l SIZE, DVICTSS) on ROA.
The overall content of the regression coefficient of
Model 1 is that with an increase of 1 directly influenc-
ing the ROA, the last increase in the ratio will be in-
creased. For example, if SOFT is increased by 1, the
ROA will increase by 1,65440 ·10
06
. And for indica-
tors that have a positive impact on ROA, their increase
by 1 for ICT enterprises will result in corresponding
decrease of ROA (depending on the coefficient of re-
gression).
Table 5 indicates that the coefficient of determina-
tion (R-squared) of Model 1 is 0,047173. This means
only that 4,7% of the variation of ROA can be ex-
plained by the variation of the independent variables
(const, RDI, RDI2, SOFT, IPR, AIA, LEV, l SIZE,
DVICTSS).
Model 2 (NPM). Model 2 can be interpreted
through the following equation:
ˆy = −0, 274718 + 0, 0626252x
1
−
0, 00669466x
2
− 5, 13111 · 10
−8
x
3
+ 2, 00654 ·
10
−7
x
4
− 5, 88982 · 10
−8
x
5
− 0, 0630010x
6
+
0, 0269143x
7
− 0, 0517929x
8
where: ˆy – NPM; x
1
− x
8
– the same as in Model 1.
Empirical Evidence of Intangible Assets Improve the Financial Performance of Slovak ICT Companies
47

Table 4: Model 1 (ROA). Pooled OLS model (Robust standard errors), using the observations 1–900.
Variable Coefficient Standard error z P-value Significance by t-statistics
const 1,83324 0,632512 2,898 0,0038 ***
RDI −1,16410 0,157720 −7,381 <0,0001 ***
RDI2 0,110937 0,0175566 6,319 <0,0001 ***
SOFT 1,65440·10
−6
5,38521·10
−7
3,072 0,0021 ***
IPR 1,34184·10
−6
9,24827·10
−7
1,451 0,1468
AIA −4,98766·10
−7
1,38889·10
−6
−3,591 0,0003 ***
LEV −0,137738 0,214780 −0,6413 0,5213
l SIZE −0,0379800 0,0454674 −0,8353 0,4035
DVICTSS 0,168307 0,105500 1,595 0,1106
Note: *** Significant at the 1% level.
Table 5: Model 1 (ROA). Pooled OLS model (Robust standard errors), using the observations 1–900.
Indicator Value Indicator Value
Mean dependent var. 1,511304 S.D. dependent var. 1,524745
Sum squared resid. 1991,445 S.E. of regression 1,495014
R-squared 0,047173 Adjusted R-squared 0,038618
F(8, 179) 21,20706 P-value (F) 1,86·10
−22
Table 6: Model 2 (NPM). Pooled OLS model (Robust standard errors), using the observations 1–900.
Variable Coefficient Standard error z P-value Significance by t-statistics
const –0,274718 0,116547 –2,357 0,0184 **
RDI 0,0626252 0,0295138 2,122 0,0338 **
RDI2 –0,00669466 0,00314309 –2,130 0,0332 **
SOFT –5,13111·10
−8
1,17552·10
−7
–0,4365 0,6625
IPR 2,00654·10
−7
1,99115·10
−7
1,008 0,3136
AIA –5,88982·10
−8
2,90523·10
−8
–2,027 0,0426 **
LEV –0,0630010 0,0813673 –0,7743 0,4388
l SIZE 0,0269143 0,00838749 3,209 0,0013 ***
DVICTSS –0,0517929 0,0272405 –1,901 0,0573 *
Note: * Significant at the 10% level; ** Significant at the 5% level; *** Significant at the 1% level.
Table 7: Model 2 (NPM). Pooled OLS model (Robust standard errors), using the observations 1–900.
Indicator Value Indicator Value
Mean dependent var. -0,032511 S.D. dependent var. 0,501315
Sum squared resid. 222,9308 S.E. of regression 0,500203
R-squared 0,013291 Adjusted R-squared 0,004432
F(8, 179) 2,238141 P-value (F) 0,026686
Based on table 6, the most significant effect on
NPM is changed to l SIZE. Accordingly, with the
growth of the enterprise volume by 1 increases the
value of the NPM indicator by 0,0269143. Signifi-
cant at the 5% level in NPM explanation have regres-
sors const, RDI, RDI2 and AIA. Also significant at
the 10% level is the DVICTSS regression, which has
an indirect effect. Indirect effects on NPM are also
affected by the RDI2 and AIA indicators. This means
that, as investments in such types of intangible assets
increase, the corresponding (depending on the regres-
sion coefficient) reduction of the dependent variable
will occur. By comparing the coefficient of Model 2
with RDI and RDI2, it is possible to note the existence
of the upper limit of investments in R&D of Slovak
ICT companies, after which their negative impact on
NPM will already be observed.
Table 7 indicates that the R-squared of Model 2
is 0,01, a very low value and does not allow to speak
about the significant role of intangible assets in NPM
provision. This means that 1,33% of the variation of
the NPM can be explained by the variation of regres-
sors.
Model 3 (ATO). Model 3 can be interpreted
M3E2 2022 - International Conference on Monitoring, Modeling Management of Emergent Economy
48

Table 8: Model 3 (ATO). Pooled OLS model (Robust standard errors), using the observations 1–900.
Variable Coefficient Standard error z P-value Significance by t-statistics
const 2,80330 0,637648 4,396 <0,0001 ***
RDI –1,42622 0,174982 –8,151 <0,0001 ***
RDI2 0,134772 0,0192228 7,011 <0,0001 ***
SOFT 2,76920·10
−6
6,38619·10
−7
4,336 <0,0001 ***
IPR 4,61116·10
−6
1,59970·10
−6
2,883 0,0039 ***
AIA –4,38715·10
−7
1,36505·10
−7
–3,214 0,0013 ***
LEV –0,139781 0,233510 –0,5986 0,5494
l SIZE –0,0951285 0,0438796 –2,168 0,0302 **
DVICTSS 0,150857 0,124085 1,216 0,2241
Note: ** Significant at the 5% level; *** Significant at the 1% level.
Table 9: Model 3 (ATO). Pooled OLS model (Robust standard errors), using the observations 1–900.
Indicator Value Indicator Value
Mean dependent var. 1,703817 S.D. dependent var. 1,614880
Sum squared resid. 2212,759 S.E. of regression 1,575898
R-squared 0,056170 Adjusted R-squared 0,047696
F(8, 179) 15,95424 P-value (F) 1,15·10
−17
through the following equation:
ˆy = 2, 80330 − 1, 42622x
1
− 0, 134772x
2
+
2, 76920 · 10
−6
x
3
+ 4, 61116 · 10
−6
x
4
− 4, 38715 ·
10
−7
x
5
− 0, 139781x
6
− 0, 0951285x
7
+ 0, 150857x
8
where: ˆy – ATO; x
1
− x
8
– the same as in Model 1.
For dependent variable ATO except for LEV and
DVICTSS, all other regressions are significant. In
particular, l SIZE significant at the 5% level, and all
other regressions (const, RDI, RDI2, SOFT, IPR and
AIA) significant at the 1% level. Direct effects on
ATO from the regression data are RDI2, SOFT and
IPR, while others are affected. In particular, as in
Model 1 for ROA, making a small amount of invest-
ments in R&D of Slovak ICT companies has a nega-
tive impact on ATO. Only their implementation from
a certain volume, in particular, in the volume of RDI2,
ensures the growth of ATO. Based on an equal to
1,3 RDI2 growth by 1 increases the NPM value by
0,0269143. Table 9 indicates that the R-squared of
Model 3 is 0,056. This means that 5,61% of the vari-
ation of the ATO can be explained by the variation of
regressors.
Model 4 (ROE). Model 4 can be interpreted
through the following equation:
ˆy = −1, 06067 − 2, 79903x
1
+ 0, 272431x
2
+
5, 89712 · 10
−6
x
3
+ 8, 97938 · 10
−7
x
4
− 1, 27997 ·
10
−6
x
5
+ 8, 94081x
6
+ 0, 0265371x
7
+ 0, 392670x
8
where: ˆy – ROE; x
1
− x
8
– the same as in Model 1.
Model 4 has five statistically significant regres-
sors – RDI, RDI2, SOFT, AIA and LEV (table 10).
All of them have the highest level of significance –
1%, therefore they have the greatest influence on the
dependent variable (ROE). The equation of Model 4
shows that most of the independent variables (RDI2,
SOFT, IPR, LEV, l
SIZE and DVICTSS) have a di-
rect influence, and only two variables (const, RDI and
AIA) have a rotational influence on the ROE. As in
Models 1 and 3, Model 4 has a U-inverted relationship
between R&D and ROA, characterized by the need to
increase investment in R&D of Slovakia ICT compa-
nies to ensure their positive impact on ROE.
Table 11 indicates that the LSDV R-squared of
Model 4 is 0,51. This is quite a high value compared
to the 1–3 models, but not enough to speak about the
significant role of intangible assets in providing of fi-
nancial performance of ICT companies. This means
that 51,61% of the variation of the ROE can be ex-
plained by the variation of the regressors.
6 DISCUSSION
The results obtained in the article partially confirm
the conclusions of the analyzed works on the role of
intangible assets in the promotion of financial per-
formance of high-tech companies. As for some re-
gressions, they are in conflict with such conclusions.
The existence of a positive and significant relation-
ship between intangible assets and some financial per-
formance measures was confirmed, which is also set
in the works of Li and Wang (Li and Wang, 2014),
D
ˇ
zenopoljac et al. (D
ˇ
zenopoljac et al., 2016), Zhang
(Zhang, 2017). The presence was also established of
negative and significant impact of AIA on all finan-
cial performance indicators, this confirms the results
of the research (Qureshi and Siddiqui, 2020; Lopes
Empirical Evidence of Intangible Assets Improve the Financial Performance of Slovak ICT Companies
49

Table 10: Model 4 (ROE). FEM (Robust standard errors), using the observations 1–900.
Variable Coefficient Standard error z P-value Significance by t-statistics
const –1,06067 1,27812 –0,8299 0,4066
RDI –2,79903 0,466001 –6,006 <0,0001 ***
RDI2 0,272431 0,0565526 4,817 <0,0001 ***
SOFT 5,89712·10
−6
2,18175·10
−6
2,703 0,0069 ***
IPR 8,97938·10
−7
3,30604·10
−6
0,2716 0,7859
AIA –1,27997·10
−6
3,62115·10
−7
–3,535 0,0004 ***
LEV 8,94081 0,614350 14,55 <0,0001 ***
l SIZE 0,0265371 0,0848603 0,3127 0,7545
DVICTSS 0,392670 0,344744 1,139 0,2547
Note: *** Significant at the 1% level.
Table 11: Model 4 (ROE). FEM (Robust standard errors), using the observations 1–900.
Indicator Value Indicator Value
Mean dependent var. 3,812005 S.D. dependent var. 4,304137
Sum squared resid. 8058,382 S.E. of regression 3,364216
LSDV R-squared 0,516144 Within R-squared 0,348421
and Ferreira, 2021). At the same time, the direction
and influence of different types of regressions used in
the study are not the same in all formed models, but
depends on a particular kind of financial performance
indicator. One of the reasons for this is that the rela-
tionship between intangible assets on financial perfor-
mance may depend on macroeconomic factors, in par-
ticular, on the level of science capacity in the industry
and on the level of innovation in the country, which is
noted by Qureshi and Siddiqui (Qureshi and Siddiqui,
2020). Another reason for such results may be incom-
plete information about intangible assets disclosed in
the financial statements of Slovak ICT companies. In
turn, this is a consequence of the conservatism of
the current methodology of recognizing and evalu-
ating intangible assets, which Zhang (Zhang, 2017)
also points out, Radoni
´
c et al. (Radoni
´
c et al., 2021).
Therefore, the findings of this study confirm the pro-
posal of Serpeninova et al. (Serpeninova et al., 2022)
regarding the necessity of expanding the criteria for
recognizing and the structure of financial reporting for
high-tech companies regarding intangible assets.
The results of the survey refutes the conclusions
of Gan and Saleh (Gan and Saleh, 2008) on the pos-
itive impact of the company’s size on the improve-
ment of financial performance (ROA), but such an
impact was found with respect to NPM. The above
confirms the hypothesis of Del Monte and Papagni
(Del Monte and Papagni, 2003) that to increase the re-
turns from intangible investments should be provided
with their proper quality level, not quantitative imita-
tions. Therefore, an intangible investment policy of
ICT companies should be based not only on quanti-
tative parameters, that is, not on the basis of total in-
vestment in the company, but on the individual role
of certain types of intangible assets in improving of
financial performance.
The study has some limitations, which should be
taken into account by other scientists when evaluat-
ing the results of a study. Firstly, given the sufficient
breadth of the term “financial performance”, a list of
dependent variables used in the study can be speci-
fied. Second, the list of independent variables used
in a study can be expanded by uncapitalized intangi-
ble assets that also affect the financial performance
of Slovakia ICT companies. However, it is necessary
to separate from the composition of different types of
expenses of ICT companies those expenses connected
with creation of intangible assets (client, ecological,
social, etc.), as such data are not in financial state-
ments of companies. Third, to determine the role of
intangible assets in improvement of financial perfor-
mance, research can be carried out not only on the
examples of companies of ICT industry, but also on
the example of other branches of economy. This will
allow to carry out an interindustry comparison and es-
tablish in which areas of management of enterprises
should pay the most attention to development of an
intangible investment policy.
7 CONCLUSION
The present research was performed in order to study
the effects of intangible assets on the financial perfor-
mance of high-tech companies. For this purpose, the
activity of 180 Slovak ICT companies over the period
2015–2019 was analyzed. Such research is especially
M3E2 2022 - International Conference on Monitoring, Modeling Management of Emergent Economy
50

relevant in the conditions of the ICT sector’s impor-
tant role in the development of the Slovak economy.
As a result, Slovak Government creates the necessary
favorable institutional conditions for further develop-
ment of ICT companies and implements special pro-
grams to stimulate investment in this sector.
Panel data regression analysis was used as the ba-
sic method of research. Return on assets, Net Profit
Margin, Assets Turnover and Return on Equity were
selected as dependent variables that characterize fi-
nancial performance. For each of these indicators a
model was formed, which included eight independent
variables. It is intangible assets variables (Research
and Development Intensity, Research and Develop-
ment Intensity Squared, Software, Intellectual Prop-
erty Rights, Acquired Intangible Assets), and three –
control variables (Leverage, Size, Dummy variable
for ICT sub-sectors) for the 2015–2019 period. For
each of the models the estimate panel data parameter
was chosen based on F-statistics test, Breusch-Pagan
test and Hausman test (Model 1–3 – pooled OLS
model, Model 4 – FEM). The adequacy of each of the
models of the formed data was tested on the basis of
the Normality test, Autocorrelation test (Wooldridge
test for autocorrelation) and Heteroscedasticity test
(White test, Walk test) with the application of the
GRETL software package. Based on the incomplete
adequacy of the models to the generated data the ex-
pediency of robust standard errors use was substanti-
ated.
The hypothesis of the study was partially con-
firmed as a result of the conducted research. The re-
sults of panel regression analysis have shown that not
all types of intangible assets have a significant posi-
tive impact on the financial performance of Slovakia
ICT companies. Only RDI, RDI2 and AIA have sig-
nificant influence of different forces on all four types
of dependent indicators, which characterize the finan-
cial performance of the company. This is evidence of
the expediency of management making investments
in these types of intangible assets of the Slovak ICT
companies. The presence of different directions of
influence of RDI and RDI2 on indicators of the finan-
cial performance testifies to existence of U-inverted
relationship between R&D and such indicators of two
types. By the first type (Models 1, 3, 4) RDI is out of
the zone of return of investments in R&D, and RDI2
is within it. And by the second type (Model 2) RDI
enters the profit zone, and RDI2 is already outside it.
Based on these results, management of ICT compa-
nies may decide to make additional investments in
R&D or to reduce them in order to provide better
financial performance of the company. In all mod-
els studied, the independent variable AIA has a high
level of significance, but turns to the performance
of financial performance of Slovak ICT companies.
This shows that long-term intangible assets have not
yet been put into operation, and therefore need to be
more quickly brought into business processes of Slo-
vak ICT companies. In addition, there should be an
effective system of planning processes for acquisition
of intangible assets in accordance with the company’s
needs as an element of its intangible investment pol-
icy.
Research results also show that when using lever-
age, Size and Dummy variable for ICT sub-sectors
as a control variables only l SIZE has a significant
impact on NPM (1% level) and ATO (5% level),
DVICTSS on NPM (10% level) and LEV on ROE
(1% level). That is, the level of influence of control
variables on the indicators of financial performance is
partial and varied, and applies only to certain types of
them, in particular, not at all affecting ROA.
ACKNOWLEDGEMENTS
This article is an output of the project of the Scientific
Grant Agency of the Ministry of Culture of the Slovak
Republic and Slovak Academy of Sciences (VEGA)
no. 1/0517/20 (2020–2022) “Virtual Cryptochains as
a Relevant Tool to Eliminate Economic Crime”
REFERENCES
Abeysekera, I. (2008). Intellectual Capital Accounting:
Practices in a developing country. Routledge, Lon-
don. https://doi.org/10.4324/9780203937617.
Daum, J. H. (2002). Intangible Assets and Value Creation.
John Wiley & Sons Ltd., Chichester.
Del Monte, A. and Papagni, E. (2003). R&D and the growth
of firms: Empirical analysis of a panel of Italian firms.
Research Policy, 32(6):1003–1014. https://doi.org/10.
1016/S0048-7333(02)00107-5.
Deloitte Touche Tohmatsu Limited (2022). IAS 38 — Intan-
gible Assets. https://www.iasplus.com/en/standards/
ias/ias38.
D
ˇ
zenopoljac, V., Jano
ˇ
sevic, S., and Bontis, N. (2016).
Intellectual capital and financial performance in
the Serbian ICT industry. Journal of Intellec-
tual Capital, 17(2):373–396. https://doi.org/10.1108/
JIC-07-2015-0068.
Gan, K. and Saleh, Z. (2008). Intellectual Capital and Cor-
porate Performance of Technology-Intensive Compa-
nies: Malaysia Evidence. Asian Journal of Business
and Accounting, 1(1):113–130. https://ajba.um.edu.
my/article/view/2197.
Hu
ˇ
nady, J., Pisar, P., and Durcekova, I. (2019). Busi-
ness R&D Expenditure in the ICT Sector: Effects on
Empirical Evidence of Intangible Assets Improve the Financial Performance of Slovak ICT Companies
51

Business Performance Indicators. In Proceedings of
the ENTRENOVA - ENTerprise REsearch InNOVAtion
Conference, volume 5, pages 519–530, Rovinj, Croa-
tia. https://www.econstor.eu/handle/10419/207714.
Ievdokymov, V., Ostapchuk, T., Lehenchuk, S., Grytsyshen,
D., and Marchuk, G. (2020). Analysis of the impact
of intangible assets on the companies’ market value.
Naukovyi Visnyk Natsionalnoho Hirnychoho Univer-
sytetu, 3:164–170. https://doi.org/10.33271/nvngu/
2020-3/164.
Khan, A. M. (2018). An Empirical Study of the Impact of
Intellectual Capital on the Financial Performance of
the Indian IT Sector. Journal of Corporate Finance
Research, 15(1):7–19. http://dx.doi.org/10.17323/j.
jcfr.2073-0438.12.1.2018.7-19.
Lehenchuk, S., Tumpach, M., Vyhivska, I., Makarovych,
V., and Laichuk, S. (2022). The Impact of Innovation
on the Profitability of Slovak Pharmaceutical Com-
panies. Marketing and Management of Innovations,
2:184–296. https://doi.org/10.21272/mmi.2022.2-25.
Li, H. and Wang, W. (2014). Impact of Intangible Assets on
Profitability of Hong Kong Listed Information Tech-
nology Companies. Business and Economic Research,
4(2):98–113. https://doi.org/10.5296/ber.v4i2.6009.
Lopes, I. T. and Ferreira, C. F. P. (2021). Intangibles
as innovative drivers for competitive businesses. In-
ternational Journal of Business Innovation and Re-
search, 24(2):238–260. https://doi.org/10.1504/ijbir.
2020.10024988.
Moberly, M. D. (2014). Safeguarding Intangible As-
sets. Butterworth-Heinemann. https://doi.org/10.
1016/C2013-0-15617-6.
Qureshi, M. J. and Siddiqui, D. A. (2020). The Effect of In-
tangible Assets on Financial Performance, Financial
Policies, and Market Value of Technology Firms: A
Global Comparative Analysis. Asian Journal of Fi-
nance & Accounting, 12(1):26–57. https://doi.org/10.
5296/ajfa.v12i1.16655.
Radoni
´
c, M., Milosavljevi
´
c, M., and Kne
ˇ
zevi
´
c, S. (2021).
Intangible Assets as Financial Performance Drivers
of IT Industry: Evidence from an Emerging Market.
E&M Economics and Management, 24(2):119–135.
https://doi.org/10.15240/tul/001/2021-2-008.
SARIO (2021). Information & Communications Technol-
ogy Sector in Slovakia. SARIO. Slovak Investment
and Trade Development Agency, Bratislava. https:
//sario.sk/sites/default/files/sario-ict-2021-02-05.pdf.
Serpeninova, Y., Lehenchuk, S., Mate
´
a
ˇ
sov
´
a, M.,
Ostapchuk, T., and Polishchuk, I. (2022). Im-
pact of intellectual capital on profitability:
Evidence from software development compa-
nies in the Slovak Republic. Problems and
Perspectives in Management, 20(2):411–425.
https://doi.org/10.21511/ppm.20(2).2022.34.
Sokil, O., Zvezdov, D., Zhuk, V., Kucherkova, S., and
Sakhno, L. (2020). Social and environmental costs:
The impact of accounting and analytical support on
enterprises’ sustainable development in Germany and
Ukraine. Economic Annals-XXI, 181(1–2):124–136.
http://dx.doi.org/10.21003/ea.V181-11.
Sundaresan, M., Linh, T. P. N., and Rey, M. (2021).
The Effects of Intangible Assets on Financial Per-
formance and Financial Policies of Listed Technol-
ogy Firms in Thailand. Apheit International Journal,
10(1):1–17. https://www.journals.apheit.org/jounal/
Inter-vol10no1/INT-01.pdf.
Ullberg, E., Edvinsson, L., and Yeh-Yun Lin, C. (2021). In-
tangible Asset Gap in Global Competitiveness: Map-
ping and Responding to the New Economy. Springer-
Briefs in Business. Springer, Cham. https://doi.org/
10.1007/978-3-030-55666-2.
Zavalii, T., Vikarchuk, O., and Constantinou, C. (2022).
Do marketing-related intangible assets affect the com-
pany’s net income? Public Policy and Accounting,
1(4):3–14. https://doi.org/10.26642/ppa-2022-1(4)
-3-14.
Zhang, N. (2017). Relationship between intangible as-
sets and financial performance of listed telecommu-
nication firms in China, based on empirical anal-
ysis. African Journal of Business Management,
11(24):751–757. https://doi.org/10.5897/AJBM2017.
8429.
¨
Ozkan, N. (2022). R&D spending and financial per-
formance: an investigation in an emerging mar-
ket. International Journal of Management Economics
and Business, 18(1):38–58. https://doi.org/10.17130/
ijmeb.964849.
M3E2 2022 - International Conference on Monitoring, Modeling Management of Emergent Economy
52
