
Flexible Evolutionary Model of Machine Learning of Organizational
Capital Development Strategies with Optimization of Spent Resources
Vasyl Porokhnya
1 a
, Vladyslav Penev
1
, Roman Ivanov
2 b
and Volodymyr Kravchenko
1
1
Classical private university, 70B Zhukovsky Str., Zaporizhzhia, 69061, Ukraine
2
Oles Honchar Dnipropetrovsk National University, 72 Gagarin Ave., Dnipro, 49000, Ukraine
Keywords:
Q-Leaning, Organizational Capital, Strategy, Q-Leaning, Optimization of Organizational Capital, Concept of
Alternative Selection.
Abstract:
As part of the follow-up, the conceptual pipeline was developed to the stage of machine learning Q-leaning
with the method of eliminating the most effective strategy for the development of organizational capital in the
structure of intellectual capital and increasing the reliability of taking away the results. In the final work, the
modeling of alternative strategies for the development of organizational capital with the alternatives of machine
learning was modeled. This simulation made it possible to simplify the search and development of options
for strategies for the development of organizational capital, real alternative ways, and to simplify management
decisions. For a more correct operation of machine learning, coefficients were introduced that affect the
decision-making by machine learning. Results indicate that the capital of the strategy is the acquisition of
innovative information potential and the capital of alternatives without intermediary victorious main functions
of formation and the establishment of mechanisms for managing intellectual capital in the aggregate with other
types of capital in them.
1 INTRODUCTION
The modern economy practically proves the effective-
ness of intellectual capital as one of the most effective.
The concept of intellectual capital is broader than the
concepts of intellectual property and intangible assets.
At the same time, it is close in meaning to the concept
of intangible capital, which has been used in works
on economic theory and econometrics since the be-
ginning of the 1970s (Brooking, 1996).
Daum (Daum, 2002) gave the definition of intan-
gible capital based on connections structured knowl-
edge and abilities that have the potential to develop
and create value.
Leontiev (Leontiev, 2002) defined intellectual
capital as the value of the set of intellectual assets
available to the enterprise, including intellectual prop-
erty, its natural and acquired intellectual abilities and
personnel skills, as well as accumulated knowledge
bases and useful relationships with other entities.
Roos et al. (Roos et al., 2005) defined intellectual
capital as all non-monetary and intangible resources
a
https://orcid.org/0000-0003-0820-8749
b
https://orcid.org/0000-0003-2086-5004
that participate in the creation of the organization’s
value and are fully or partially controlled by it.
Intellectual capital is difficult to research and cal-
culate its value due to the difficulty in determining
the components that belong to it. However, intellec-
tual capital can be divided into several capitals that
are part of it: human capital, organizational capital,
customer or consumer capital.
Each component of intellectual capital can be
structurally detailed:
1. Human capital, the value that the company’s em-
ployees bring through the application of skills,
know-how and expertise. Human capital is inher-
ent in people and can belong to an organization.
2. Organizational capital consists of: technological
capital; branding capital; capital of business cul-
ture; capital efficiency of added economic value
– EVA; capital of the strategy of attracting inno-
vations of the information potential. The criteria
for evaluating are manufacturability; productivity;
innovativeness; cooperativeness; adaptability; ef-
ficiency.
3. Customer equity, consisting of elements such
as customer relationships, supplier relationships,
Porokhnya, V., Penev, V., Ivanov, R. and Kravchenko, V.
Flexible Evolutionary Model of Machine Learning of Organizational Capital Development Strategies with Optimization of Spent Resources.
DOI: 10.5220/0011931400003432
In Proceedings of 10th International Conference on Monitoring, Modeling Management of Emergent Economy (M3E2 2022), pages 71-79
ISBN: 978-989-758-640-8; ISSN: 2975-9234
Copyright
c
2023 by SCITEPRESS – Science and Technology Publications, Lda. Under CC license (CC BY-NC-ND 4.0)
71

trademarks and trade names (which have value
only through customer relationships), licenses and
franchises.
Therefore, the presence of a multi-criteria ap-
proach to the application of intellectual capital creates
the complexity of its assessment. If we consider the
methods of measuring intellectual capital, the follow-
ing are the most common four categories proposed
by Sveiby (Sveiby, 2010): Direct Intellectual Capi-
tal Methods; Market Capitalization Methods; Return
on Assets methods; Scorecard Methods. But each of
them has certain disadvantages that should be consid-
ered in conjunction with machine learning methods.
Then there is an opportunity to build a general math-
ematical model with a unified machine learning algo-
rithm, and this affects the accuracy of estimates of all
structural elements of intellectual capital.
2 RESULTS
If we consider the structure of Organizational Capi-
tal (OC) as a set of its qualities and properties, their
ratios, which directly affect labor productivity, which
increases the income for personnel, the company as a
whole, society, and the nation, then there is an oppor-
tunity to cover all possible options for its evaluation.
1. Assessment of the level of manufacturability
Let’s move on to the assessment of the properties
of the components of manufacturability capital. We
will use its structure, which consists in determining
the share a
k
t
of the t-th property in the formation of the
k-th type of components of manufacturability capital
(k
t
k
), which allows us to establish the probable level of
the k-th type of manufacturability capital:
KT
t
k
=
n
ip
∑
k=1
k
k
t
∗ a
k
t
, (1)
where
KT
t
k
– technological capital;
k
k
t
– exploitation and repair manufacturability of
the structure to k item for t-th indicator (materials,
energy, labor, compatibility, etc.);
a
k
t
– volatility of the injection of the t-th indicator
for manufacturability of k item.
2. Capital assessment of business culture
CC
k
t
=
n
ip
∑
k=1
c
k
t
∗ b
k
t
(2)
where
CC
k
t
is the capital of business culture;
c
k
t
– organizational and corporate culture of a cer-
tain business model of doing business according to the
t-th indicator (liberty and democracy, monoactivity of
the business culture type; polyactivity of the business
culture type; reactivity of the business culture type,
etc.);
b
k
t
– the importance of the impact of the t-th indi-
cator on the cultural capital of the k-th business model
of doing business.
3. The efficiency capital of added economic value
The productivity of the production process has a
significant range of properties, the characteristic fea-
tures of which are formed and reflected by a signif-
icant network of indicators that have branched rela-
tionships of quantitative and qualitative capital assess-
ment of performance. Among the important features
of performance, the following should be noted:
• Activation of human heuristic abilities and struc-
turing of discovered knowledge and verification
according to the criterion of objectivity;
• Orderliness of the communication process for the
exchange of information flows, emotions, social
and individual values, economic interests;
• Formation and growth of the fundamental and
market value of the enterprise as a criterion of per-
formance.
• Identification and elimination of dysfunctions in
enterprise management, which arise due to a mal-
function.
Capital assessment of efficiency of added eco-
nomic value. Performance is assessed as the level of
intellectual leverage (LIL) and is calculated according
to the formula:
LIL =
△EVA%
△NOPLAT %
(3)
where:
△EVA% is the rate of profit growth;
△NOPLAT % is the growth rate of economic
added value.
LIL – the degree of sensitivity of profit to changes
in economic added value.
The level of intellectual leverage shows: how
many times the growth rate of economic added value
exceeds the growth rate of profit. This excess is pro-
vided with the help of the effect of intellectual lever-
age, one of the components of which is its differen-
tial (the ratio of the involved intellectual capital to its
own).
4. The capital of the strategy of attracting innova-
tions of the information potential
The information capital of the strategy or the cap-
ital of the strategy of attracting innovations of the in-
formation potential determines the trajectory of intel-
lectual capital and the direction of the implementa-
tion of the proposed strategy within the framework
M3E2 2022 - International Conference on Monitoring, Modeling Management of Emergent Economy
72

of the implementation of innovations of the informa-
tion potential, which is aimed at increasing the value
of capital and depends on the speed of updating this
strategy. Informational capital and its potential act as
investment capital to maximize the value of intellec-
tual capital:
∑
k
i=1
EVA
ROI
opt
−WACC
−CAPITAL
→ max (4)
where
ROI
opt
is the economic profitability of intellectual
capital;
WACC – weighted average interest rate of the in-
volved intellectual capital;
CAPITAL – the capital of the strategy of attracting
innovations of the information potential.
5. Capital of turning knowledge into a result
The capital of the transformation of knowledge
into a result declares the path of transformations from
an idea to the formalization of knowledge in official
documents and its structuring for communicative use
(Porokhnya, 2009). Therefore, its components are
the following indicators that reflect the characteristic
properties of transformations: an idea as a creative
and spiritual message, and the level of formalization
of knowledge in official documents.
An idea has its own depth of penetration into the
macro or micro world (Roos et al., 2005). Based on
Einstein’s thesis that the development of society re-
quires the improvement of everyday thinking, it is ap-
propriate to consider an idea-concept as a complex of
properties and relationships that determine the char-
acteristics of the image of the object of research. we
can establish a connection between intellectual capital
(figuratively speaking, the mass of intellectual sub-
stance that is at rest or in motion, that is, in its use)
and the strategy of interaction of processes in an eco-
nomic object and its results. The question arises, does
the strategy have energy? It is known that the strategy
has different value, that is, weight. Suppose that, like
any economic potential, it has potential energy, and
when the process of its realization takes place, it also
has kinetic energy. That is, strategy is the energy of
capital that goes to the realization of an idea-concept.
Therefore, it can have its own dimension. Strategy,
like any energy, consists of the energy of rest and the
momentum of intellectual capital. As the speed of this
impulse, we will take the speed of the generation of
an idea-concept in the direction predetermined by the
strategy. To measure images-properties, that is, the
amount of intellectual substance, a unit is introduced,
– image.
Any image of intellectual substance contains the
same number of images-properties that reflect the
properties of the object of the real world. For exam-
ple, the number of images-properties that character-
ize a person is a constant value, a number that can
be established experimentally, as Avogadro’s number
was established at one time (the principle of equiv-
alence in nature). But each person has a different
number of images-relationships characterizing his in-
tellectual capital. This value of images-relationships,
corresponding to intellectual capital, will be assigned
the unit of measurement – intel. Intel measures the
level (mass) of intellectual capital of a person, enter-
prise, state.
The definition of images-properties is a conse-
quence of the same type of process properties during
the realization of an idea-concept in time, which con-
tain a certain number of these images in one unit. We
denote the number of images-properties by N
img
:
N
img
=
100
image
− const (5)
From here we can determine the amount of the
level (mass) of the intellectual capital of the economic
system, which corresponds to the capital of trans-
forming knowledge into a result:
ic =
N
N
img
M
ic
(6)
where
N – the number of images-properties, respectively,
ideas-concepts,
M
ic
- the intellectual mass of image-properties per
image-property for a specific phenomenon, intel / im-
age.
The level of an idea-concept can be represented
in four quantitative measurements with the introduc-
tion of a unit of measurement – id, which contains a
certain integral number of images-objects that char-
acterize the properties of this very idea-concept using
established criteria:
• Elementary level (household, cognitive, which
does not require the formation of new knowl-
edge), where id = 1.
• The technological level associated with the emer-
gence of new technologies, etc., where id =
1000 = 1K.
• Conceptual level containing new knowledge and
discoveries, where id = 1000000 = 1M = 1000K.
• The planetary level is determined by the depth
of penetration of human activity into the macro
and micro world, where id = 1000000000 = 1G =
1000M = 1000000K.
In fConvert
t
k
– informativeness as a measure of
usefulness. The level of structuring of knowledge of
Flexible Evolutionary Model of Machine Learning of Organizational Capital Development Strategies with Optimization of Spent Resources
73

special and general scientific terms and its verifica-
tion according to the criterion of objectivity of the
k-th type of the indicator of capital transformations
according to the t-th component of this indicator.
In fCap
t
k
= In fConvert
t
k
/TotalExp – the level of
orderliness of the communication process for the ex-
change of information flows, emotions, social and in-
dividual values, economic interests of the k-th type of
the indicator of capital transformations according to
the t-th component of this indicator.
Evaluation of the capital of the transformation of
knowledge into a result
CP
t
k
=
n
ip
∑
k=1
(ic
t
k
+ In f Convert
t
k
+ In f Cap
t
k
)d
t
k
(7)
where
CP
t
k
– the capital of transforming knowledge into
a result;
ic
t
k
– the capital level of the transformation of
knowledge into the result of the k-th type of the indi-
cator of capital transformations according to the t-th
component of this indicator;
d
t
k
– the weight of the influence of the k-th indi-
cator of transformations on the capital of the trans-
formation of knowledge into a result according to the
t-th component of this indicator of transformations.
For a preliminary analysis of the capital criteria,
their importance, influence on the choice of the best
alternative for the development of the properties of or-
ganizational capital, we will use the method of hierar-
chical comparisons when evaluating the level of pri-
orities of alternatives, the results of which are shown
in the table 1.
The structure of OK is primarily related to brand-
ing capital, which is the main relative indicator of the
company’s attractiveness on the market and to some
extent attests to the fate of the firm’s market capital,
which is adjusted to its organizational, i.e., intellec-
tual capital.
The relevance of the use of machine learning in
the field of economics (Kobets and Novak, 2021) al-
lows us to consider many aspects of the strategy for
the development of organizational capital and ways
to optimize the cost of resources for its development
in different ways. Learning to find the most optimal
and less resource-intensive way of developing organi-
zational capital can be presented as a continuous cy-
cle that will end only after the specified conditions are
reached. (figure 1).
In the reinforcement learning algorithm, the
agent’s actions are directed to the steps to achieve suc-
cess with a reward estimate. After △t steps into the
next step, the human capital will decide some next
step. The weight for this step is calculated as γ
△t
,
Table 1: Influence of criteria on a choice of alternatives
(properties) of improvement of the level of capital.
Criteria
Properties
Intellectual
Communicative
Strategic
Cognitive
Innovative
Branding
capital
0.14 0.12 0.14 0.1 0.09
Technology
capital
0.12 0.14 0.13 0.14 0.1
Capital efficiency
of added economic
value
0.11 0.12 0.11 0.13 0.12
Capital of
business culture
0.11 0.12 0.13 0.11 0.12
The capital of the
strategy of
attracting
innovations of the
information
potential
0.1 0.12 0.13 0.12 0.1
General approach
0.11 0.12 0.13 0.115 0.11
where γ is the discount factor, which can take a value
from 0 and 1 (0 ≤ γ ≤ 1) and has the effect of eval-
uating actions that are aimed at achieving the human
capital goal. γ can be called the level of success in
achieving the desired state by human capital, when
the investment data changes at the △t step.
Thus, we can conclude that a function is required
that will determine the quality of combinations of the
state of human capital and the action aimed at it:
Q ÷ S × A → R. (8)
At the beginning of training, Q is initialized, pos-
sibly with an arbitrary fixed value – 0. After initial-
ization, at each moment of time t, the agent selects an
action, observes a reward, enters a new state (that may
depend on both the previous state and the selected ac-
tion), and Q is updated. The core of the algorithm is a
Bellman (Bellman, 1957) equation as a simple value
iteration update, using the weighted average of the old
value and the new information(Watkins and Dayan,
1992):
Q
new
(s
t
,a
t
) ← Q(s
t
,a
t
) + α×
(r
t
+ γ × maxQ(s
t+1
,a) − Q(s
t
,a
t
)), (9)
where r
t
is the reward received when moving from the
state S
t
to the state S
t+1
, and 0 < α ≤ 1;
Note that S
new
(s
t
, α
t
) is the sum of three factors:
M3E2 2022 - International Conference on Monitoring, Modeling Management of Emergent Economy
74
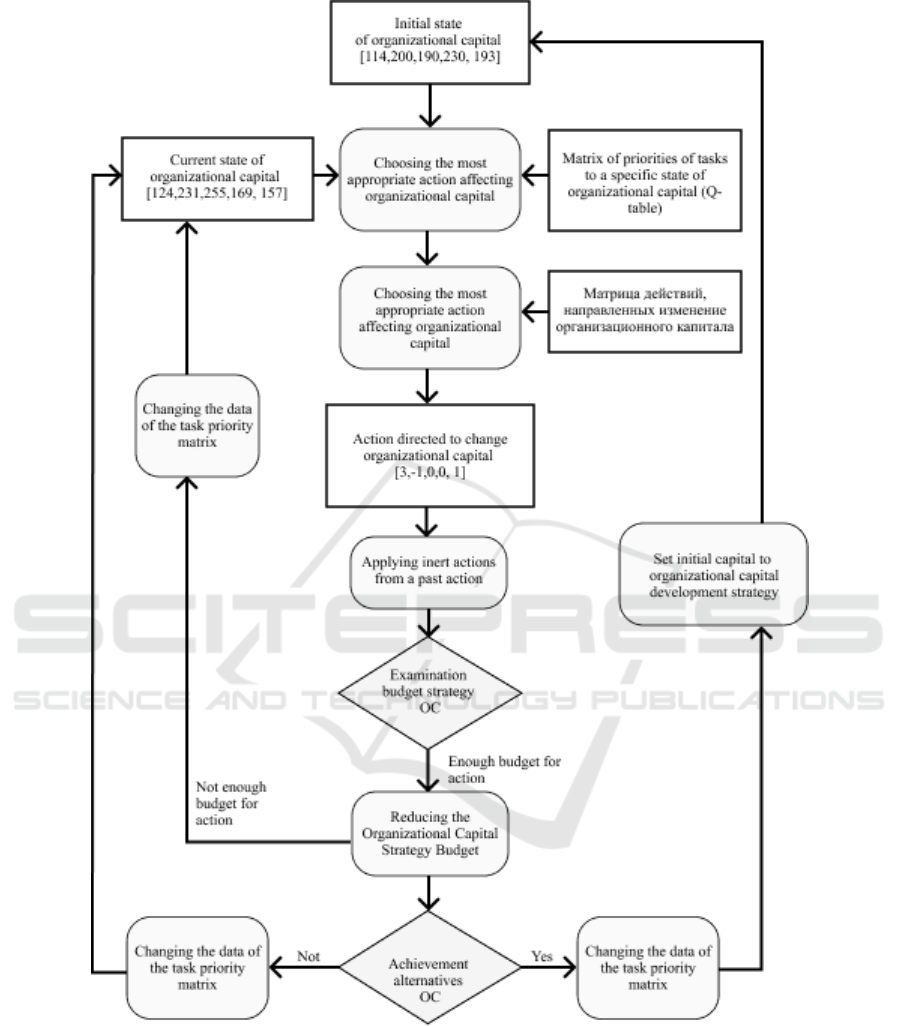
Figure 1: Machine learning of alternative development of human capital of the enterprise.
(1 − α)Q(s
t
,α
t
): the current value weighted by
the learning rate. Values of the learning rate near to 1
made faster the changes in Q;
αr
t
: the reward r
t
= r(s
t
,a
t
) to obtain if action a
t
is taken when in state s
t
(weighted by learning rate);
αγmax Q(s
t+1
,α): the maximum reward that can
be obtained from state s
t+1
(weighted by learning rate
and discount factor).
Each action has its own parameters, and system
changes can be limited by parameters that can be cor-
related with the required resource costs to apply the
action chosen by machine learning. Thus, each itera-
tion of training implies two possible effects:
1. Changes in the coefficient of effectiveness of the
Flexible Evolutionary Model of Machine Learning of Organizational Capital Development Strategies with Optimization of Spent Resources
75

action, depending on the state that the system ac-
quires as a result of the application of the action.
2. Return of the iteration to the initial state due to
non-compliance with the specified restrictions for
machine learning.
For the application of Q-Learning, the following
parameters were selected:
• Impact on the Intellectual Capital criteria
• Time spent in days
• Resource costs equivalent to monetary units
• The coefficient of the complexity of the action
• Risk ratio of failure to take action
• Inert influence on the system
• Coefficient of possibility of inert influence on the
system
Each action parameter is used in the calculation of
the effectiveness of the action taken at each training
step. Applied properties of actions can be represented
as a table of actions, which is presented in figure 2.
Figure 2: Action properties used in machine learning with
resource cost parameters.
Thus, at each iteration, the system calculates a
promising system that has already been acted upon
and recalculates the result of intellectual capital with
new parameters.
Thus, we can say that the calculation of the effec-
tiveness of the action is carried out according to the
following formula:
AE = IK
t+n
, (10)
where
AE – action efficiency;
IK – the cost of intellectual capital;
IK
t+n
— the cost of intellectual capital after ap-
plying the action.
So the value of AE will be rewards for moving to
the next machine learning state.
Q
new
(s
t
,a
t
) ← Q(s
t
,a
t
) + α×
(AE + γ × maxQ(s
t+1
,a) − Q(s
t
,a
t
)),
(11)
However, each action additionally has a time cost
parameter for performing this action, which can op-
tionally be included in the formula. For greater accu-
racy of calculations, you can use hours, days, months
or quarters. In this case, integer values of days were
used.
Thus, the new formula for calculating efficiency
can be represented as follows:
AE = IK
t+n
∗ T, (12)
where AE – action efficiency, T is the time spent on
applying the action
Also, an optional parameter can be resource costs,
which are presented in monetary terms. To simplify
the loads and quick calculations, all action parameters
can be divided by a certain coefficient Mk. In this
case, Mk = 1000.
Thus, if Action 1 has a resource cost (FE) of
1300000, then the resources spent can be represented
as RE and calculated by the formula:
RE =
FE
Mk
∗ T. (13)
Taking into account resource costs, the action ef-
ficiency formula will look like this:
AE =
IK
t+n
RE
∗ T. (14)
The calculation of resource costs can also include
the coefficient of complexity of performing an action
(W I), which can be represented by a value in the range
from 0.1 to 1.0. Thus, now the resource costs can be
represented as:
RE =
FE
Mk
∗ T ∗W I. (15)
Also, given the individuality of the systems to
which actions can be applied, it is worth considering
the risks of not performing an action (RoD) or its suc-
cess in execution.
The risk of investing in organizational capital is
the possibility that the accumulated organizational
capital will not bring the expected return, will not
be in demand in the market, or will not bring the
expected return. This value can be represented as a
range from 0 to 1. A low value of this coefficient
means a low level of success of the action and its high
risks. Given the risk ratio, the formula for the effec-
tiveness of action can be represented as follows:
RE = RoD
IK
t+n
RE
. (16)
M3E2 2022 - International Conference on Monitoring, Modeling Management of Emergent Economy
76

The relationship of all parameters of intellectual
capital does not exclude the influence of the develop-
ment of some parameters on the possibility of devel-
oping other parameters as a result of these actions.
Thus, each action has the values of the inert de-
velopment of intellectual capital and the coefficient
of the possibility of this development.
Given these parameters, the formula for the effec-
tiveness of actions can be represented as follows:
RE = ROD
IK
t+n
RE
+ PIK ∗ PP ∗ RoD, (17)
where PIK is the value of the possible inert devel-
opment of intellectual capital, PP is the probability
coefficient of the development of intellectual capital.
Thus, each iteration of training affects the value
of intellectual capital by changing the values of its
parameters. However, it is the efficiency values of the
action that are written to the state table, not the cost of
capital. Having an unlimited resource of investments,
achieving the desired value of the cost of intellectual
capital had a large set of action algorithms, but given
the parameters of each of the actions, machine learn-
ing will find the most optimal algorithm for this sys-
tem.
The development of Intellectual capital occurs
with the choice of an alternative to which the capital
must approach as a result of learning.
For more effective training and achievement of
the most favorable conditions for achieving the de-
sired alternative, development alternatives were intro-
duced. Development alternatives are coefficients for
each of the parameters of actions that affect the state
of capital. Using the hierarchy analysis method, the
following coefficients were introduced (table 2).
Table 2: Alternatives of the development method for man-
aging the choice of effective action.
Accelerated
Safe
Risky
Budgetary
Effective
IK 0.21 0.26 0.31 0.2 0.32
T 0.23 0.12 0.2 0.08 0.13
FE 0.12 0.12 0.12 0.09 0.12
W I 0.12 0.16 0.13 0.32 0.1
RoD 0.1 0.07 0.08 0.09 0.13
PIK 0.1 0.19 0.1 0.08 0.08
PP 0.12 0.07 0.06 0.14 0.12
For this study, a risky alternative of the method of
developing capital for machine learning was chosen.
Thus, each iteration of learning and applying ac-
tions to the system will affect the state table and cal-
culate its new values according to the following for-
mula:
AE = (RoD a
5
)
IK
t+n
a
1
(FE a
3
) (T a
2
)
+
(RoD a
5
) (PIK a
6
) (PP a
7
) (18)
After carrying out the calculations with the initial
data, the results describing the strategy for investing
in organizational capital shown in table 3.
Table 3: Factor of importance of action properties for learn-
ing.
IK T FE W I RoD PIK PP
a
1
a
2
a
3
a
4
a
5
a
6
a
7
0.31 0.2 0.12 0.13 0.08 0.1 0.06
It should be noted that the coefficients of capital
alternatives and development alternatives affect value
preferences and spending.
The first stages of training provide impressive in-
dicators of cost optimization for investment in orga-
nizational capital. With an increase in training cycles,
obtaining a better result becomes more rare.
The data in the table 4 and in the figure 3 show
optimization costs of developing organizational capi-
tal to achieve the cost of organizational capital, taking
into account the chosen alternative. It can be con-
cluded that in order to achieve the best results, it is
necessary to conduct a sufficient number of training
cycles.
Table 4: Initialized data affecting machine learning training
in the search for optimal investments in organizational cap-
ital.
Impact values on organizational capital
Action number
Salary
Branding Capital
Technology Capital
Value Added Efficiency Capital
Business Culture Capital
Implementation capital
innovation information capacity
16637 2219 52 286 313 45 333
25352 1431 155 121 95 128 318
74521 725 157 151 54 138 340
168348 684 184 115 74 123 286
2236341 485 133 87 33 142 118
14330450 336 197 90 51 165 114
17735547 294 127 44 201 153 134
Flexible Evolutionary Model of Machine Learning of Organizational Capital Development Strategies with Optimization of Spent Resources
77
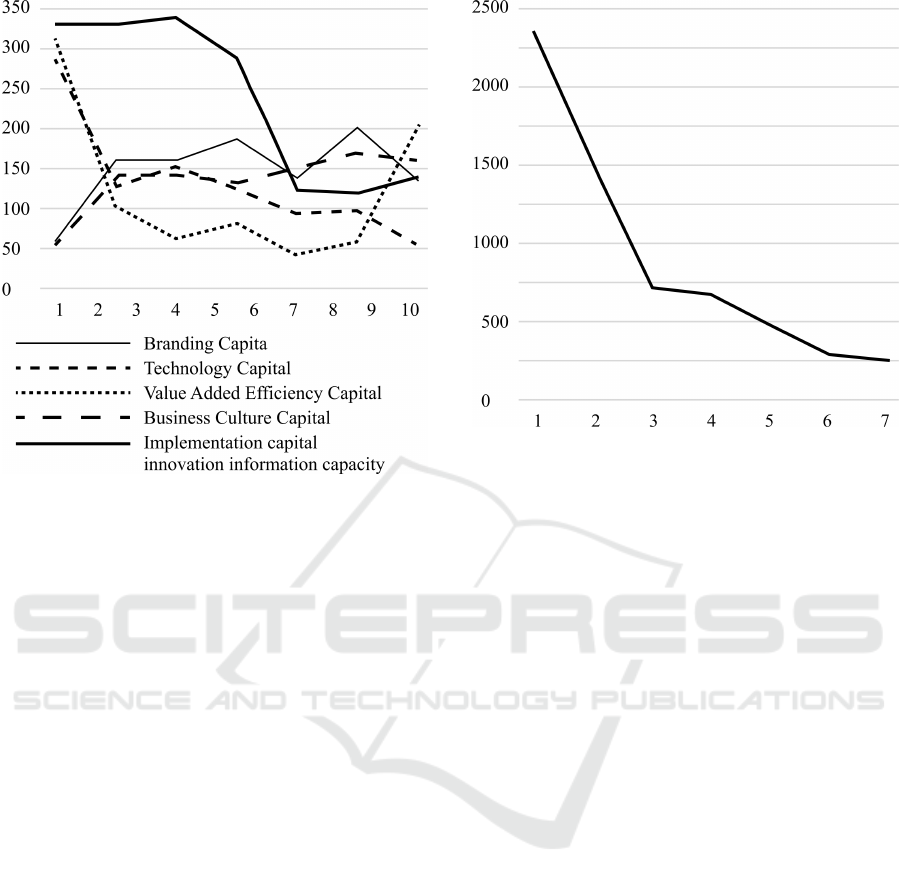
Figure 3: Machine learning of alternative development of
organizational capital of the enterprise.
Thus, after each stage of learning new indica-
tors, alternatives should be identified and calculations
should be made that determine subsequent invest-
ments in human capital. It should also be borne in
mind that each the alternative has its own character-
istic features and characteristics, behavioral connec-
tions and influence on the choice of options capital
investment.
Taking into account the dynamics of changes in
results, it can be concluded that subsequent train-
ing cycles can bring more optimized costs. Figure 4
shows the optimization of the costs of organizational
capital development, taking into account the same
level of organizational capital development.
It is also worth noting that when the input data
changes, machine learning will be able to rebuild and
generate calculations and optimize the result better
and faster than a person.
3 CONCLUSIONS
The study substantiates a conceptual approach to the
application of Q-leaning in order to obtain the most
effective strategy for the development of organiza-
tional capital in the structure of intellectual capital
and increase the reliability of the results obtained.
Consequently, the capital of the strategy for at-
tracting innovations of information potential and the
capital of alternatives directly perform the main func-
tions of the formation and application of intellectual
Figure 4: Machine learning of alternative development of
organizational capital of the enterprise.
capital management mechanisms in conjunction with
other types of capital and independently of them.
The main difficulty of this approach to choos-
ing alternative solutions for finding options for us-
ing organizational capital is the correct selection of
indicators of significance (return) of contributions to
the development of types of organizational capital,
on the basis of which systemic learning cycles oc-
cur. Such an approach can simplify the search and
development of options for organizational capital de-
velopment strategies, real alternative paths and sim-
plify management decisions.
It is worth noting that training tuning with chang-
ing the training parameters, namely the amount of
reward and the value of data optimization, training
constraints, can achieve better results by accelerat-
ing training and therefore obtaining data on a more
trained AI that can give better results.
Using machine learning to optimize organiza-
tional capital development costs is the best method.
Speed, lack of subjectivity and the ability to quickly
respond to external changes is an advantage over a
person.
To improve the results, it is worth making adjust-
ments to these actions and selecting the right alterna-
tives for choosing actions.
REFERENCES
Bellman, R. (1957). Dynamic Programming.
Princeton University Press, New York.
M3E2 2022 - International Conference on Monitoring, Modeling Management of Emergent Economy
78

https://www.gwern.net/docs/statistics/decision/
1957-bellman-dynamicprogramming.pdf.
Brooking, A. (1996). Intellectual Capital: Core Assets for
the Third Millenium. International Thompson Busi-
ness Press.
Daum, J. H. (2002). Intangible Assets, pages 152–154. Wi-
ley.
Kobets, V. and Novak, O. (2021). EU countries clustering
for the state of food security using machine learning
techniques. Neiro-Nechitki Tekhnolohii Modelyuvan-
nya v Ekonomitsi, 2021(10):86–118. https://doi.org/
10.33111/nfmte.2021.086.
Leontiev, B. B. (2002). Tcena intellekta. Intellektualnyi
kapital v rossiiskom biznese [The price of intelligence.
Intellectual capital in Russian business]. Moscow.
Porokhnya, V. (2009). The general theory of relativity of
economic growth. State and regions. Economy and
entrepreneurship series, pages 153–160.
Roos, G., Pike, S., and Fernstrom, L. (2005). Managing
Intellectual Capital in Practice. Butterworth-
Heinemann. https://www.researchgate.net/
publication/274392498.
Sveiby, K.-E. (2010). Methods for Measuring In-
tangible Assets. https://www.sveiby.com/article/
Methods-for-Measuring-Intangible-Assets.
Watkins, C. J. C. H. and Dayan, P. (1992). Q-learning.
Machine Learning, 8(3):279–292. https://doi.org/10.
1007/BF00992698.
Flexible Evolutionary Model of Machine Learning of Organizational Capital Development Strategies with Optimization of Spent Resources
79
