
High-Order Networks and Stock Market Crashes
Andrii O. Bielinskyi
1,2 a
, Vladimir N. Soloviev
1,4 b
, Serhii V. Hushko
2 c
, Arnold E. Kiv
3,5 d
and
Andriy V. Matviychuk
4,1 e
1
Kryvyi Rih State Pedagogical University, 54 Gagarin Ave., Kryvyi Rih, 50086, Ukraine
2
State University of Economics and Technology, 16 Medychna Str., Kryvyi Rih, 50005, Ukraine
3
Ben-Gurion University of the Negev, P.O.B. 653, Beer Sheva, 8410501, Israel
4
Kyiv National Economic University named after Vadym Hetman, 54/1 Peremogy Avenue, Kyiv, 03680, Ukraine
5
South Ukrainian National Pedagogical University named after K. D. Ushynsky, 26 Staroportofrankivska Str., Odesa,
65020, Ukraine
Keywords:
High-Order Network, Crash, Complex networks, Multiplex Networks, Visibility Graph, Indicator-Precursor.
Abstract:
Network analysis has proven to be a powerful method to characterize complexity in socio-economic systems,
and to understand their underlying dynamical features. Here, we propose to characterize the temporal evo-
lution of higher-order dependencies within the framework of high-order networks. We test the possibility of
financial crashes identification on the example of the Dow Jones Industrial Average (DJIA) index. Regard-
ing topological measures of complexity, we see drastic changes in the complexity of the system during crisis
events. Using high-order network analysis and topology, we show that, unlike traditional tools, the presented
method is the most perspective, comparing to traditional methods of financial time series analysis.
1 INTRODUCTION
The growing availability of extensive data, often with
time resolution, and coming from very different com-
plex systems, has led to the possibility of a detailed
study of their behavior, and in some cases also their
internal mechanisms. Complex systems of various na-
ture (biological, technical, financial, economic, etc.
(Barab
´
asi and P
´
osfai, 2016; Latora et al., 2017) con-
sist of numerous elementary units that interact het-
erogeneously with each other and in almost all cases
exhibit emergent properties at the macroscopic level.
Complex networks have become a powerful basis
for studying the structure and dynamics of such sys-
tems (Newman, 2010). However, despite notable suc-
cesses, their tools are limited to describing interac-
tions between two units (or nodes) at the same time,
which clearly contradicts the growing empirical data
on group interactions in many cases of heterogeneous
systems (Battiston and Petri, 2022). It turns out that
a
https://orcid.org/0000-0002-2821-2895
b
https://orcid.org/0000-0002-4945-202X
c
https://orcid.org/0000-0002-4833-3694
d
https://orcid.org/0000-0002-0991-2343
e
https://orcid.org/0000-0002-8911-5677
connections and relationships take place not only be-
tween pairs of nodes, but also as collective actions of
groups of nodes (Battiston et al., 2021; Sun and Bian-
coni, 2021), having a significant impact on the dy-
namics of interacting systems (Battiston et al., 2020;
Majhi et al., 2022).
The idea of higher-order interactions is well
known in the framework of solid-state physics when
the approximation of paired interactions was replaced
by multiparticle potentials or quantum mechanical
calculations. Or in thermodynamics and statistical
physics, Tsallis’ efforts have built a theory of nonex-
tensive interactions (Lyra and Tsallis, 1998; Bielin-
skyi et al., 2022). However, in all these cases, rep-
resentations of higher-order interactions are simple in
the sense that they do not contribute to the emerging
complexity of the problem. In complex systems, usu-
ally described as networks, the situation is different,
and in many cases these interactions need to be taken
into account using more complex mathematical struc-
tures, such as hypergraphs and simplicial complexes.
To date, various models of higher-order net-
works have been developed (Bobrowski and Kri-
oukov, 2022), the number of which, including mod-
ifications, is growing rapidly, given the relevance and
topicality of the study. Let’s briefly consider the main
134
Bielinskyi, A., Soloviev, V., Hushko, S., Kiv, A. and Matviychuk, A.
High-Order Networks and Stock Market Crashes.
DOI: 10.5220/0011931900003432
In Proceedings of 10th International Conference on Monitoring, Modeling Management of Emergent Economy (M3E2 2022), pages 134-144
ISBN: 978-989-758-640-8; ISSN: 2975-9234
Copyright
c
2023 by SCITEPRESS – Science and Technology Publications, Lda. Under CC license (CC BY-NC-ND 4.0)

models that have shown themselves positively (Ben-
son et al., 2018; Bick et al., 2021; Lambiotte et al.,
2019).
Multiplex Networks. Multiplex, multilayering,
and networks of networks have been proposed as
modeling paradigms for systems in which there are
different types of interactions (Boccaletti et al., 2014).
They are designed to account for links of different
types. However, in most cases, interactions are dyadic
in nature and therefore can be represented by tradi-
tional networks (Skardal et al., 2021). The use of
multiplex networks for financial analysis tasks is de-
scribed in detail in (Bardoscia et al., 2021; del Rio-
Chanona et al., 2020; Serguieva, 2016; Brummitt and
Kobayashi, 2015; Cao et al., 2021; Xie et al., 2022;
Gao, 2022; Aldasoro and Alves, 2018; Squartini et al.,
2018; del Rio-Chanona et al., 2020), and higher-order
networks in (Stavroglou et al., 2019; Jackson and
Pernoud, 2021; Saha et al., 2022; Battiston et al.,
2016; Huremovic et al., 2020; Franch et al., 2022;
Bartesaghi et al., 2022; Han et al., 2022).
Hypergraphs and Simplicial Complexes. Com-
putational methods from algebraic topology, hyper-
graphs, and simplicial complexes, which are sets of
nodes and hyperlinks, allow encoding any number of
units to explicitly consider systems beyond pairwise
interactions and extract any “shape” of the data (Bat-
tiston et al., 2020; Santoro et al., 2022; Battiston et al.,
2021; Berge, 1976).
Higher-order Markov Models for Sequential
Data. Markov models defined in networks have be-
come a popular way to describe and model the flows
of information, energy, mass, money, etc. between
various objects. If evolution is given by a Markov
process (of the first order), this process can be con-
sidered as a random walk through the graph (Masuda
et al., 2017). However, many empirically observed
flows in networks have some dependence on the path.
Thus, higher-order Markov chain models are required
(Lambiotte et al., 2019).
Higher-order graphical Models and Markov
Random Fields. Markov random fields, such as
the Ising model and more general graphical models,
have also been extended to higher-order models that
take into account the interaction between several ob-
jects (Shemesh et al., 2013; Komodakis and Paragios,
2009).
Finally, more recently, Santoro et al. (Santoro
et al., 2022) proposed a new structure for character-
izing instantaneous patterns of signal co-fluctuation
of all orders of interaction (pairs, triangles, etc.). To
study the global topology of such co-fluctuations,
they combined time series analysis, the theory of
complex networks, and the analysis of topological
data (Wasserman, 2018). They were able to show that,
unlike traditional time series analysis tools, higher-
order measures are able to reveal the subtleties of dif-
ferent space-time regimes in the case of three differ-
ent studies: brain activity at rest (measured by fMRI
data), stock option prices, and epidemic tasks.
In this paper, we consider the possibility of ap-
plying multiplex and higher-order network techniques
to modeling crisis states in the stock market. Sec-
tion 2 presents a graph representation of time series
based on the classically paired visibility – visibility
graph. Section 3 presents the theory of multiplex net-
works, which makes it possible to study systems of
subgraphs (layers) and their inter- and intra-layer con-
nections. Measures based on them are also provided.
Section 4 describes high-order network extensions,
various approaches to encoding high-order connec-
tions, and measures that will be used for both classical
and high-order networks. Section 5 presents empiri-
cal results, together with which a comparative anal-
ysis of measures based on classical networks, multi-
plex, and higher-order networks is carried out. Sec-
tion 6 presents the conclusions of the work done and
further prospects.
2 VISIBILITY GRAPH
Visibility graph (VG), which was proposed by Lacasa
et al. (Lacasa et al., 2008) is typically constructed
from a univariate time series. In a visibility graph,
each moment in the time series maps to a node in the
network, and an edge exists between the nodes if they
satisfy a “mutual visibility” condition.
“Mutual visibility” can be understood by imagin-
ing two points x
i
at time t
i
and x
j
at time t
j
as two hills
of a time series, which can be understood as a land-
scape, and these two points are “mutually visible” if x
i
has no any obstacles in the way on x
j
. Formally, two
points are mutually visible if, all values of x
k
between
t
i
and t
j
satisfy:
x
k
< x
i
+
t
k
−t
i
t
j
−t
i
[x
j
− x
i
], ∀k : i < k < j (1)
Horizontal visibility graph (HVG) (Luque et al.,
2009) is a restriction of usual visibility graph, where
two points x
i
and x
j
are connected if there can be
drawn a horizontal path that does not intersect an in-
termediate point x
k
, i < k < j. Equivalently, node x
i
at time t
i
and node x
j
at time t
j
are connected if the
horizontal ordering criterion is fulfilled:
x
k
< inf(x
i
, x
j
), ∀k : i < k < j. (2)
Figure 1 is an approximate illustration of the con-
struction of visibility graphs.
High-Order Networks and Stock Market Crashes
135

Figure 1: Schematic illustration of the VG (red lines) and
the HVG (green lines). Adapted from (Iacovacci and La-
casa, 2016).
3 MULTIPLEX ORDERNESS AND
MEASURES OF COMPLEXITY
Multiplex network (Kivel
¨
a et al., 2014) is the repre-
sentation of the system which consists of the variety
of different subnetworks with inter-network connec-
tions. For working with multiplex financial networks,
we set two tasks:
• convert separated time series into network that
represent a layer of a multiplex network. The pro-
cedure of conversion is presented in section 2;
• create intra-layer connection between each sub-
network.
Figure 2 represents an algorithm for creating a
three-layered multiplex visibility graph.
Figure 2: Illustration of the multiplex VG formation on the
example of three layers. Adapted from (Lacasa et al., 2015).
Multiplex network is the representation of a pair
M = (G,C), where
{
G
α
|α ∈ 1, . . . , M
}
is a set of
graphs G
α
= (X
α
, E
α
) that called layers and
C =
E
αβ
⊆ X
α
× X
β
|α, β ∈ 1, . . . , M, α ̸= β
(3)
is a set of intra-links in layers G
α
and G
β
(α ̸= β). E
α
is intra-layer edge in M, and each E
αβ
is denoted as
inter-layer edge.
A set of nodes in a layer G
α
is denoted as X
α
=
x
α
1
, . . . , x
α
N
α
, and an intra-layer adjacency matrix as
A
[α]
= (a
α
i j
) ∈ Re
N
α
×N
α
, where
α
α
i j
=
(
1, (x
α
i
, x
α
j
) ∈ E
α
,
0.
(4)
for 1 ≤ i ≤ N
α
, 1 ≤ j ≤ N
β
and 1 ≤ α ≤ M. For an
inter-layer adjacency matrix, we have A
[α, β]
(a
αβ
i j
) ∈
Re
N
α
×N
β
, where
α
αβ
i j
=
(
1, (x
α
i
, x
β
j
) ∈ E
αβ
,
0.
(5)
A multiplex network is a partial case of inter-layer
networks, and it contains a fixed number of nodes
connected by different types of links. Multiplex net-
works are characterized by correlations of different
nature, which enable the introduction of additional
multiplexes.
For a multiplex network, the node degree k is al-
ready a vector
k
i
= (k
[1]
i
, . . . , k
[M]
i
), (6)
with the degree k
[α]
i
of the node i in the layer α,
namely
k
[α]
i
=
∑
j
a
[α]
i j
, (7)
while a
[α]
i j
is the element of the adjacency matrix of
the layer α. Specificity of the node degree in vector
form allows describing additional quantities. One of
them is the overlapping degree of node i:
o
i
=
M
∑
α=1
k
[α]
i
. (8)
The next measure quantitatively describes the
inter-layer information flow. For a given pair
(α, β) within M layers and the degree distributions
P(k
[α]
), P(k
[β]
) of these layers, we can defined the so-
called interlayer mutual information:
I
α,β
=
∑∑
P(k
[α]
, k
[β]
)log
P(k
[α]
, k
[β]
)
P(k
[α]
), P(k
[β]
)
, (9)
where P(k
[α]
, k
[β]
) is the joint probability of finding a
node degree k
[α]
in a layer α and a degree k
[β]
in a
layer β. The higher the value of I
α,β
, the more cor-
related (or anti-correlated) is the degree distribution
of the two layers and, consequently, the structure of
a time series associated with them. We also find the
mean value of I
α,β
for all possible pairs of layers – the
scalar ⟨I
α,β
⟩ that quantifies the information flow in the
system.
The multiplex degree entropy is another multiplex
measure which quantitatively describes the distribu-
tion of a node degree i between different layers. It
M3E2 2022 - International Conference on Monitoring, Modeling Management of Emergent Economy
136
can be defined as
S
i
= −
M
∑
α=1
k
[α]
i
o
i
ln
k
[α]
i
o
i
. (10)
Entropy is close to zero if ith node degree is within
one special layer of a multiplex network, and it has the
maximum value when ith node degree is uniformly
distributed between different layers.
4 HIGH-ORDER EXTENSION OF
TEMPORAL NETWORKS
4.1 Time-Respecting Paths
Financial networks are strongly influenced by the or-
dering and timing of links. In their context of their
temporality, we must consider time-respecting paths,
an extension of the concept of paths in static network
topologies which additionally respects the timing and
ordering of time-stamped links (Holme and Saram
¨
aki,
2012; Kempe et al., 2002; Pan and Saram
¨
aki, 2011).
For a source node v and a target node w, a time-
respecting path can be presented by any sequence of
time-stamped links
(v
0
, v
1
;t
1
), (v
1
, v
2
;t
2
), ..., (v
l−1
, v
l
;t
l
), (11)
where v
0
= v, v
l
= w and t
1
< t
2
< ... < t
l
. Time
ordering of temporal financial networks is important
since it implies causality, i.e. a node i is able to influ-
ence node j relying on two time-stamped links (i, k)
and (k, j) only if edge (i, k) has occurred before edge
(k, j).
Apart the restriction on networks to have the cor-
rect ordering, it is common to impose a maximum
time difference between consecutive edges (Scholtes
et al., 2016), i.e. there is a maximum time differ-
ence δ and, example, two time-stamped edges (i, k;t)
and (k, j;t
′
) that contribute to a time-respecting path
if 0 ≤ t
′
− t ≤ δ. If δ = 1, we are usually interested
in paths with short time scales. For δ = ∞, we impose
no restrictions on time-range and consider a path def-
inition where links can be weeks or years apart.
4.2 High-Order Networks
The key idea behind this abstraction is that the com-
monly used time-aggregated network is the sim-
plest possible time-aggregated representation, whose
weighted links capture the frequencies of time-
stamped links. Considering that each time-stamped
link is a time-respecting path of length one, it is easy
to generalize this abstraction to higher-order time-
aggregate networks in which weighted links capture
the frequencies of longer time-respecting paths.
There are several variants for encoding high-order
interactions (Majhi et al., 2022). The first concept of
high-order links represent hyperlink, which can con-
tain any number of nodes. Hypergraph is the general-
ized notion of network which is composed of nodeset
V and hyper-edges E that specify which nodes from
V participate in which way.
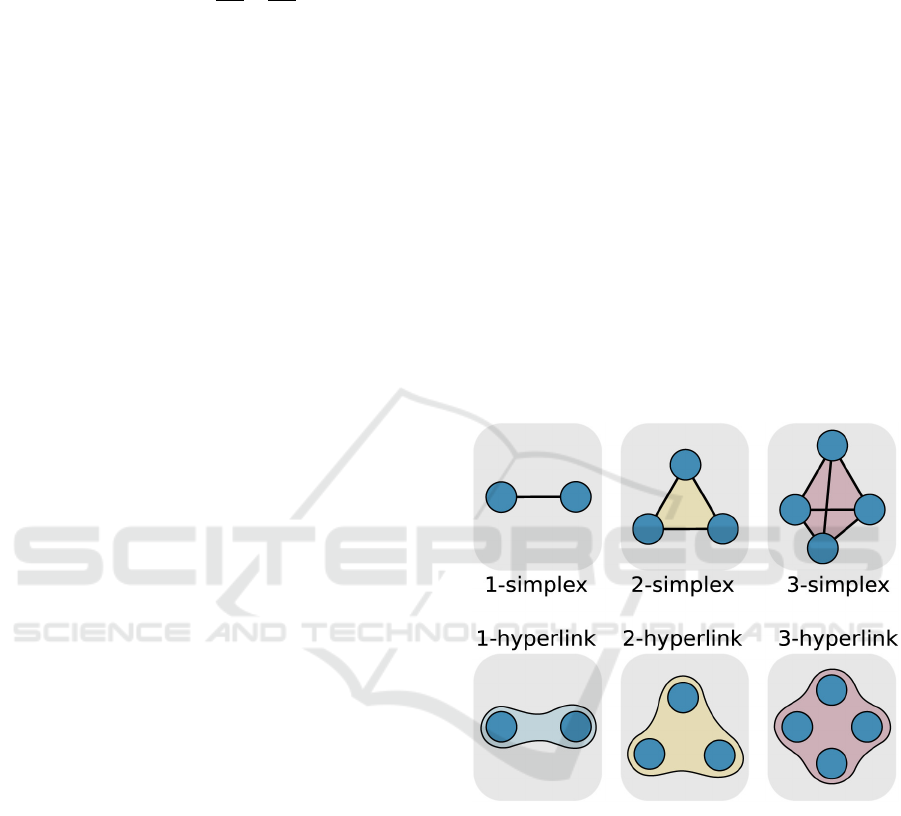
Simplex is another mathematical abstraction to
accomplish high-order interaction. Formally, a k-
simplex σ is a set of k + 1 fully interacting nodes
σ = [v
0
, v
1
, ..., v
k
]. Essentially, a node is 0-simplex,
a link is 1-simplex, a triangle is 2-simplex, a tetrahe-
dron is 3-simplex, etc. Since a standard graph is a
collection of edges, simplicial complexes are collec-
tions of simplices K = {σ
0
, σ
1
, ..., σ
n
}.
Figure 3 demonstrates examples of simplices and
hyperlinks of orders 1, 2, and 3.
Figure 3: High-order connections in terms of simplices and
hyperlinks. Adapted from (Battiston et al., 2020).
For a temporal network G
T
= (V
T
, E
T
) we thus
formally define a kth order time-aggregated (or sim-
ply aggregate) network as a tuple G
(k)
= (V
(k)
, E
(k)
)
where V
(k)
⊆ V
k
is a set of node k-tuples and E
(k)
⊆
V
(k)
× V
(k)
is a set of links. For simplicity, we call
each of the k-tuples v = v
1
−v
2
−... −v
k
(v ∈ V
(k)
, v
i
∈
V ) a kth order node, while each link e ∈ E
(k)
is called
a kth order link. Between two kth order nodes v and
w exists kth order edge (v, w) if they overlap in ex-
actly k − 1 elements. Resembling so-called De Bruijn
graphs (De Bruijn, 1946), the basic idea behind this
construction is that each kth order link represents a
possible time-respecting path of length k in the un-
derlying temporal network, which connects node v
1
High-Order Networks and Stock Market Crashes
137

to node w
k
via k time-stamped links
(v
1
, v
2
= w
1
;t
1
), ..., (v
k
= w
k−1
, w
k
;t
k
). (12)
Importantly, and different from a first-order repre-
sentation, kth order aggregate networks allow to cap-
ture non-Markovian characteristics of temporal net-
works. In particular, they allow to represent tem-
poral networks in which the kth time-stamped link
(v
k
= w
k−1
, w
k
) on a time-respecting path depends on
the k − 1 previous time-stamped links on this path.
With this, we obtain a simple static network topol-
ogy that contains information both on the presence
of time-stamped links in the underlying temporal net-
work, as well as on the ordering in which sequences
of k of these time-stamped links occur.
4.3 Degree Centrality
Network centralities are node-related measures that
quantify how “central” a node is in a network. There
are many ways in which a node can be considered
so: for example, it can be central if it is connected to
many other nodes (degree centrality), or relatively to
its connectivity to the rest of the network (path based
centralities, eigenvector centrality). One of the sim-
plest centrality measure is the degree of a node, which
counts the number of edges incident to an ith node.
For any adjacency matrix the degree of a node i
can be defined as
D
i
=
∑
j
A
i j
. (13)
High-order degree centrality counts the number of
kth-order edges incident to the kth-order node i. To
get a scalar value which will serve as an indicator of
high-order dynamics, we obtain mean degree D
mean
:
D
mean
=
1
N
N
∑
i=1
D
i
. (14)
Except this measure, we can calculate nth moment
of the degree distribution, which can be defined as
⟨k
n
⟩ =
∞
∑
k
min
k
n
p
k
≈
Z
∞
k
min
k
n
p
k
dk. (15)
In this study we will present the dynamics of the
first moment, which is the mean weighted degree of a
network, and its high-order behavior.
4.4 Assortativity Coefficient
Assortativity is a property of network nodes that char-
acterizes the degree of connectivity between them.
Many networks demonstrate “assortative mixing” on
their nodes, when high-degree nodes tend to be con-
nected to other high-degree nodes. Other networks
demonstrate disassortative mixing when their high-
degree nodes tend to be connected to low-degree
nodes. Assortativity of a network can be defined via
the Pearson correlation coefficient of the degrees at
either ends of an edge. For an observed network, we
can write it as
r =
M
−1
∑
i
j
i
k
i
−
"
M
−1
∑
i
1
2
( j
i
+ k
i
)
#
2
!
,
M
−1
∑
i
1
2
j
2
i
+ k
2
i
−
"
M
−1
∑
i
1
2
( j
i
+ k
i
)
#
2
!
,
(16)
where −1 ≤ r ≤ 1; j
i
, k
i
are the degrees of the nodes
at the ends of the ith edge, with i = 1, ..., M, where M
is the number of edges of a network.
This correlation function is zero for no assortative
mixing. If r = 1, then we have perfect assortative mix-
ing pattern. For r = −1, we can observe perfect dis-
assortativity.
Studying financial networks, with time-respecting
paths, we can consider four type of assortativity:
r(in, in), r(in, out), r(out, in), r(out, out), which will
correspond to tendencies to have similar in and out
degrees. We can denote one of the studied in/out pairs
as (α, β). Suppose, for a given ith edge, we have got
the source (i.e. tail) node of the edge and target (i.e.
head) node of the edge. We can denote them as α-
degree of the source ( j
α
i
) and β-degree of the target
(k
β
i
). Assortativity coefficient for degrees of a specific
type can be defined as
r(α, β) =
∑
i
j
α
i
− j
α
k
β
i
− k
β
q
∑
i
j
α
i
− j
α
2
r
∑
i
k
β
i
− k
β
2
, (17)
where j
α
and k
β
are the average α-degree of sources
and β-degree of targets.
5 EMPIRICAL RESULTS
To build indicators (indicators-precursors) based on
multiplex and high-order networks, the following is
done:
• databases of 6 most influential stock mar-
ket indices for the period from 02.01.2004 to
18.10.2022 were selected for multiplex analysis
M3E2 2022 - International Conference on Monitoring, Modeling Management of Emergent Economy
138

(see figure 4). The data were extracted using Ya-
hoo! Finance API based on Python programming
language (Aroussi, 2022);
• the indicators described in the previous sections
were calculated using the sliding window proce-
dure (Bielinskyi et al., 2022; Soloviev et al., 2020;
Bielinskyi et al., 2021c,b; Kiv et al., 2021; Bielin-
skyi and Soloviev, 2018; Bielinskyi et al., 2020).
The essence of this procedure is that: (1) a frag-
ment (window) of a series of a certain length w
was selected; (2) a network measure was calcu-
lated for it; (3) the measure values were stored in
a pre-declared array; (4) the window was shifted
by a predefined time step h, and the procedure
was repeated until the series was completely ex-
hausted; (5) further, the calculated values of the
network measure were compared with the dynam-
ics of the stock index. Subsequently, conclusions
were drawn regarding the further dynamics of the
market. In our case, window length w = 500 days
and time step h = 10 day. The choice of step was
limited by the counting time for high-order net-
works;
• multiplex and high-order indicators are compared
with the Dow Jones Industrial Average (DJIA) in-
dex.
Figure 4: The dynamics of stock market indices for study-
ing multiplex characteristics.
In figure 5 presented the dynamics of inter-layer
mutual information (I) and multiplex degree entropy
(S) along with the DJIA index.
From figure 5 we can see that multiplex mutual in-
formation increases before the crisis of 2008. Also, it
noticeably becomes higher before COVID-19 crash.
For the last months, it demonstrates decreasing pat-
tern, which indicates that the economies of different
countries may be experiencing different evolutions
now. Nevertheless, it can be seen that, as a rule, this
Figure 5: The dynamics of inter-layer mutual information
(I) and multiplex degree entropy (S) along with the DJIA
index.
Figure 6: The dynamics of the mean degree (D
mean
) and
overlapping degree (o) along with the DJIA index.
indicator is characterized by growth, indicating an in-
crease in the interconnection of the economies of dif-
ferent countries. In a crisis, this indicator usually de-
clines, demonstrating different resistance to the col-
lapse events of the stock markets of countries and the
difference in the actions that they take. Entropy indi-
cator shows asymmetric behavior
Next, we compare one of the multiplex measure,
overlapping degree (o), with the mean degree of a net-
work (D
mean
). Figure 6 represents this result.
In figure 6 we can see that both D
mean
and o are
characterized by similar dynamics. These indicators
increase near the crash, which indicates an increase
in the concentration of connections for some network
nodes, and further, based on the indicators during the
crisis, there is a decline in concentration both in the
dynamics of the DJIA and the inter-layer connected-
ness of stock indices. We may see that the multiplex
High-Order Networks and Stock Market Crashes
139
approach does not significantly change the dynamics
of the concentration degree indicator in comparison
with the indicator based on the classical univariate
graph.
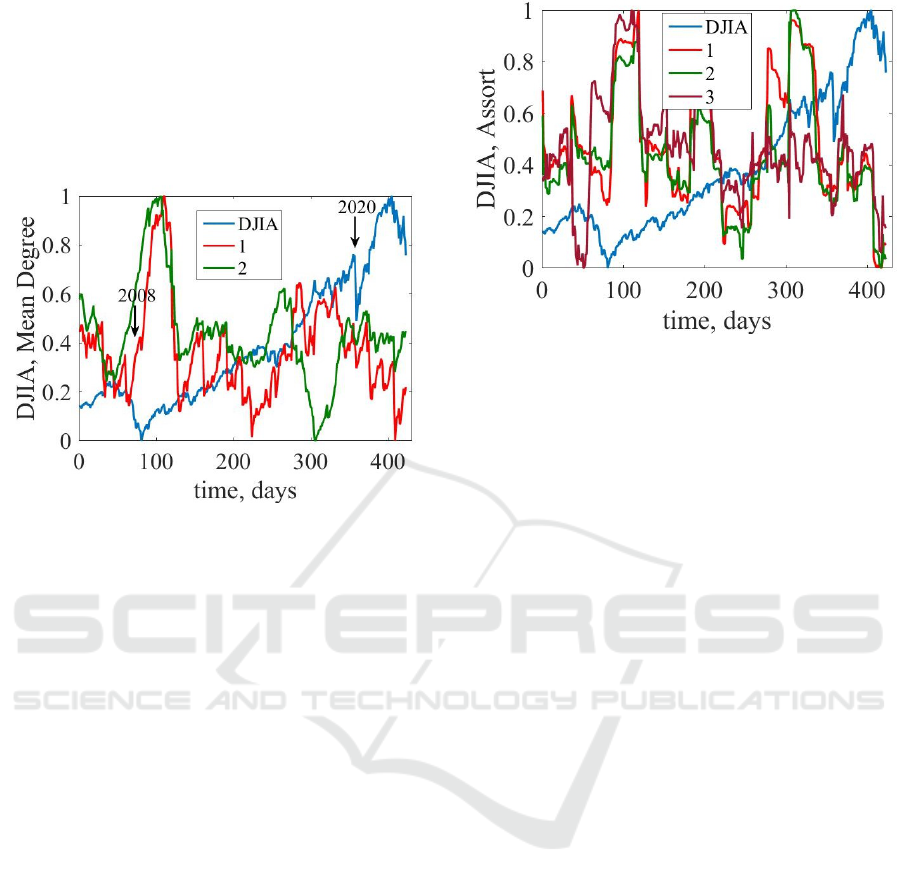
Figure 7 demonstrates the dynamics of mean
weighted degree (equation (15)) for order 1 and 2
along with the DJIA index.
Figure 7: The dynamics of first- and second-order mean
(weighted) degree along with the DJIA index.
In figure 7 we can see that the second-order D
mean
is slightly different from the first-order one. The
second-order D
mean
starts to increase a slightly ear-
lier before the crisis of 2008. We can see that before
crisis of 2020 second-order D
mean
declines more no-
ticeably comparing to the first-order one. However,
this difference between the first and second order is
still insignificant, what can we say about the fact that
the classical visibility graph can reflect all the infor-
mation that the series under study can represent.
Next, let us present high-order dynamics of the
assortativity coefficient for the DJIA index (see fig-
ure 8).
Figure 8 presents the assortativity coefficient for
first, second, and third orders. Assortativity declines
before crashes and increases during them. We see that
high-orderness does not change radically change the
dynamics of this indicator. Third-order assortativity
responds better for the crash of 2008, but worse for
the COVID-19 crisis, comparing to first- and second-
order assortativity.
6 CONCLUSIONS
In this article, we have presented methods to mea-
sure and model systems with casual, multiplex, and
high-order interactions. From our analysis, we have
found that typically non-Markovian, non-stationary,
Figure 8: The dynamics of first-, second-, and third-order
assortativity along with the DJIA index.
non-linear systems are characterized by long-range
spatio-temporal correlations which are better de-
scribed by the high-order paradigm. Typically, high-
order connectivity is described in terms of hyper-
graphs (Sch
¨
olkopf et al., 2007; de Arruda et al., 2020;
Carletti et al., 2020) or simplicial complexes (Schaub
et al., 2020; Torres and Bianconi, 2020; Skardal and
Arenas, 2020). Such richer types of links bring new
possibilities to go beyond typical nodes and encode
into one node edges, triangles, tetrahedra, etc. to in-
vestigate higher-order clusters and temporal depen-
dencies.
We have presented indicators (indicators-
precursors) based on classic visibility graphs,
multiplex networks, and high-order networks. In
this study we have used such network measures
as the mean degree of a node D
mean
, first-moment
degree (mean weighted degree) of a network, assor-
tativity coefficient, inter-layer mutual information I,
multiplex degree entropy S, and mean overlapping
degree of a network o. We have constructed the
visibility graph relying on the time series of the
Dow Jones Industrial Average (DJIA) index. We
have studied multiplex network dynamics using a
database that consists of 6 of the most developed
and capitalized stock indices of different countries
and which include companies from different sectors.
We have chosen the period from 02.01.2004 to
18.10.2022. Each indicator was calculated using
the sliding window algorithm. We have shown that
multiplex and high-order networks do not substan-
tially differ dynamically from the traditional pairwise
visibility model. This may indicate that the classical
visibility graph reflects all possible short-term and
long-term dependencies in the values of the DJIA
index. All the presented measures work similarly,
like indicators (indicators-precursors) of critical
M3E2 2022 - International Conference on Monitoring, Modeling Management of Emergent Economy
140

financial events, increasing or decreasing before and
during them. Although multiplex and high-order
network indicators give promising results, it still
needs further development and improvements for
studying complex financial time series. The solution
may lie in the framework that combines Markov
chains of multiple, higher orders into a multi-layer
graphical model that captures temporal correlations
in pathways at multiple length scales simultaneously
(Scholtes, 2017). Another perspective lies in the use
of neuro-fuzzy forecasting and clustering methods of
complex financial systems (Bielinskyi et al., 2021a;
Bondarenko, 2021; Kmytiuk and Majore, 2021;
Kobets and Novak, 2021; Kucherova et al., 2021;
Lukianenko and Strelchenko, 2021; Miroshnychenko
et al., 2021).
ACKNOWLEDGMENTS
This work was supported by the Ministry of
Education and Science of Ukraine (project
No. 0122U001694).
REFERENCES
Aldasoro, I. and Alves, I. (2018). Multiplex interbank net-
works and systemic importance: An application to eu-
ropean data. Journal of Financial Stability, 35:17–37.
https://doi.org/10.1016/j.jfs.2016.12.008.
Aroussi, R. (2022). Yahoo! Finance API. https://github.
com/ranaroussi/yfinance.
Barab
´
asi, A.-L. and P
´
osfai, M. (2016). Network science.
Cambridge University Press, Cambridge, 1st edition.
http://barabasi.com/networksciencebook/.
Bardoscia, M., Barucca, P., Battiston, S., Caccioli, F., Ci-
mini, G., Garlaschelli, D., Saracco, F., Squartini, T.,
and Caldarelli, G. (2021). The physics of financial
networks. Nature Reviews Physics, 3(7):490–507.
https://doi.org/10.1038%2Fs42254-021-00322-5.
Bartesaghi, P., Clemente, G. P., and Grassi, R. (2022). A
tensor-based unified approach for clustering coeffi-
cients in financial multiplex networks. Information
Sciences, 601:268–286. https://doi.org/10.1016/j.ins.
2022.04.021.
Battiston, F., Amico, E., Barrat, A., Bianconi, G., de Ar-
ruda, G. F., Franceschiello, B., Iacopini, I., K
´
efi, S.,
Latora, V., Moreno, Y., Murray, M. M., Peixoto, T. P.,
Vaccarino, F., and Petri, G. (2021). The physics of
higher-order interactions in complex systems. Nature
Physics, 17(10):1093–1098. https://doi.org/10.1038%
2Fs41567-021-01371-4.
Battiston, F., Cencetti, G., Iacopini, I., Latora, V., Lucas,
M., Patania, A., Young, J.-G., and Petri, G. (2020).
Networks beyond pairwise interactions: Structure and
dynamics. Physics Reports, 874:1–92. https://doi.org/
10.1016/j.physrep.2020.05.004.
Battiston, F. and Petri, G., editors (2022). Higher-Order
Systems (Understanding Complex Systems). Springer
International Publishing, 1st edition. https://doi.org/
10.1007%2F978-3-030-91374-8.
Battiston, S., Caldarelli, G., May, R. M., Roukny, T.,
and Stiglitz, J. E. (2016). The price of complexity
in financial networks. Proceedings of the National
Academy of Sciences, 113(36):10031–10036. https:
//www.pnas.org/doi/abs/10.1073/pnas.1521573113.
Benson, A. R., Abebe, R., Schaub, M. T., Jadbabaie,
A., and Kleinberg, J. (2018). Simplicial closure
and higher-order link prediction. Proceedings of
the National Academy of Sciences, 115(48):E11221–
E11230. https://www.pnas.org/doi/abs/10.1073/pnas.
1800683115.
Berge, C. (1976). Graphs and Hypergraphs. North-Holland
mathematical library. North-Holland Publishing
Company. http://compalg.inf.elte.hu/
∼
tony/Oktatas/
Algoritmusok-hatekonysaga/Berge-hypergraphs.pdf.
Bick, C., Gross, E., Harrington, H. A., and Schaub, M. T.
(2021). What are higher-order networks? https:
//arxiv.org/abs/2104.11329.
Bielinskyi, A., Semerikov, S., Serdyuk, O., Solovieva, V.,
Soloviev, V. N., and Pichl, L. (2020). Econophysics
of sustainability indices. In Kiv, A., editor, Proceed-
ings of the Selected Papers of the Special Edition of
International Conference on Monitoring, Modeling &
Management of Emergent Economy (M3E2-MLPEED
2020), Odessa, Ukraine, July 13-18, 2020, volume
2713 of CEUR Workshop Proceedings, pages 372–
392. CEUR-WS.org. https://ceur-ws.org/Vol-2713/
paper41.pdf.
Bielinskyi, A., Soloviev, V., Semerikov, S., and Solovieva,
V. (2021a). Identifying stock market crashes by fuzzy
measures of complexity. Neiro-Nechitki Tekhnolohii
Modelyuvannya v Ekonomitsi, 2021(10):3–45. https:
//doi.org/10.33111/nfmte.2021.003.
Bielinskyi, A. O., Hushko, S. V., Matviychuk, A. V.,
Serdyuk, O. A., Semerikov, S. O., and Soloviev, V. N.
(2021b). Irreversibility of financial time series: a case
of crisis. In Kiv, A. E., Soloviev, V. N., and Se-
merikov, S. O., editors, Proceedings of the Selected
and Revised Papers of 9th International Conference
on Monitoring, Modeling & Management of Emergent
Economy (M3E2-MLPEED 2021), Odessa, Ukraine,
May 26-28, 2021, volume 3048 of CEUR Workshop
Proceedings, pages 134–150. CEUR-WS.org. https:
//ceur-ws.org/Vol-3048/paper04.pdf.
Bielinskyi, A. O., Matviychuk, A. V., Serdyuk, O. A.,
Semerikov, S. O., Solovieva, V. V., and Soloviev,
V. N. (2022). Correlational and non-extensive na-
ture of carbon dioxide pricing market. In Ignatenko,
O., Kharchenko, V., Kobets, V., Kravtsov, H., Tara-
sich, Y., Ermolayev, V., Esteban, D., Yakovyna, V.,
and Spivakovsky, A., editors, ICTERI 2021 Work-
shops, volume 1635 CCIS of Communications in
Computer and Information Science, pages 183–199,
Cham. Springer International Publishing. https://doi.
org/10.1007/978-3-031-14841-5 12.
High-Order Networks and Stock Market Crashes
141

Bielinskyi, A. O., Serdyuk, O. A., Semerikov, S. O., and
Soloviev, V. N. (2021c). Econophysics of cryptocur-
rency crashes: a systematic review. In Kiv, A. E.,
Soloviev, V. N., and Semerikov, S. O., editors, Pro-
ceedings of the Selected and Revised Papers of 9th
International Conference on Monitoring, Modeling &
Management of Emergent Economy (M3E2-MLPEED
2021), Odessa, Ukraine, May 26-28, 2021, volume
3048 of CEUR Workshop Proceedings, pages 31–
133. CEUR-WS.org. https://ceur-ws.org/Vol-3048/
paper03.pdf.
Bielinskyi, A. O. and Soloviev, V. N. (2018). Complex
network precursors of crashes and critical events in
the cryptocurrency market. CEUR Workshop Pro-
ceedings, 2292:37 – 45. https://ceur-ws.org/Vol-2292/
paper02.pdf.
Bobrowski, O. and Krioukov, D. (2022). Random sim-
plicial complexes: Models and phenomena. In Un-
derstanding Complex Systems, pages 59–96. Springer
International Publishing. https://doi.org/10.1007%
2F978-3-030-91374-8 2.
Boccaletti, S., Bianconi, G., Criado, R., del Genio, C.,
G
´
omez-Garde
˜
nes, J., Romance, M., Sendi
˜
na-Nadal,
I., Wang, Z., and Zanin, M. (2014). The struc-
ture and dynamics of multilayer networks. Physics
Reports, 544(1):1–122. https://doi.org/10.1016/j.
physrep.2014.07.001.
Bondarenko, M. (2021). Modeling relation between at-
the-money local volatility and realized volatility of
stocks. Neiro-Nechitki Tekhnolohii Modelyuvannya
v Ekonomitsi, 2021(10):46–66. https://doi.org/10.
33111/nfmte.2021.046.
Brummitt, C. D. and Kobayashi, T. (2015). Cascades in
multiplex financial networks with debts of different
seniority. Phys. Rev. E, 91:062813. https://link.aps.
org/doi/10.1103/PhysRevE.91.062813.
Cao, J., Wen, F., Stanley, H. E., and Wang, X. (2021). Mul-
tilayer financial networks and systemic importance:
Evidence from china. International Review of Finan-
cial Analysis, 78:101882. https://doi.org/10.1016/j.
irfa.2021.101882.
Carletti, T., Battiston, F., Cencetti, G., and Fanelli, D.
(2020). Random walks on hypergraphs. Phys.
Rev. E, 101:022308. https://link.aps.org/doi/10.1103/
PhysRevE.101.022308.
de Arruda, G. F., Petri, G., and Moreno, Y. (2020).
Social contagion models on hypergraphs. Phys.
Rev. Res., 2:023032. https://link.aps.org/doi/10.1103/
PhysRevResearch.2.023032.
De Bruijn, N. G. (1946). A combinatorial problem. Pro-
ceedings of the Section of Sciences of the Koninklijke
Nederlandse Akademie van Wetenschappen te Amster-
dam, 49(7):758–764.
del Rio-Chanona, R. M., Korniyenko, Y., Patnam, M., and
Porter, M. A. (2020). The multiplex nature of global
financial contagions. Applied Network Science, 5(1).
https://doi.org/10.1007%2Fs41109-020-00301-2.
Franch, F., Nocciola, L., and Vouldis, A. (2022). Temporal
networks in the analysis of financial contagion. SSRN
Electronic Journal. https://doi.org/10.2139%2Fssrn.
4125870.
Gao, Q. (2022). Systemic risk analysis of multi-layer fi-
nancial network system based on multiple intercon-
nections between banks, firms, and assets. Entropy,
24(9):1252. https://doi.org/10.3390%2Fe24091252.
Han, B., Wei, Y., Kang, L., Wang, Q., and Yang, Y. (2022).
Node classification in attributed multiplex networks
using random walk and graph convolutional networks.
Frontiers in Physics, 9. https://www.frontiersin.org/
articles/10.3389/fphy.2021.763904.
Holme, P. and Saram
¨
aki, J. (2012). Temporal networks.
Physics Reports, 519(3):97–125. https://doi.org/10.
1016/j.physrep.2012.03.001.
Huremovic, K., Jim
´
enez, G., Moral-Benito, E., Peydr
´
o,
J.-L., and Vega-Redondo, F. (2020). Production
and Financial Networks in Interplay: Crisis Ev-
idence from Supplier-Customer and Credit Regis-
ters. Working Papers 1191, Barcelona School of
Economics. https://papers.ssrn.com/sol3/papers.cfm?
abstract id=3696358.
Iacovacci, J. and Lacasa, L. (2016). Sequential motif profile
of natural visibility graphs. Phys. Rev. E, 94:052309.
https://doi.org/10.1103/PhysRevE.94.052309.
Jackson, M. O. and Pernoud, A. (2021). Systemic risk
in financial networks: A survey. Annual Review of
Economics, 13(1):171–202. https://doi.org/10.1146/
annurev-economics-083120-111540.
Kempe, D., Kleinberg, J., and Kumar, A. (2002). Connec-
tivity and inference problems for temporal networks.
Journal of Computer and System Sciences, 64(4):820–
842. https://doi.org/10.1006/jcss.2002.1829.
Kiv, A. E., Soloviev, V. N., Semerikov, S. O., Danylchuk,
H. B., Kibalnyk, L. O., Matviychuk, A. V., and
Striuk, A. M. (2021). Machine learning for pre-
diction of emergent economy dynamics III. In Kiv,
A. E., Soloviev, V. N., and Semerikov, S. O., edi-
tors, Proceedings of the Selected and Revised Papers
of 9th International Conference on Monitoring, Mod-
eling & Management of Emergent Economy (M3E2-
MLPEED 2021), Odessa, Ukraine, May 26-28, 2021,
volume 3048 of CEUR Workshop Proceedings, pages
i–xxxi. CEUR-WS.org. https://ceur-ws.org/Vol-3048/
paper00.pdf.
Kivel
¨
a, M., Arenas, A., Barthelemy, M., Gleeson, J. P.,
Moreno, Y., and Porter, M. A. (2014). Multilayer net-
works. Journal of Complex Networks, 2(3):203–271.
https://doi.org/10.1093/comnet/cnu016.
Kmytiuk, T. and Majore, G. (2021). Time series forecasting
of agricultural product prices using Elman and Jordan
recurrent neural networks. Neiro-Nechitki Tekhnolohii
Modelyuvannya v Ekonomitsi, 2021(10):67–85. https:
//doi.org/10.33111/nfmte.2021.067.
Kobets, V. and Novak, O. (2021). EU countries clustering
for the state of food security using machine learning
techniques. Neiro-Nechitki Tekhnolohii Modelyuvan-
nya v Ekonomitsi, 2021(10):86–118. https://doi.org/
10.33111/nfmte.2021.086.
Komodakis, N. and Paragios, N. (2009). Beyond pair-
wise energies: Efficient optimization for higher-order
mrfs. In 2009 IEEE Conference on Computer Vision
and Pattern Recognition, pages 2985–2992. https:
//doi.org/10.1109/CVPR.2009.5206846.
M3E2 2022 - International Conference on Monitoring, Modeling Management of Emergent Economy
142

Kucherova, H., Honcharenko, Y., Ocheretin, D., and Bil-
ska, O. (2021). Fuzzy logic model of usability of
websites of higher education institutions in the con-
text of digitalization of educational services. Neiro-
Nechitki Tekhnolohii Modelyuvannya v Ekonomitsi,
2021(10):119–135. https://doi.org/10.33111/nfmte.
2021.119.
Lacasa, L., Luque, B., Ballesteros, F., Luque, J., and
Nu
˜
no, J. C. (2008). From time series to complex
networks: The visibility graph. Proceedings of the
National Academy of Sciences, 105(13):4972–4975.
https://doi.org/10.1073%2Fpnas.0709247105.
Lacasa, L., Nicosia, V., and Latora, V. (2015). Network
structure of multivariate time series. Scientific Re-
ports, 5(1). https://doi.org/10.1038%2Fsrep15508.
Lambiotte, R., Rosvall, M., and Scholtes, I. (2019). From
networks to optimal higher-order models of complex
systems. Nat. Phys., 15:313–320. https://doi.org/10.
1038/s41567-019-0459-y.
Latora, V., Nicosia, V., and Russo, G. (2017). Complex Net-
works: Principles, Methods and Applications. Cam-
bridge University Press, USA, 1st edition. http://www.
complex-networks.net.
Lukianenko, D. and Strelchenko, I. (2021). Neuromodel-
ing of features of crisis contagion on financial mar-
kets between countries with different levels of eco-
nomic development. Neiro-Nechitki Tekhnolohii Mod-
elyuvannya v Ekonomitsi, 2021(10):136–163. https:
//doi.org/10.33111/nfmte.2021.136.
Luque, B., Lacasa, L., Ballesteros, F., and Luque, J. (2009).
Horizontal visibility graphs: Exact results for random
time series. Phys. Rev. E, 80:046103. https://link.aps.
org/doi/10.1103/PhysRevE.80.046103.
Lyra, M. L. and Tsallis, C. (1998). Nonextensivity and mul-
tifractality in low-dimensional dissipative systems.
Phys. Rev. Lett., 80:53–56. https://link.aps.org/doi/10.
1103/PhysRevLett.80.53.
Majhi, S., Perc, M., and Ghosh, D. (2022). Dynamics
on higher-order networks: a review. Journal of
The Royal Society Interface, 19(188):20220043.
https://royalsocietypublishing.org/doi/abs/10.1098/
rsif.2022.0043.
Masuda, N., Porter, M. A., and Lambiotte, R. (2017).
Random walks and diffusion on networks. Physics
Reports, 716-717:1–58. https://doi.org/10.1016/j.
physrep.2017.07.007.
Miroshnychenko, I., Kravchenko, T., and Drobyna, Y.
(2021). Forecasting electricity generation from re-
newable sources in developing countries (on the ex-
ample of Ukraine). Neiro-Nechitki Tekhnolohii Mod-
elyuvannya v Ekonomitsi, 2021(10):164–198. https:
//doi.org/10.33111/nfmte.2021.164.
Newman, M. E. J. (2010). Networks: an introduction. Ox-
ford University Press, Oxford; New York, 2nd edition.
Pan, R. K. and Saram
¨
aki, J. (2011). Path lengths, corre-
lations, and centrality in temporal networks. Phys.
Rev. E, 84:016105. https://link.aps.org/doi/10.1103/
PhysRevE.84.016105.
Saha, S., Gao, J., and Gerlach, R. (2022). A survey of the
application of graph-based approaches in stock market
analysis and prediction. International Journal of Data
Science and Analytics, 14(1):1–15. https://doi.org/10.
1007%2Fs41060-021-00306-9.
Santoro, A., Battiston, F., Petri, G., and Amico, E. (2022).
Unveiling the higher-order organization of multivari-
ate time series. https://arxiv.org/abs/2203.10702.
Schaub, M. T., Benson, A. R., Horn, P., Lippner, G., and
Jadbabaie, A. (2020). Random walks on simpli-
cial complexes and the normalized hodge 1-laplacian.
SIAM Review, 62(2):353–391. https://doi.org/10.
1137/18M1201019.
Scholtes, I. (2017). When is a network a network?
multi-order graphical model selection in pathways
and temporal networks. In Proceedings of the
23rd ACM SIGKDD International Conference on
Knowledge Discovery and Data Mining, KDD ’17,
page 1037–1046, New York, NY, USA. Association
for Computing Machinery. https://doi.org/10.1145/
3097983.3098145.
Scholtes, I., Wider, N., and Garas, A. (2016). Higher-order
aggregate networks in the analysis of temporal net-
works: path structures and centralities. The European
Physical Journal B, 89(3). https://doi.org/10.1140%
2Fepjb%2Fe2016-60663-0.
Sch
¨
olkopf, B., Platt, J., and Hofmann, T. (2007). Learning
with hypergraphs: Clustering, classification, and em-
bedding. In Advances in Neural Information Process-
ing Systems 19: Proceedings of the 2006 Conference,
pages 1601–1608. MIT Press.
Serguieva, A. (2016). Multichannel contagion vs stabil-
isation in multiple interconnected financial markets.
SSRN Electronic Journal. https://doi.org/10.2139%
2Fssrn.2904431.
Shemesh, Y., Sztainberg, Y., Forkosh, O., Shlapobersky, T.,
Chen, A., and Schneidman, E. (2013). High-order so-
cial interactions in groups of mice. eLife, 2:e00759.
https://doi.org/10.7554/eLife.00759.
Skardal, P. S. and Arenas, A. (2020). Higher order in-
teractions in complex networks of phase oscillators
promote abrupt synchronization switching. Com-
munications Physics, 3(1). https://doi.org/10.1038%
2Fs42005-020-00485-0.
Skardal, P. S., Arola-Fern
´
andez, L., Taylor, D., and
Arenas, A. (2021). Higher-order interactions can
better optimize network synchronization. Phys.
Rev. Res., 3:043193. https://link.aps.org/doi/10.1103/
PhysRevResearch.3.043193.
Soloviev, V. N., Bielinskyi, A. O., and Kharadzjan, N. A.
(2020). Coverage of the coronavirus pandemic
through entropy measures. CEUR Workshop Pro-
ceedings, 2832:24 – 42. https://ceur-ws.org/Vol-2832/
paper02.pdf.
Squartini, T., Gabrielli, A., Garlaschelli, D., Gili, T., Bi-
fone, A., and Caccioli, F. (2018). Complexity in
neural and financial systems: From time-series to
networks. Complexity, 2018:13. https://doi.org/10.
1155%2F2018%2F3132940.
Stavroglou, S. K., Pantelous, A. A., Stanley, H. E., and
Zuev, K. M. (2019). Hidden interactions in financial
markets. Proceedings of the National Academy of Sci-
High-Order Networks and Stock Market Crashes
143

ences, 116(22):10646–10651. https://www.pnas.org/
doi/abs/10.1073/pnas.1819449116.
Sun, H. and Bianconi, G. (2021). Higher-order percolation
processes on multiplex hypergraphs. Physical Review
E, 104(3). https://doi.org/10.1103%2Fphysreve.104.
034306.
Torres, J. J. and Bianconi, G. (2020). Simplicial com-
plexes: higher-order spectral dimension and dynam-
ics. Journal of Physics: Complexity, 1(1):015002.
https://dx.doi.org/10.1088/2632-072X/ab82f5.
Wasserman, L. (2018). Topological data analy-
sis. Annual Review of Statistics and Its Ap-
plication, 5(1):501–532. https://doi.org/10.1146/
annurev-statistics-031017-100045.
Xie, Y., Jiao, F., Li, S., Liu, Q., and Tse, Y. (2022). Systemic
risk in financial institutions: A multiplex network ap-
proach. Pacific-Basin Finance Journal, 73:101752.
https://doi.org/10.1016/j.pacfin.2022.101752.
M3E2 2022 - International Conference on Monitoring, Modeling Management of Emergent Economy
144
