
User Requirements of Audio and Video Products with
Pan-Knowledge Based on Kano Model
Ye Wang and Fei Wang
*
School of Management, Guangzhou Xinhua University, Tianhe District, Guangzhou, China
Keywords: Pan-Knowledge, Knowledge Payment, Product Research, User Requirements Analysis, The Kano Model.
Abstract: With the in-depth development of Internet information technology, the knowledge payment market has been
booming since 2016 in China. The pan-knowledge audio and video products with a wider range than
traditional online education products are popular among users. Pan-knowledge learning has also become a
new learning mode with the rise of the Internet. Based on the pan-knowledge audio and video products as the
research object, by using the Kano model to analyze the user requirements of this kind of products, we find
the audio and video products of pan-knowledge with the following features can be more competitive: unusual
theme, summary of the products, providing graphic pages and annotations. The products with editing
professionally improve let the user satisfaction.
1 INTRODUCTION
According to the "China Sharing Economy
Development Report (2022)", the market transaction
scale of China's sharing economy reached 3 trillion
yuan in 2021. The sharing economy in the knowledge
and skill sector developed rapidly, with the
transaction scale growing by 13.2% year on year.
With the slowdown in the growth of the scale of
Internet users, high-quality content resources such as
knowledge and skills have become a new focus of
commercial competition, as it can stimulate the
degree of activity and conversion rate of existing
users. Internet digital content in the field of
knowledge and skills is called pan-knowledge
content, which is different from traditional online
education because it has a broader scope. In addition
to knowledge products such as online education, it
also includes knowledge sharing products to improve
personal literacy, such as career experience, life
skills, philosophy and literature. Pan-knowledge
learning has also become a new learning model with
the rise of online knowledge sharing. Pan-knowledge
audio and video products have become an important
part of digital content products. Audio and video
platform enterprises hope to have high-quality
original content products. Therefore, it is of practical
significance to study the user requirements of pan-
knowledge audio and video products.
2 LITERATURE REVIEW
2.1 Pan-Knowledge
Pan-knowledge learning is usually mediated by
platforms such as TikTok, Iget and Himalaya. Users
select the audio or video products that they are
interested in on these platforms. Knowledge bloggers
produce pan-knowledge-themed audio and video
content on Internet platforms, and gain attention or
profits by sharing and disseminating these digital
content products. The high-quality original digital
content attracts users who have knowledge needs to
make payment for knowledge, which is called
knowledge payment. After comparing and analyzing
the three existing business models of knowledge
payment, Jinzhuo Ma put forward that richer content
services and cost-effective pan-knowledge payment
will be the new trend (Ma 2018).
2.2 Kano Model
Under the influence of Herzberg's two-factor theory,
Professor Noriaki Kano, a Japanese scholar, proposed
the Kano model in the 1980s, which introduced the
criteria of satisfaction and dissatisfaction into the
field of product quality management for the first time.
It is an analytical method to distinguish and rank user
requirements. As shown in Table 1, the model divides
Wang, Y. and Wang, F.
User Requirements of Audio and Video Products with Pan-Knowledge Based on Kano Model.
DOI: 10.5220/0011934800003613
In Proceedings of the 2nd International Conference on New Media Development and Modernized Education (NMDME 2022), pages 603-608
ISBN: 978-989-758-630-9
Copyright
c
2023 by SCITEPRESS – Science and Technology Publications, Lda. Under CC license (CC BY-NC-ND 4.0)
603
the elements of product or service into five features,
namely, the essential feature M, the desired feature O,
the attractive feature A, the indifference feature I and
the reverse feature R. For different features, the
research aims to improve their satisfaction, so as to
provide reference and suggestions for product
research.
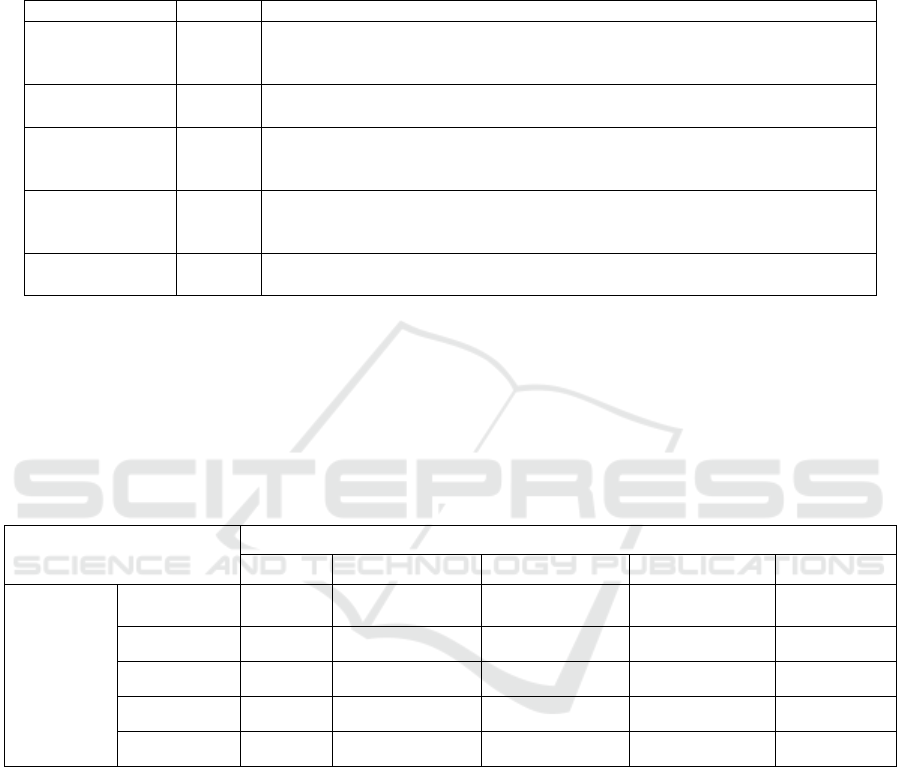
Table 1: Product features of Kano model
Features Code Meanin
g
Attractive feature A
If such features are not provided, user satisfaction will not be reduced, but when
such features are provided, satisfaction will be greatly improved, sometimes as a
guarantee that the product is competitive.
Expected feature O
User satisfaction increases when such features are provided and decreases when
the
y
are not.
Essential feature M
When such functions are provided, user satisfaction will not be significantly
improved, but when such functions are not provided, the satisfaction will be greatly
reduced, which is a basic requirement that must be guaranteed.
Indifference
Feature
I
That is, there is no significant change in user satisfaction with or without such
functionality. Under limited conditions, such functionality may not be provided as
a priority.
Reverse Feature R
That is, users do not have this function, if provided, it will lead to a decline in
satisfaction.
In general, the priority of product features is:
required feature M> desired feature O> attractive
feature A> indifference feature I, and reverse feature
R is not necessary to develop.
The Kano model measures different features
through the scales in the structured questionnaire. In
the scale, each feature is asked by positive and
negative questions, and the options are set according
to whether it is satisfied or not. The respondents have
five options to choose, specifically: dislike, tolerable,
whatever, necessary and like. Each option was given
a corresponding score from 1 to 5 to explore the
responses of respondents with and without the five
features (Table 2).
Table 2: Schematic design of Kano model questionnaire
Negative question
Like (5) necessary (4) Whatever (3) Tolerable (2) Dislike (1)
Positive
question
Like
(5)
Q A A A O
necessary (4) R I I I M
Whatever (3) R I I I M
Tolerable (2) R I I I M
Dislike (1) R R R R Q
A stand for attractive feature; O for desired
characteristic; M for required feature; I for
indifference feature; R is for the reverse
characteristic; Q is for question results, which means
respondents do not understand or answered
incorrectly.
The Kano model tells us: Firstly, not all of product
features are related to user satisfaction, and some
features are not. Secondly, the required features
cannot improve user satisfaction, which is just the
basic needs of users. If the basic needs are not met,
the satisfaction will be reduced. Thirdly, the
improvement of desired features and attractive
features can effectively improve user satisfaction,
which is also a key attribute to optimize the user
experience of a product.
3 RESEARCH DESIGN
3.1 KANO Questionnaire Design
In the questionnaire, the features of universal
knowledge audio and video products were used as
variable indexes, and the positive and negative
aspects of each feature were questioned (Table 3).The
actual questionnaire consists of two parts: one is the
NMDME 2022 - The International Conference on New Media Development and Modernized Education
604
basic information of the respondents, including four
basic questions: gender, age, education background
and occupation; the second part is the core part of
Kano questionnaire, which contains 4 screening
questions and 26 positive/negative questions.
Table 3: Examples of forward and reverse questions
How would you feel if a pan-knowledge audio and
video
p
roduct had the followin
g
features?
Positive question
Providing references
Background music
Answer options (points)
Like (5 points)
Necessary (4 points)
Whatever (3 points)
Tolerable (2 points)
Dislike (1 point)
Negative question
No references are
provided
No background music
3.2 Kano Scale Design
Referring to the research of many scholars, this paper
proposes four first-level indicators of content feature,
presentation feature, interaction feature and service
feature, and 13 second-level indicators (Table 4).
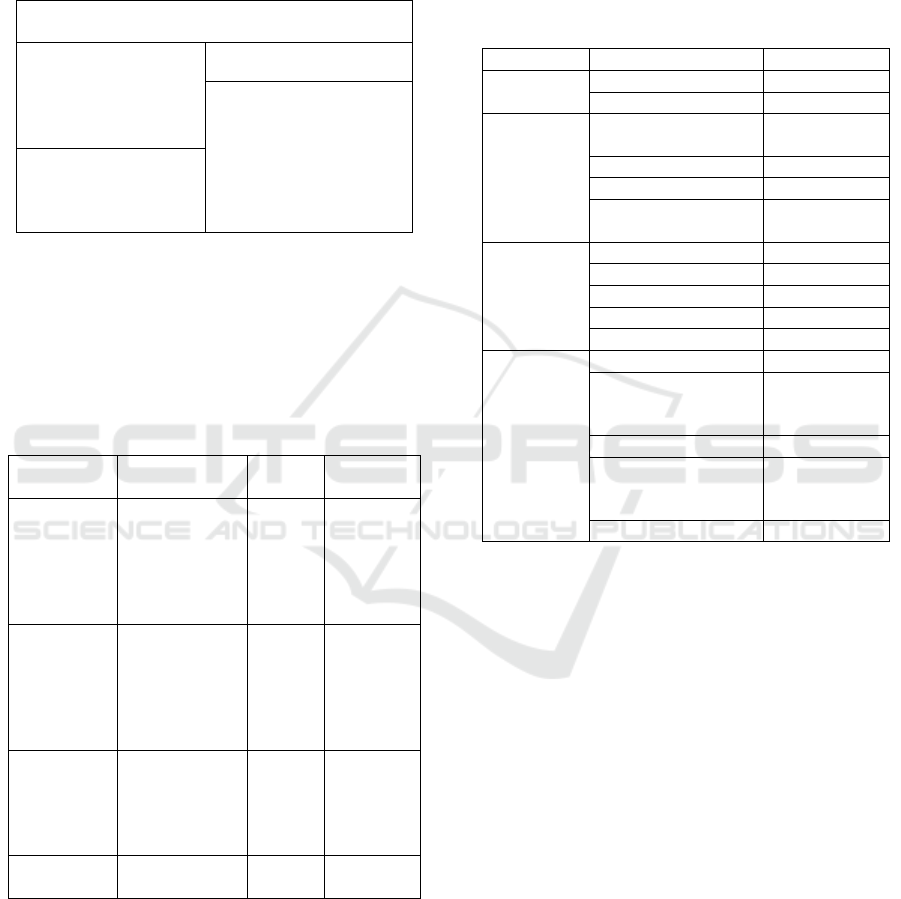
Table 4:Variable indicators of the characteristics
First Level
indicators
Second level
indicators
Index
sign
Index
source
content
unusual theme
summary
references
graphic pages
5 minutes or
less
A1
A2
A3
A4
A5
Qian-min
Wang
2018
Dai-li
Wang
2021
presentation
background
music
visual effects
editing
professionally
B1
B2
B3
Duan
2021
interaction
annotation
tool
notes
interactive
discuss
C1
C2
C3
Liu 2019
service
ratings
share
D1
D2
Bai el.
2019
4 DATA ANALYSIS
4.1 Descriptive Statistical Analysis
In order to ensure the accuracy and objectivity of the
data, we distributed questionnaires to people who
used and had access to the knowledge sharing
platform, such as students and employees, and finally
171 valid questionnaires were collected. As shown in
Table 5, data such as age, occupation and educational
background were consistent with the user portrait of
the knowledge share platform.
Table 5:Demographic characteristics of respondents
Variable Cat e
g
or
y
Percenta
g
e
gender
male 38.60%
female 61.40%
educational
background
high school and
b
elow
1.17%
college degree 1.75%
b
achelor degree 89.47%
master's degree or
above
7.60%
age
18 ~ 24 56.73%
25 to 30 years ol
d
34.50%
31 ~ 40
y
ears ol
d
4.09%
41 to 50
y
ears ol
d
4.09%
A
g
e 51 and olde
r
0.58%
profession
student 27.49%
government civil
servants/institute
staff
4.68%
enter
p
rise em
p
lo
y
ees 48.53%
professional (such as
doctors/teachers,
etc.
)
7.02%
freelance
r
12.28%
4.2 Data Reliability and Validity
Analysis
The reliability and internal consistency of the
questionnaire can be judged only after reliability and
validity analysis of the questionnaire data. The
reliability index is generally tested by Cronbach
Alpha coefficient. When the Cronbach Alpha
coefficient is greater than 0.6, the reliability of the
questionnaire can be judged to be reliable. The KMO
value is generally used as the validity index, and a
KMO value greater than 0.7 indicates that the validity
of the questionnaire is qualified. The online data
analysis platform SPSSPRO is used to analyze the
reliability and validity of the data. As shown in Table
6, Table 7 and Table 8, the Cronbach Alpha
coefficient of positive questions is 0.799, the
Cronbach Alpha coefficient of negative questions is
0.877, and the overall Cronbach Alpha coefficient of
the questionnaire is 0.784, indicating that the internal
consistency of the questionnaire is good. The data are
reliable. As shown in Table 9, Table 10, and Table 11,
User Requirements of Audio and Video Products with Pan-Knowledge Based on Kano Model
605
the KMO value of the positive question is 0.756, the
KMO value of the negative question is 0.874, and the
overall KMO value of the questionnaire is 0.753. The
Bartlett spherical test reaches the significant level (P
<0.001), which meets the requirements of statistical
validity test. This indicates that the reliability and
validity of the Kano questionnaire are good, and the
data can be further analyzed.
Table 6: Reliability analysis of positive questions
Cronbach's
alpha
coefficient
Standardized
Cronbach's α
coefficients
Item Samples
0.799 0.803 13 171
Table 7: Reliability analysis of negative questions
Cronbach's
alpha
coefficient
Standardized
Cronbach's α
coefficients
Item Samples
0.877 0.880 13 171
Table 8: Reliability analysis of the questionnaire
Cronbach's
alpha
coefficient
Standardized
Cronbach's α
coefficients
Item Samples
0.784 0.781 26 171
Table 9: Validity tests for positive questions
Table 10: Validity tests for negative questions
KMO test and Bartlett's test
KMO value 0.874
Bartlett's test for
sphericity
The approximate
chi-s
q
uare
977.824
df 78.000
p
0.000 * * *
Table 11: Overall validity test of the questionnaire
KMO test and Bartlett test
KMO value 0.753
Bartlett's test for
sphericity
The approximate
chi-square
1944.270
df 325.000
p
0.000 * * *
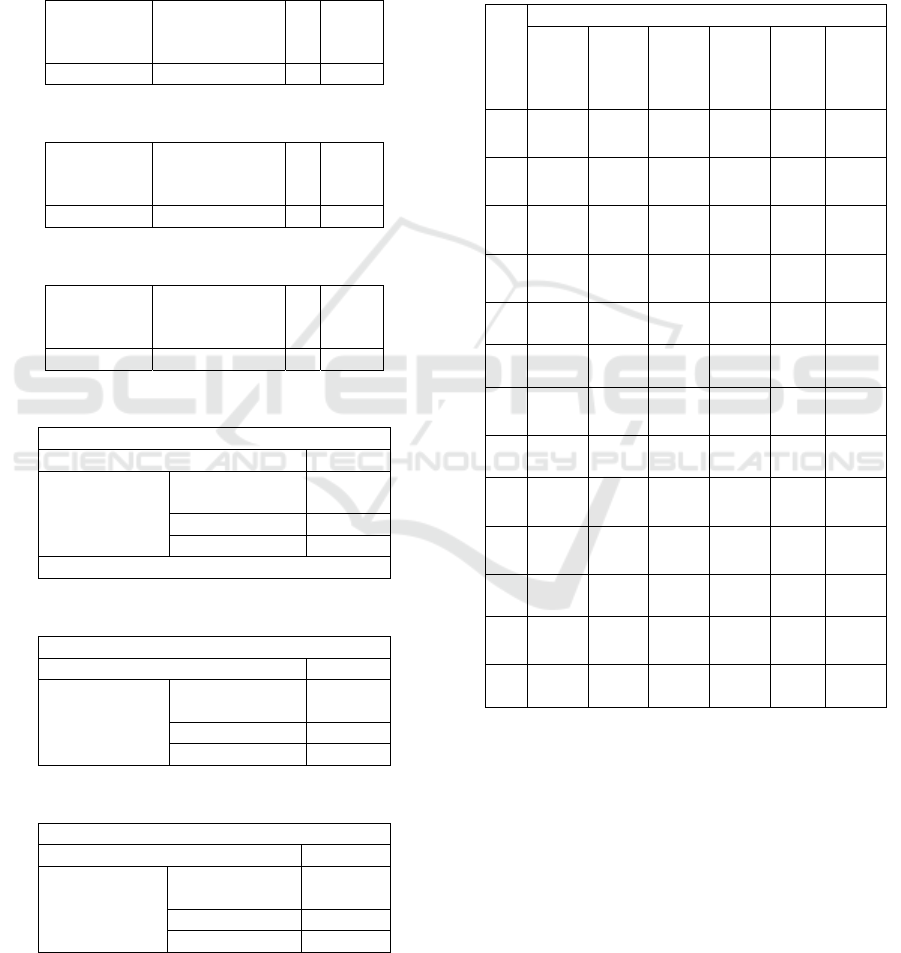
4.3 Kano Model Analysis
According to the analysis of Kano tool provided by
SPSSPRO (Table 12), 10 of the 13 variable indicators
in the questionnaire belong to the indifference
characteristic, two indicators belong to the expected
characteristic, and one indicator belongs to the
attractive characteristic.
Table 12:KANO evaluation Table
in
di
ca
tor
s
Characteristics
A O M I R Q
A
1
33.9
18%
2.92
4%
1.75
4%
25.7
31%
4.67
8%
30.9
94%
A
2
23.3
92%
15.7
89%
16.3
74%
38.5
96%
1.17
%
4.67
8%
A
3
29.2
4%
21.0
53%
9.94
2%
35.0
88%
0.58
5%
4.09
4%
A
4
26.9
01%
30.4
09%
11.1
11%
28.0
7%
0.0
%
3.50
9%
A
5
28.6
55%
10.5
26%
5.84
8%
45.6
14%
5.26
3%
4.09
4%
B
1
26.9
01%
7.01
8%
2.33
9%
52.0
47%
5.84
8%
5.84
8%
B
2
21.6
37%
14.0
35%
8.18
7%
49.1
23%
4.09
4%
2.92
4%
B
3
19.2
98%
31.5
79%
20.4
68%
25.7
31%
0.58
5%
2.33
9%
C
1
30.9
94%
15.7
89%
5.84
8%
42.1
05%
1.17
%
4.09
4%
C
2
35.6
73%
17.5
44%
3.50
9%
40.3
51%
0.58
5%
2.33
9%
C
3
24.5
61%
12.2
81%
2.92
4%
52.6
32%
5.26
3%
2.33
9%
D
1
9.94
2%
4.09
4%
5.26
3%
70.7
6%
5.84
8%
4.09
4%
D
2
26.9
01%
14.6
2%
9.94
2%
45.0
29%
0.58
5%
2.92
4%
4.4 Better - Worse Coefficient
Satisfaction coefficient (Better coefficient)
=(A+O)/(A+O+M+I)
Dissatisfaction coefficient (Worse coefficient)
= -1*(O+M)/(A+O+M+I)
The Better-worse values of each indicator are
calculated by equations and as shown in Table
13. The value of the better coefficient is usually
positive. The larger the positive value or the closer it
is to 1, the stronger the effect of improving user
satisfaction will be, and the faster the satisfaction will
KMO test and Bartlett's test
KMO value 0.756
Bartlett's test for
sphericity
The approximate
chi-square
597.313
df 78.000
p
0.000 * * *
Note: ***re
p
resents the 1% level of si
g
nificance
NMDME 2022 - The International Conference on New Media Development and Modernized Education
606
rise. The worse coefficient is usually negative, with a
smaller negative value or closer to -1 indicating the
greatest impact on user dissatisfaction. The stronger
the effect of decreasing satisfaction, the faster the
decline.
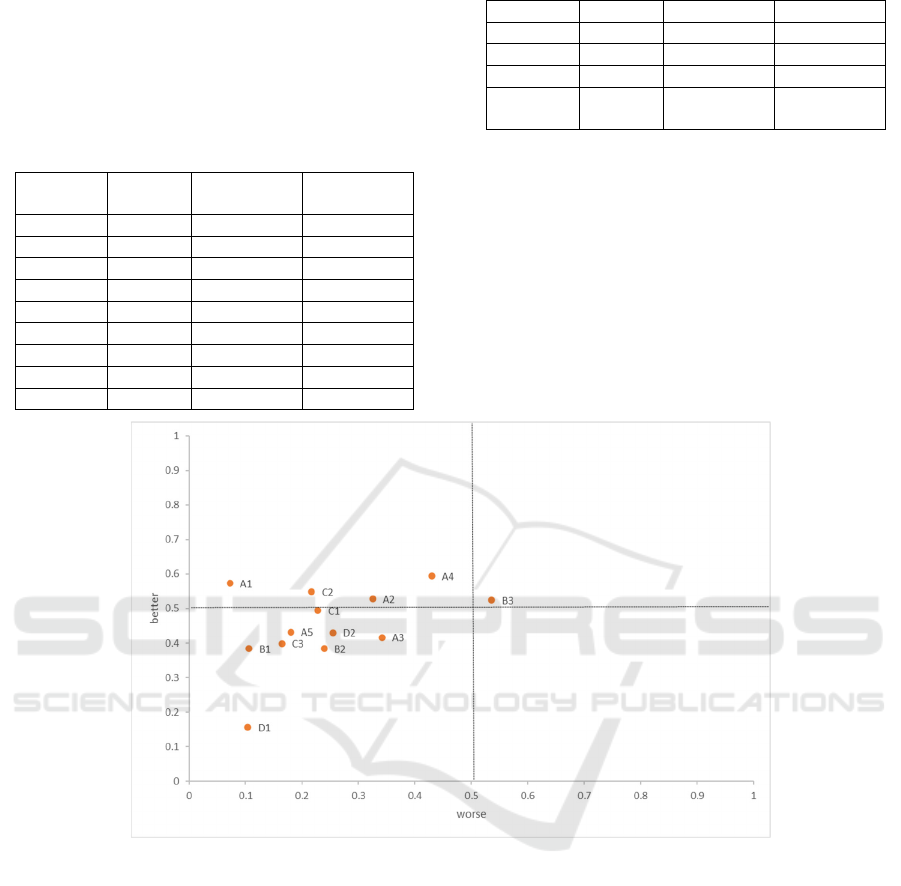
Table 13: Better-Worse coefficient
indicators category Better
coefficient
Worse
coefficient
A1 A 0.5727 0.0727
A2 I 0.5276 0.3252
A3 I 0.4162 0.3416
A4 O 0.5939 0.4303
A5 I 0.4323 0.1807
B1 I 0.3841 0.1060
B2 I 0.3837 0.2390
B3 O 0.5241 0.5361
C1 I 0.4938 0.2284
C2 I 0.5482 0.2169
C3 I 0.3987 0.1646
D1 I 0.1558 0.1039
D2 I 0.4303 0.2545
total
average
0.4509 0.2462
Build a scatter plot corresponding to all the
feature coefficients. Using the absolute value of the
Worse coefficient as the abscissae and the better
coefficient as the ordinate, the scatter plot is divided
into four quadrants, expecting the feature to fall in the
first quadrant (better>0.5, worse>0.5), Attractive
features fall in the second quadrant (better>0.5,
worse<0.5), indifference features fall in the third
quadrant (better<0.5, worse<0.5), and necessary
features fall in the fourth quadrant (better<0.5,
worse>0.5), as shown in Figure 1.
Figure 1: Plot of Better-Worse coefficients
5 CONCLUSIONS
According to the analysis of Kano model, the unusual
theme (A1), introduction or summary (A2), graphic
page (A4), note function (C2) belong to the attractive
feature, and editing professionally(B3) belongs to the
desired feature. Providing reference materials (A3),
within 5 minutes (A5), background music (B1),
visual effects (B2), annotation tools (C1), discussion
(C3), rating and evaluation (D1), and sharing (D2)
belong to the indifference features.
The research results have the following
management implications for audio and video
platforms and bloggers:(1) unusual themes can get
more page views and attention. The platforms can
also recommend products with new themes to users
to gain their attention. Products can be attached with
profiles or summaries to help users match their needs,
enhance user engagement, and improve user loyalty.
At the end of the video, the content can be
summarized in the form of graphic pages to improve
user learning experience. (2) Well-made and vivid
pictures can make products more competitive.
Platform enterprises should avoid the listing of pan-
knowledge audio and video products that are poorly
made when reviewing products, because the
unprofessional products will bring users a sense of
dissatisfaction. (3) The platforms can provide notes
User Requirements of Audio and Video Products with Pan-Knowledge Based on Kano Model
607

and other learning tools for pan-knowledge video
products, which can improve user experience and
highlight the characteristics and competitiveness of
the platforms.
ACKNOWLEDGEMENTS
This paper is supported by Dongguan Social Science
Association under grant No. 2022CG82 and
Department of Education of Guangdong Province
under grant No. 2019J054.
REFERENCES
Dai-li Wang (2021). Research on Influencing Factors of
Satisfaction with knowledge paid Products. Nanchang
University. 63.
Gang-ping Duan (2021). Research on Key Elements of
Learning Experience in Online learning Platform based
on Kano Model. Xiangtan University. 59.
Jin-zhuo Ma (2018). Market status and Business model
analysis of knowledge payment industry. Young
Journalist, 25, 58-59.
Qian Bai, Shu-yu Zhang. Shu-sheng Shen (2019). Demand
analysis of MOOC learning support service based on
Kano model. Modern Distance Education.05, 43-50.
Qian-min Wang (2018). Research on the influence of
perceived quality of online knowledge paid products on
user satisfaction. Nanjing University.
Ying Liu (2019). Research on Influencing factors of user
experience in Knowledge-paid audio Course. Wuhan
University.
NMDME 2022 - The International Conference on New Media Development and Modernized Education
608
