
Analysis of the Factors Affecting Education Expenditure in Sichuan,
China: Based on Grey Correlation Method of Mathematical Model
Xuelian Li and Xuehang Liu
*
Jinjiang College, Sichuan University, Meishan,620860, China
Keywords: Education Expenditure, Grey Correlation Analysis, Correlation Coefficient Mathematical Model.
Abstract: The level of educational investment is one of the important standards to measure a country's civilization and
national quality. The Chinese government's educational expenditure has increased year by year. After 2012,
the proportion of education expenditure in GDP has continued to be more than 4%. Sichuan Province is one
of the big provinces in Western China, and the regional education level and education expenditure are
improving year by year. This paper uses the grey correlation analysis method of evaluation model in
mathematical modeling to build a model, applies the model to calculate the correlation coefficient and
correlation degree of the factors that affect the education expenditure in Sichuan Province, and judges the
importance of each factor. It concludes that the economic development level, industrial structure, population
scale, population structure, urbanization degree, fiscal centralization and decentralization degree, the number
of college graduates have a significant impact on public financial education expenditure.
1 INTRODUCTION
One of the important standards to measure a country's
civilization and national quality is the level of a
country's education input. Adolf Wagner, a famous
German economist, summed up the growth of public
sector expenditure in Europe, the United States and
Japan in the 19th century and concluded that with the
increase of real income, the growth of expenditure on
education and culture in fiscal expenditure would be
faster than the growth of GDP. The main reasons why
the government provides financial expenditure to
develop education are as follows. Education is an
effective means to improve the efficiency of a
country's human capital, it is also an effective way to
achieve fair income distribution. From the financial
practice experience of countries around the world, the
government, especially developing countries, plays
an important role in education. In recent years, the
education expenditure of China accounts for about
16% of the fiscal expenditure and about 4% of GDP.
The practice in China also conforms to this trend.
What are the factors affecting public education
expenditure and how judge the importance of each
influencing factor? Rong Wang and Jianfang Yang
(2008) constructed an econometric model to analyze
the education fiscal expenditure behavior of local
governments in China, taking the economic
development level, industrial structure, population
size and structure, urbanization degree, fiscal
decentralization, etc. as independent variables and the
relative number of public education expenditure as
dependent variables. Wenjun Che (2010) analyzed
the influencing factors of public finance education
expenditure in Guangxi by using grey correlation
analysis. Huitian Bai and Li'an Zhou (2020) draw a
conclusion through mathematical model analysis that
economic decentralization has improved the budget
situation of local governments by promoting the rise
of local industries and the increase of financial
resources. Drawing on the analysis methods of
scholars, this paper analyzes Sichuan public
education expenditure and its influencing factors and
judges the importance of each factor by using the grey
correlation analysis method in the evaluation model
of mathematical modeling.
2 METHOD
Grey relation analysis (GRA) is a multi-factor
statistical analysis method. It was proposed by
Chinese scholar Julong Deng in 1982 and received
the attention and support of scholars and experts.
Li, X. and Liu, X.
Analysis of the Factors Affecting Education Expenditure in Sichuan, China: Based on Grey Correlation Method of Mathematical Model.
DOI: 10.5220/0011935100003613
In Proceedings of the 2nd International Conference on New Media Development and Modernized Education (NMDME 2022), pages 609-613
ISBN: 978-989-758-630-9
Copyright
c
2023 by SCITEPRESS – Science and Technology Publications, Lda. Under CC license (CC BY-NC-ND 4.0)
609
Grey correlation analysis is a method to judge the
degree of correlation between factors according to the
similarity of the geometric shapes of the change
curves of various factors. Through the quantitative
analysis of the development trend of the dynamic
process, this method completes the comparison of the
geometric relationship of the relevant statistical data
of the time series in the system, and obtains the grey
correlation degree between the reference series and
the comparison series. The specific calculation steps
are as follows:
2.1 Definite Sequence
Set reference sequence 𝑌
, compare sequence 𝑋
.
t=1,2,3,…,n;i=1,2,3…,m
t indicates different periods and i indicates
different sequences.
2.2 Dimensionless Processing
Since the data in the reference sequence and the
comparison sequence may be affected by different
units to draw correct conclusions, the data are
dimensionless processed. In this paper, the mean
processing method is selected, which divides the
series of data by the mean.
𝑥
=
(1)
t=1,2,3,…,n. i=1,2,3…,m.
𝑋
represents the mean of series i.
2.3 Calculate Correlation Coefficient
𝛿
=
|
|
∙
|
|
|
|
∙
|
|
(2)
t=1,2,3,…,n.i=1,2,3…,m.ρϵ(0,1).
2.4 Calculate Relevance
The correlation degree is the average value of the
correlation coefficient.
τ
=
∙
∑
δ
(3)
2.5 Relevance Ranking
Degree of association to be calculated 𝜏
results are
arranged in ascending order. The larger the
correlation value, the closer the relationship between
the influencing factors.
3 EMPIRICAL ANALYSIS
PROCESS
3.1 Data Indicator Selection
This paper selects Sichuan provincial government's
education expenditure and the influencing factors as
the research object. The data are from Sichuan
statistical yearbook and China Statistical Yearbook
from 2010 to 2020. The paper selects the proportion
of Sichuan provincial government's education
expenditure in the province's fiscal expenditure as the
reference sequence, and selects the regional economic
development level, industrial structure, population
size, population structure, urbanization degree, fiscal
centralization, and the number of ordinary college
graduates as the comparative series.
Table 1. Interpretation of variables
Sequence
classification
variables
Symbol
s
Reference
sequence
Relative amount of education
expenditure
Y
0
Comparison
sequence
Economic development level X
1
Industrial structure X
2
Population size X
3
Population structure X
4
Urbanization degree X
5
Financial centralization and
decentralization
X
6
Total number of university
graduates
X
7
The relative expenditure of public education
expenditure is the proportion of total education
expenditure in Sichuan Province to total fiscal
expenditure, expressed by Y
0
. Economic
development level is expressed by per capita GDP as
X
1
. The industrial structure is measured by the
proportion of the output value of the tertiary industry
in Sichuan Province to the total output value of the
region, expressed by X
2
. The population scale is
measured by the permanent resident population of
Sichuan Province at the end of the year, which is
expressed by X
3
. The population structure is
expressed by the ratio of the population aged 0-14
years to the population aged 15-64 years in China,
expressed by X
4
. The degree of urbanization is
expressed by the ratio of the urban resident
population to the total regional resident population,
which is expressed by X
5
. Fiscal centralization and
decentralization is measured by the ratio of Sichuan's
per capita fiscal expenditure to the state's per capita
fiscal expenditure, which is expressed by X
6
. The
NMDME 2022 - The International Conference on New Media Development and Modernized Education
610
number of college graduates is expressed by X
7
based
on the number of graduates of ordinary colleges and
universities published in the regional statistical
yearbook.
Table 2. Reference series and comparative series of influencing factors of public education expenditure
Year
Y
0
X1 X
2
X
3
X
4
X
5
X
6
X
7
% Yuan/person % 10000 persons % % %
p
erson
2010 12.697 21230 38.065 9001.3 22.282 40.18 70.577 1086215
2011 14.645 26136 38.867 9058.4 22.177 41.85 63.734 1139316
2012 18.221 29627 39.916 9097.4 22.267 43.35 64.661 1223680
2013 16.660 32750 40.884 9132.6 22.192 44.96 66.424 1270818
2014 15.550 35563 42.518 9159.1 22.480 46.51 67.293 1328329
2015 16.703 37150 44.455 9102 22.603 48.27 64.785 1387889
2016 16.255 40297 47.642 9137 23.035 50 65.000 1446559
2017 15.977 45835 50.319 9113.4 23.398 51.78 65.775 1499715
2018 15.058 51658 52.253 9121.8 23.736 53.5 67.706 1564710
2019 15.258 55619 52.559 9099.5 23.796 55.36 67.135 1661737
2020 15.057 58126 52.411 9081.6 26.093 56.73 70.877 1800903
Data source: according to Sichuan statistical yearbook and China Statistical Yearbook
3.2 Grey Correlation Analysis of Public
Education Expenditure in Sichuan
Province
The author collated the collected data, imported the
data into Scientific Platform Serving for Statistics
Professional (SPSSpro), and applied the grey
correlation analysis function in the comprehensive
evaluation analysis in the data analysis toolbar of the
data processing platform to work with data. In the
system, the relative expenditure of public education
is put into the parent series, and the economic
development level, industrial structure, population
structure, urbanization degree, financial
centralization and decentralization, the number of
college graduates are put into the characteristic series.
Since the data do not show obvious increasing or
decreasing characteristics, the paper selects the non
dimensional processing method as the mean value
and the resolution coefficient ρ select its commonly
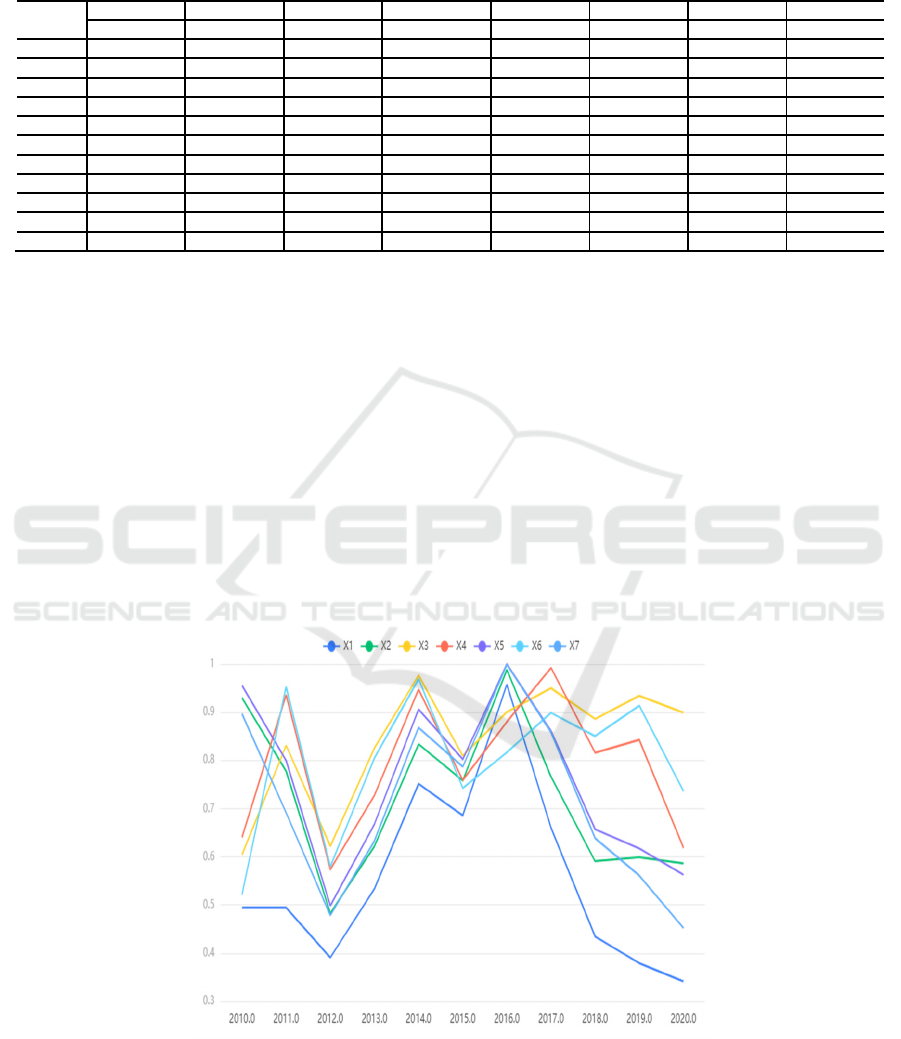
used value of 0.5. The system uses formula (2) to
calculate the correlation coefficient 𝛿. The results are
shown in table 2. The correlation coefficient
represents the degree of correlation between the
factors affecting public education expenditure and the
relative expenditure on public education in the
corresponding dimensions. The larger the number,
the stronger the correlation. Calculate the grey
correlation degree 𝜏 by formula (3) , the results of 𝜏
are shown in table 3.
Fig. 1. Correlation coefficient diagram
Analysis of the Factors Affecting Education Expenditure in Sichuan, China: Based on Grey Correlation Method of Mathematical Model
611

Table 3. Correlation coefficient
Year
𝛿
X1
𝛿
X2
𝛿
X3
𝛿
X4
𝛿
X5
𝛿
X6
𝛿
X7
2010 0.494523 0.929694 0.604319 0.640389 0.955503 0.521617 0.896802
2011 0.494369 0.777822 0.831435 0.936117 0.799839 0.953227 0.691483
2012 0.390897 0.482828 0.622167 0.573633 0.498630 0.579954 0.478549
2013 0.533545 0.621769 0.825664 0.727610 0.668003 0.805226 0.633047
2014 0.751577 0.833505 0.976717 0.947384 0.906256 0.969200 0.868380
2015 0.685656 0.758464 0.810012 0.759366 0.802474 0.742746 0.786947
2016 0.957854 0.988302 0.900638 0.880370 1.000000 0.816671 0.998898
2017 0.660871 0.766350 0.950207 0.992207 0.861244 0.899065 0.858742
2018 0.434400 0.590931 0.886157 0.816135 0.657210 0.850552 0.638366
2019 0.379203 0.599075 0.934251 0.842815 0.617379 0.913844 0.560993
2020 0.341407 0.586230 0.899377 0.618861 0.562756 0.736556 0.452212
Table 4. Ranking of correlation degree of influencing factors of Sichuan Education Expenditure
Evaluation items Symbols Relevance Rank
Population size
𝜏
0.84 1
Financial centralization and decentralization
𝜏
0.799 2
Population structure
𝜏
0.794 3
Urbanization degree
𝜏
0.757 4
industrial structure
𝜏
0.721 5
Total number of university graduates
𝜏
0.715 6
Economic development level
𝜏
0.557 7
4 CONCLUSIONS
According to the calculation of the previous
mathematical model, the table 4 shows that
𝜏
>𝜏
>𝜏
>𝜏
>𝜏
>𝜏
>𝜏
>0.5. This shows that the
level of economic development, industrial structure,
population size, population structure, urbanization,
financial centralization and decentralization, and the
number of college graduates have a significant impact
on public financial education expenditure. Among
them, the grey correlation degree of population size is
0.84, greater than 0.8, ranking first. It can be seen that
the size of the regional resident population is a key
factor affecting the public education expenditure of
Sichuan Province. In the seventh census of China in
2020, the total population of Sichuan was 83674866,
and it is a populous province. Education has the
function of achieving social income distribution
fairness. Education fairness is an important force to
promote social equity, which is conducive to
narrowing the income gap. With the increase of per
capita income, the demand for high-quality education
continues to increase, and the public financial
expenditure on education is also useful for the
efficiency of human resources. Education is the
foundation of scientific and technological progress,
and scientific and technological progress takes
education as the source.
The correlation degrees of fiscal centralization
and decentralization, population structure and
urbanization degree are 0.799, 0.794 and 0.757
respectively, all above 0.75, indicating that fiscal
centralization and decentralization, population
structure and urbanization degree have an obvious
impact on public financial education expenditure.
Fiscal centralization and decentralization are
measured by the ratio of per capita fiscal expenditure
in Sichuan to the national per capita fiscal
expenditure. The larger the value, the higher the
degree of fiscal decentralization. The smaller the
value, the higher the degree of fiscal centralization.
The education expenditure in Sichuan is mainly local
fiscal expenditure. The main reason for the impact of
the demographic structure of regional public
education expenditure on education expenditure is
that the population aged 0-14 years is in the stage of
NMDME 2022 - The International Conference on New Media Development and Modernized Education
612

nursery education, early childhood education and
compulsory education. The government is increasing
the investment in nursery education and early
childhood education. The Chinese government has
implemented free compulsory education, and the
scale of government education expenditure has
increased. The degree of urbanization is the main
factor affecting education expenditure. With the
influx of surplus rural labor into cities and towns,
people's demand for urban education increases, and
public education expenditure increases.
The relevance of the impact of industrial structure
on public education expenditure is 0.721, which
indicates that with the continuous increase of the
proportion of tertiary industry output value and the
continuous optimization of industrial structure, the
impact of regional industrial structure on public
education expenditure is more obvious. The total size
of college graduates shows the development of higher
education. The number of ordinary colleges and
universities in Sichuan Province has increased year
by year. As of 2021, there were 134 ordinary colleges
and universities in Sichuan Province, ranking fifth in
the country, including 53 undergraduate colleges and
81 junior colleges. The correlation degree of the
impact of the size of college graduates on public
finance and education expenditure is 0.715, which
indicates that the development of regional colleges
and universities has a significant impact on regional
education fiscal expenditure. The increase in the
number of college graduates is conducive to
improving the quality of regional human capital,
which is one of the internal factors and driving forces
of a country's and a region's long-term economic
growth.
The correlation between economic development
level and public education expenditure in Sichuan
Province is 0.557, which indicates that economic
development level has the smallest impact on public
education expenditure in Sichuan Province compared
with the other six influencing factors.
The education expenditure of China`s government
at all levels has been continuously improved in terms
of expenditure scale and structure. Combined with the
above analysis of factors affecting government
education expenditure, the following suggestions are
made. Firstly, optimize the structure of fiscal
expenditure and increase the total scale of fiscal
expenditure on education. Secondly, optimize the
structure of education expenditure to meet the needs
of urbanization and the people for education. Thirdly,
improve the supervision system of fiscal education
expenditure and the output efficiency of education
expenditure.
REFERENCES
Cailan Zhu, Dan Liu, Kepei Men, Analysis on the
Correlation between Higher Education and Economic
Development—Grey Correlation Analysis Based on
Statistical and Mathematical Data of Jiangsu Province
from 2010 to 2019, Journal of OUSN, Vol. 24,2022,
pp.43-49.
Huitian Bai, Li'an Zhou, Decentralization and large-scale
popularization of education and medical care:An
empirical study based on China's planned economy,
China Journal of Economics,Vol.7,2020, pp.1-37.
Julong Deng, Basic Method of Grey System (Huazhong
University of Science and Technology Press, 2004).
Minzheng Tian, An Empirical Analysis of the Influence
Factors of Public Education Expenditure Structure of
Local Chinese Government: Taking Shaanxi Province
as an Example, Journal of Northwest University
(Philosophy and Social Sciences Edition), Vol.44,
No.5, pp.64-68.
Rong Wang, Jianfang Yang, An empirical study on the
behavior of local government expenditure on education
in China, Journal of Peking University (Philosophy and
Social Sciences Edition) , Vol. 45, No 4, pp.128-137.
Sifeng Liu, et al. Grey System Theory and Its Application
(Sixth Edition). (Science Press, 2013).
Wenjun Che, An empirical analysis of the influencing
factors of public financial expenditure and education
expenditure in Guangxi, Guangxi Social Sciences, Vol.
5,2010, pp.14-17.
Analysis of the Factors Affecting Education Expenditure in Sichuan, China: Based on Grey Correlation Method of Mathematical Model
613
