
Effect of Frequency and Duty Cycle of a Full-Spectrum Pulsed LED
Light Source on Plant Photosynthetic Rate
Wei Wei
1
, Guoyi Zhang
2
,
Jintian Lin
3
, Lei Chen
3
, Min Wang
4
and Yuxin Tong
5,*
1
Jiangsu Intelligent Optoelectronic Devices and Measurement and Control Engineering Research Center,
Yancheng Teachers University, Yancheng, Jiangsu 224007, China
2
Dongguan Institute of optoelectronics, Peking University, Dongguan, Guangdong 523808, China
3
Xuyu Optoelectronics Co., Ltd, Shenzhen 518101, China
4
Beijing Lvneng Jiaye New Energy Co., Ltd, Beijing 100085, China
5
Institute of Agricultural Environment and Sustainable Development, Chinese Academy of Agricultural Sciences,
Haidian District, Beijing 100081, China
Keywords: Full Spectrum, Photocarbon Ability, Photosynthetic Rate, PPFD, Pulse.
Abstract: In this study, we reviewed the research progress on the use of pulsed lighting for plants and presented the
concept of a full-spectrum pulsed LED light source panel. The changes in photosynthetic photon flux density
(PPFD) at 25 cm below the lamp plate in response to changing light source frequency and duty cycle were
measured. Furthermore, changes in photosynthetic rate with frequency were studied under a fixed duty cycle
of the light source. The photosynthetic rate was greatest at 100 Hz. Additionally, the photosynthetic rate with
a fixed light source frequency was highest at a duty cycle of 40%. Since PPFD cannot be maintained at a fixed
frequency or duty cycle alongside a change in duty cycle or frequency, the concept of photo carbon ability is
proposed here (photo carbon ability = photosynthetic rate/PPFD, which refers to the number of carbon dioxide
molecules that can be induced into photosynthesis by a photon). The changes in the optical carbon ability with
varying frequency were studied under a fixed duty cycle of the light source. The optical carbon ability was
greatest at 100 Hz. Compared with traditional continuous light sources, this pulse frequency is expected to
save 40% energy.
1 INTRODUCTION
The market scale of plant lighting is huge, and there
is large potential for specific uses in the field. The
total global area of greenhouses was equivalent to
2.835 million hectares, of which China accounts for
approximately 86% (Qichang et al., 2009).
Furthermore, it was estimated that a 200 kW high-
pressure sodium lamp is required on average per
hectare, although it is also estimated that 50–60% of
the energy used could be saved by switching to LEDs
instead. The market scale for LEDs purposed for plant
lighting was approximately 283 billion watts, and
considering this, appropriate plant lighting conditions
can be adjusted to reduce energy waste while also
promoting production (Haishan et al., 2021; Jianzhao
et al., 2022; Runa et al., 2021; Wang et al., 2021;
Zheng et al., 2022). The efficiency of light energy
utilization was generally low, at approximately 1%
for plants in the field, and can reach as high as 3% for
rice (Haxeltine et al., 1996; Ma et al., 2020;
Middleton et al. 2009; Nichol et al., 2002; Yao et al.,
2017). Various reasons contributed toward the
challenges pertaining to this efficiency, including
nutrient composition, light parameters, temperature,
and humidity (Angmo P et al., 2021; Nomura K et al.,
2011; Qichang, 2008, 2011a, 2011b, 2011c; Qichang
et al., 2011; Zhang et al., 2011, 2021). One important
challenge with light parameters is that the solar
lighting is continuous, and not pulsed.
Currently, the majority of plant lighting fixtures
utilize continuous lighting, including LEDs,
incandescent lamps, fluorescent lamps, and high-
pressure sodium lamps. However, plant pulse lighting
optimizes the efficiency of photosynthesis and
improves the utilization of light by adjusting the
frequency and duty cycle of the pulse light source,
thereby improving the output while simultaneously
saving energy.
144
Wei, W., Zhang, G., Lin, J., Chen, L., Wang, M. and Tong, Y.
Effect of Frequency and Duty Cycle of a Full-Spectrum Pulsed LED Light Source on Plant Photosynthetic Rate.
DOI: 10.5220/0011948800003536
In Proceedings of the 3rd International Symposium on Water, Ecology and Environment (ISWEE 2022), pages 144-149
ISBN: 978-989-758-639-2; ISSN: 2975-9439
Copyright
c
2023 by SCITEPRESS – Science and Technology Publications, Lda. Under CC license (CC BY-NC-ND 4.0)
Previous studies have investigated the impacts of
pulsed LED lights on plants and found that this can
lead to an improved photosynthetic rate (Cinq-Mars
M et al., 2021;
Kanechi M et al., 2011; Kozai et al.,
1999; Miliauskienė J
et al., 2021; Shimada et al.,
2016). For example, Kozai et al. (1999) in their study
on the effects of LED pulse lighting on
photosynthesis and growth in lettuces, found that at
the pulse lighting period shorter than 100 µs, the
growth of lettuce was 20% higher than that under
continuous lighting. In addition, Shimada et al.
(2011) showed that pulse light improved the levels of
a few plant indicators by more than 30% when
studying plant cultivation under a 180° phase
difference between red and blue light.
These studies have used plants for long-term
verification, with lengthy experimental periods, high
costs, several uncertain variables, and small
optimized pulsed light parameter conditions. To solve
these problems, the present study proposes
optimizing the parameters of the pulsed light source
through rapid measurements using a photosynthesis
instrument, LI-6400.
The experimental temperature was 23 °C, CO
2
concentration was 600 PPM, and the atmospheric
pressure was 1 atm. The LED lamps used consisted
of 2835 lamp beads of red, white, and yellow light
mixed into a full spectrum with a power supply that
had an adjustable frequency and duty cycle power
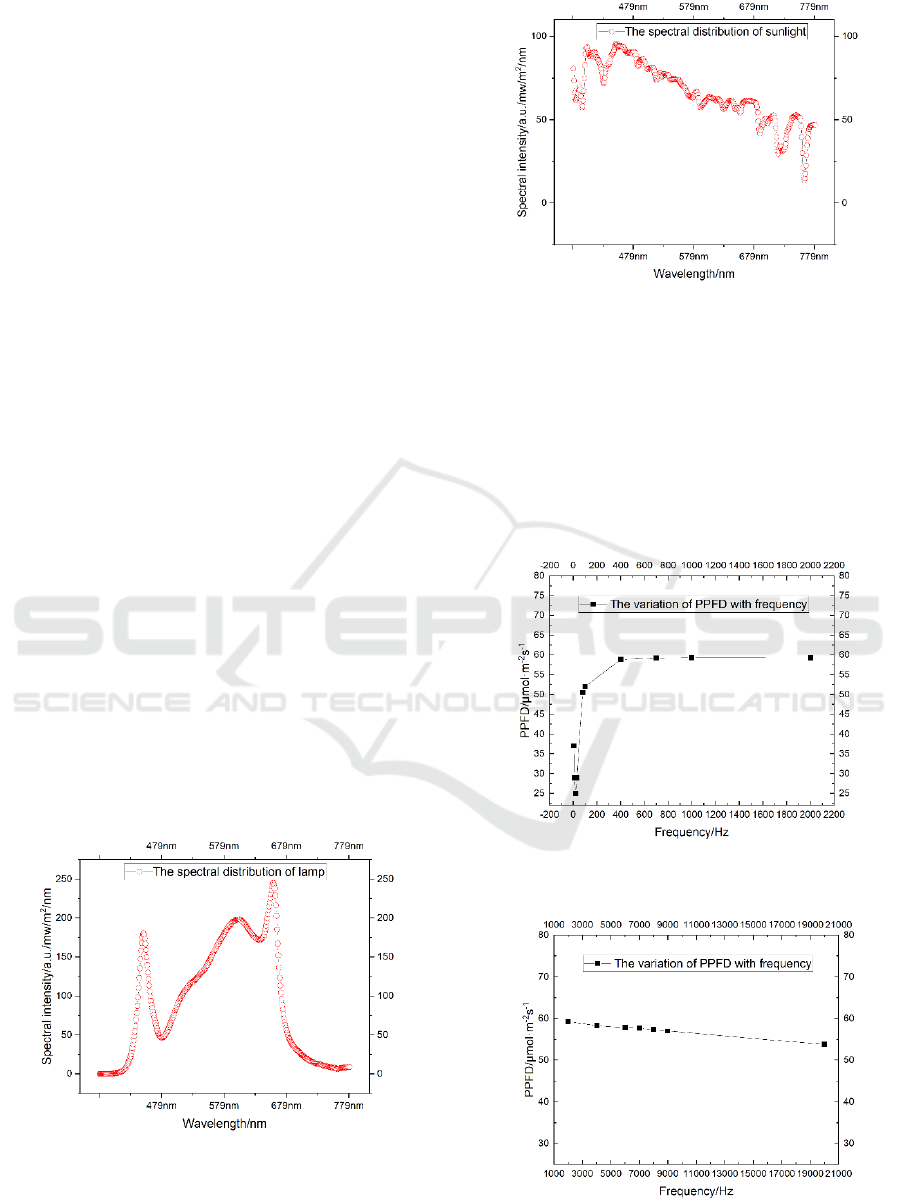
supply. The light spectral structure of the lamps after
mixing is shown in Figure 1, while the solar spectrum
is shown in Figure 2. It was found that the spectrum
after LED mixing highlighted the blue and red
wavelengths absorbed by chlorophyll, which can
promote the absorption of light by chlorophyll to a
certain extent.
Figure 1: Light spectral structure of full-spectrum LED
beads.
Figure 2: The light spectral structureof sunlight.
Figures 3–5 show the variation curves for
photosynthetic photon flux density (PPFD) 25 cm
under the lamp panel at varying frequencies. Figure 3
shows that in the range of 0–2000 Hz, PPFD
increased with increasing frequency, and Figure 4
shows that between 2000–20000 Hz, PPFD remained
relatively stable. Furthermore, Figure 5 revealed that
in the range of 2000–100000 Hz, PPFD decreased as
frequency increased.
Figure 3: Variation curve for PPFD data 25 cm below the
light plate with frequency 0–2000 Hz
Figure 4: Variation curve for PPFD data 25 cm below the
light plate with frequency 2000–20000 Hz.
Effect of Frequency and Duty Cycle of a Full-Spectrum Pulsed LED Light Source on Plant Photosynthetic Rate
145
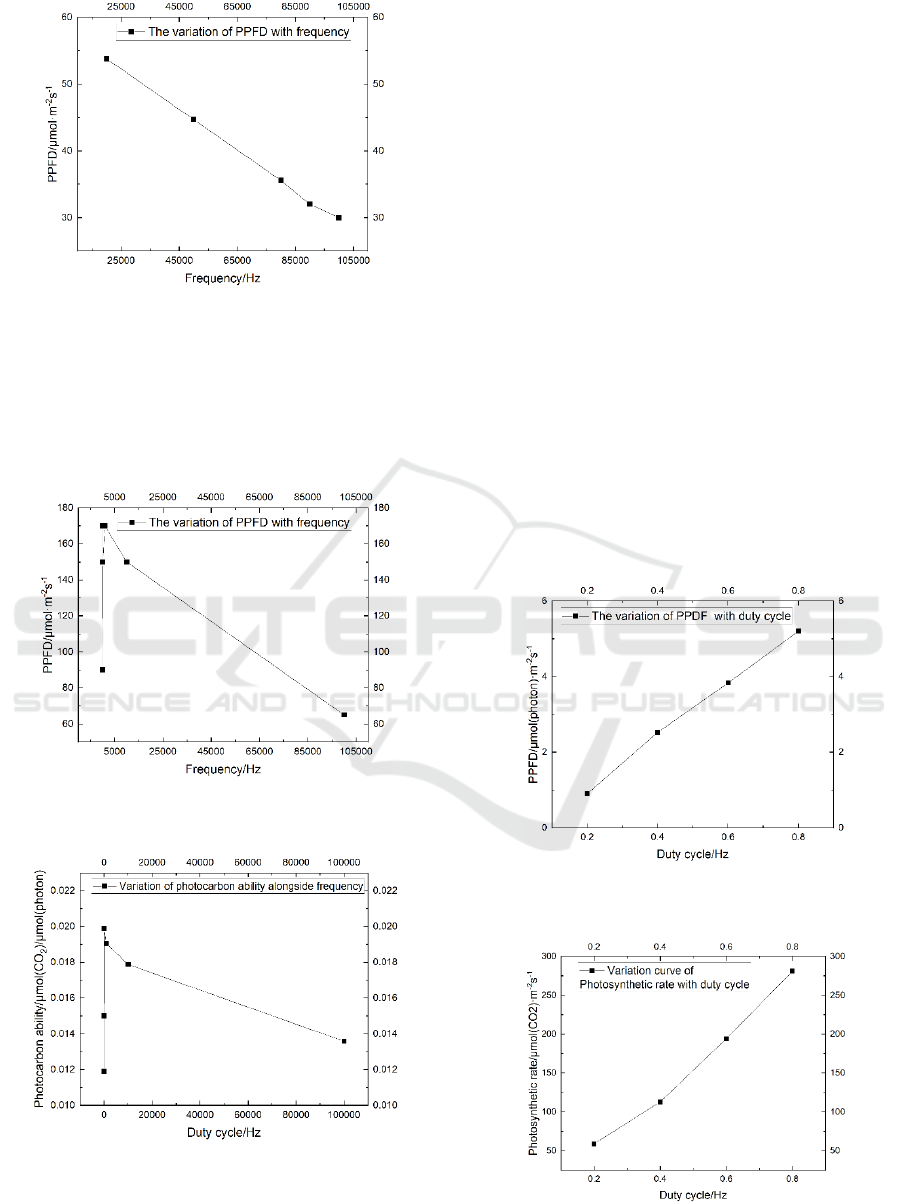
Figure 5: The variation curve for PPFD data 25 cm below
the light plate with frequency 20000–100000 Hz.
For the experimental procedure, the appropriate
frequency and duty cycle were first selected, before
turning on the light for 30 min to allow both the LED
lamp and plant to stabilize. Then, the photosynthetic
rate of the plant was measured using LI-6400.
Figure 6: Variation curve for PPFD data and frequency at
25 cm below the lamp panel.
Figure 7: Variation curve for photosynthetic ability data and
frequency at 25 cm below the lamp panel.
In total, 150 full-spectrum LED beads composed
of 2835 patch mixed beads were used. The
experiments were divided into two groups. The first
group was for the fixed duty cycle and frequency
conversion and the second group was for a fixed
frequency with a conversion duty cycle. Finally, the
optimized optical parameters were obtained.
Frequency was varied from 1 Hz, 10 Hz, 100 Hz,
1000 Hz, 10000 Hz, and 100000 Hz, with a duty cycle
of 50%. Owing to the use of pulse width modulation
(PWM) pulse light, the photosynthetic photon
illuminance of the pulse light at different frequencies
and the same duty cycle both changed because of the
non-zero opening voltage. The PPFD data
corresponding to the above frequencies were 170
µmol·m
-2
s
-1
, 90 µmol·m
-2
s
-1
, 150 µmol·m
-2
s
-1
, 170
µmol·m
-2
s
-1
, 150 µmol·m
-2
s
-1
, and 65 µmol·m
-2
s
-1
,
respectively. It can be seen from Figure 7 that with the
variation in pulse light frequency, the resultant
photosynthetic rates were 2.55 µmol(CO
2
)·m
-2
s
-1
, 1.07
µmol(CO
2
)·m
-2
s
-1
, 2.98 µmol(CO
2
)·m
-2
s
-1
, 3.24
µmol(CO
2
)·m
-2
s
-1
, 2.68 µmol(CO
2
)·m
-2
s
-1
, 0.88
µmol(CO
2
)·m
-2
s
-1
, respectively. It can also be seen
from the figure that the highest photosynthetic rate for
plants was recorded at 1000 Hz.
Figure 8
Variation curve for PPFD data alongside duty
cycle at 25 cm below the lamp panel.
Figure 9 Variation curve for photosynthetic rate data
alongside duty cycle at 25 cm below the lamp panel.
ISWEE 2022 - International Symposium on Water, Ecology and Environment
146
Next, we studied the effects of pulse lighting with
varying duty cycles on plant photosynthetic rate
under a fixed frequency of 100 Hz. Figure 9 shows
that for these conditions the PPFD results associated
with the above frequencies were 59 µmol·m
-2
s
-1
, 113
µmol·m
-2
s
-1
, 194 µmol·m
-2
s
-1
, and 281 µmol·m
-2
s
-1
,
respectively. For pulse lighting with a duty cycle of
20%, 40%, 60%, and 80%, the respective
photosynthetic rates of plants were 0.90
µmol(CO
2
)·m
-2
s
-1
, 2.52 µmol(CO
2
)·m
-2
s
-1
, 3.83
µmol(CO
2
)·m
-2
s
-1
, and 5.20 µmol(CO
2
)·m
-2
s
-1
. When
frequency was 100 Hz, the photosynthetic rate of the
plants was highest at a duty cycle of 60%.
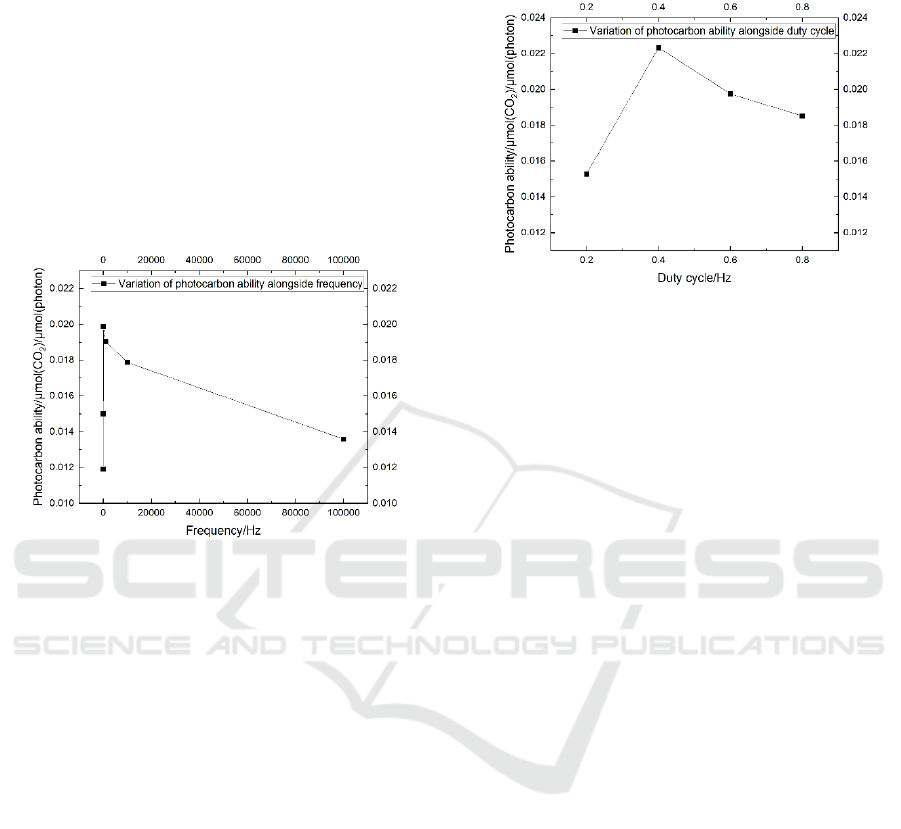
Figure 10 Variation of photocarbon ability alongside
frequency at 25 cm below the light plate.
To better measure the photosynthetic rate under
the unit PPFD, we propose a new concept here:
Photocarbon ability = (photosynthetic rate)/PPFD,
that is, the normalized treatment of photon
illuminance by photosynthetic rate (i.e., how many
carbon dioxide molecules a photon can convert).
Frequencies of 1 Hz, 10 Hz, 100 Hz, 1000 Hz,
10000 Hz, and 100000 Hz were applied, with a duty
cycle of 50%. Considering that PWM pulse light was
used, the photosynthetic photon illuminance of pulse
light with different frequencies and the same duty
cycle changed as a result of the non-zero switching on
voltage. Therefore, the plant photosynthetic rate was
normalized by the same amount of photosynthetic
photon illuminance, and the plant utilization rate of
light was measured using the normalized treatment of
photosynthetic rate on photon illuminance, that is, the
light carbon ability. It can be seen from the figure that,
with the changes in pulse light frequency to 1 Hz, 10
Hz, 100 Hz, 1000 Hz, 10000 Hz, and 100000 Hz, the
respective optical carbon ability was 0.015
µmol(CO
2
) µmol
-1
(photon), 0.012 µmol(CO
2
) µmol
-
1
(photon), 0.020 µmol(CO
2
) µmol
-1
(photon), 0.019
µmol(CO
2
) µmol
-1
(photon), 0.018 µmol(CO
2
) µmol
-
1
(photon), and 0.014 µmol(CO
2
) µmol
-1
(photon).
Figure 10 also shows that the optical carbon ability
was highest with a pulse frequency of 100 Hz.
Figure 11 Variation of photocarbon ability alongside duty
cycle at 25 cm below the light plate.
Subsequently, we investigated the effects of pulse
lighting with a varying duty cycle on plant
photosynthetic rate under a fixed light pulse
frequency of 100 Hz. Figure 11 shows that under
these conditions, the light carbon ability of plants
were 0.015 µmol(CO
2
) µmol
-1
(photon), 0.022
µmol(CO
2
) µmol
-1
(photon), 0.020 µmol(CO
2
) µmol
-
1
(photon), 0.019 µmol(CO
2
) µmol
-1
(photon) with
respective duty cycles of 20 %, 40 %, 60 %, and 80
%.
3 CONCLUSIONS
To conclude, by first fixing the duty cycles and
varying the frequencies, we found that the
photosynthetic rate of plants was greatest at a
frequency of 1000 Hz. Furthermore, at a fixed pulse
frequency of 1000 Hz, the highest photosynthetic rate
of plants was observed at a duty cycle of 40%. To
better measure the ability of photons to convert CO
2
,
a new concept of optical carbon ability is proposed
here. That is to say, under the same conditions,
varying the pulse light frequency to 1 Hz, 10 Hz, 100
Hz, 1000 Hz, 10000 Hz, 100000 Hz. This study
showed that the light carbon ability of plants was
greatest when frequency was 100 Hz. Then, at a fixed
pulse frequency of 100 Hz, the light carbon rate of
plants was optimal at a duty cycle of 60%. Compared
with traditional continuous light sources, this pulse
frequency is expected to save 40% energy.
Effect of Frequency and Duty Cycle of a Full-Spectrum Pulsed LED Light Source on Plant Photosynthetic Rate
147

ACKNOWLEDGEMENTS
This work was supported by the Jiangsu Province
"Mass Entrepreneurship and Innovation Doctor"
Project (JSSCBS20211145) in 2021 and the Jiangsu
Intelligent Optoelectronic Devices and Measurement
and Control Engineering Research Center open
project in 2022.
REFERENCES
Angmo, P., Phuntsog, N., Namgail, D., Chaurasia, O. P.,
and Stobdan, T. (2021). Effect of shading and high
temperature amplitude in greenhouse on growth,
photosynthesis, yield and phenolic contents of tomato
(Lycopersicum esculentum Mill.). Physiology and
Molecular Biology of Plants, 27(7): 1539-1546.
https://doi. Org/10.1007/s12298-021-01032-z
Cinq-Mars, M., and Samson, G. (2021). Down-regulation
of photosynthetic electron transport and decline in CO2
assimilation under low frequencies of pulsed lights.
Plants, 10(10), 2033.
Haishan, K., Huawei, H., Jing, M., and Yang, S. (2021).
Power system planning and thinking base on China’s
“Carbon peak and carbon neutrality” policy. IOP
Conference Series: Earth and Environmental Science.
IOP Publishing, 827(1), 012011.
https://doi.org/10.1088/1755-1315/827/1/012011
Haxeltine, A., and Prentice, I. C. (1996). A general model
for the light-use efficiency of primary production.
Functional Ecology, 10(5), 551–561.
https://doi.org/10.2307/2390165
Jianzhao, Y., and Zhu, X. (2022). Plant synthetic biology
for carbon emission peak and carbon neutrality.
Synthetic Biology Journal, 1. https://doi:
10.12211/2096-8280.2022-034.
Kanechi, M., Maekawa, A., Nishida, Y., Miyashita, E.
(2016). Effects of pulsed lighting based light-emitting
diodes on the growth and photosynthesis of lettuce
leaves. VIII International Symposium on Light in
Horticulture, 1134, 207–214.
Kozai, T., Ohyama, K., Afreen, F., Zobayed, S., Kubota, C.,
Hoshi, T., and Chun, C. (1999). Transplant production
in closed systems with artificial lighting for solving
global issues on environment conservation, food,
resource and energy. Proceedings of the of
ACESYSÓCon für From Protected Cultivation to
Phytomation, 31–45.
Ma, L., Wang, S., Chen, J., Chen, B., Zhang, L., Ma, L.,
Amir, M., Sun, L., Zhou, G., and Meng, Z. (2020).
Relationship between light use efficiency and
photochemical reflectance index corrected using a
BRDF model at a subtropical mixed forest. Remote
Sensing, 12(3), 550.
https://doi.org/10.3390/rs12030550
Middleton, E. M., Cheng, Y. B., Hilker, T., Black, T. A.,
Krishnan, P., Coops, N. C., and Huemmrich, K. F.
(2009). Linking foliage spectral responses to canopy-
level ecosystem photosynthetic light-use efficiency at a
Douglas-fir forest in Canada. Canadian Journal of
Remote Sensing, 35(2), 166–188.
https://doi.org/10.5589/m09-008
Miliauskienė, J., Karlicek, Jr. R. F., and Kolmos, E. (2021).
Effect of multispectral pulsed light-emitting diodes on
the growth, photosynthetic and antioxidant response of
baby leaf lettuce (Lactuca sativa L.). Plants, 10(4), 762.
Nichol, C. J., Lloyd, J. O. N., Shibistova, O., Arneth, A.,
Röser, C., Knohl, A., Matsubara, S., and Grace, J.
(2002). Remote sensing of photosynthetic-light-use
efficiency of a Siberian boreal forest. Tellus B, 54(5),
677–687. https://doi.org/10.3402/tellusb.v54i5.16710
Nomura, K., Yasutake, D., Kaneko, T., Iwao, T., Okayasu,
T., Ozaki, Y., Mori, M., and Kitano, M. (2021). Long-
term estimation of the canopy photosynthesis of a leafy
vegetable based on greenhouse climate conditions and
nadir photographs. Scientia Horticulturae, 289:
110433. https://doi.org/10.1016/j.scienta.2021.110433
Qichang, Y (2008). Application and prospect of LED in
agriculture and biological industry. China Agricultural
Science and Technology [Bulletin], 10(6) (pp. 42–47).
Qichang, Y (2011a). Application status and development
strategy of LED in agriculture. China Science and
Technology Wealth, 1, 52–57.
Qichang, Y (2011b). Application status and development
trend of LED in protected horticulture industry.
Innovation and progress in Protected Horticulture.
(2011/04/20). Proceedings of the Second China
Shouguang International High Level Academic Forum
on Protected Horticulture in 2011.
Qichang, Y. (2011c). Plant factory and vertical agriculture
and their resource substitution strategy. Innovation and
progress in Protected Horticulture. (2011/04/20).
Proceedings of the Second China Shouguang
International High Level Academic Forum on
Protected Horticulture in 2011.
Qichang, Y., Zhigang, X., Hongda, C., Jinming, P.,
Lingling, W., Wenke, L., Hong, Z., Xiaoying, L., and
Changbin, S. (2011). The application principle and
technical progress of LED light source in modern
agriculture. China Agricultural Science and
Technology Herald, 13(5), 37–43.
Qichang, Y., Zhongfu, S., Lingling, W., Wenke, L.
Shunshu, B., and Ruifeng, C. (2009). Research status
and development strategy of facility agriculture in
China. New progress in protected horticulture research
– Proceedings of the 2009 Shouguang International
Protected Horticulture Senior Academic Forum.
Runa, A., Zhang, Z., and Zhang, H. (2021). Carbon
emission peak and carbon neutrality under the new
target and vision. International Conference on
Advanced Electrical Equipment and Reliable
Operation (AEERO), 2021 (pp. 1–5). IEEE
Publications.
Shimada, A., and Taniguchi, Y. (2011). Red and blue pulse
timing control for pulse width modulation light
dimming of light emitting diodes for plant cultivation.
Journal of Photochemistry and Photobiology. B,
ISWEE 2022 - International Symposium on Water, Ecology and Environment
148

Biology, 104(3), 399–404.
https://doi.org/10.1016/j.jphotobiol.2011.04.007
Wang, Y., Guo, C., et al. (2021). Carbon peak and carbon
neutrality in China: Goals, implementation path and
prospects. China Geology, 4(4), 720–746.
Yao, H., Zhang, Y., Yi, X., Zuo, W., Lei, Z., Sui, L., and
Zhang, W. (2017). Characters in light-response curves
of canopy photosynthetic use efficiency of light and N
in responses to plant density in field-grown cotton.
Field Crops Research, 203, 192–200.
https://doi.org/10.1016/j.fcr.2016.12.018
Zhang, J., Ding, J., Ibrahim, M., Jia, X., Song, X., Bai, P.,
and Li, J. (2021). Effects of the interaction between
vapor-pressure deficit and potassium on the
photosynthesis system of tomato seedlings under low
temperature. Scientia Horticulturae, 283: 110089.
https://doi.org/10.1016/j.scienta.2021.110089
Zhang, M., Yu, G. R., Zhuang, J., Gentry, R., Fu, Y., Sun,
X., Zhang, L., Wen, X., Wang, Q., Han, S., Yan, J.,
Zhang, Y., Wang, Y., and Li, Y. (2011). Effects of
cloudiness change on net ecosystem exchange, light use
efficiency, and water use efficiency in typical
ecosystems of China. Agricultural and Forest
Meteorology, 151(7), 803–816.
https://doi.org/10.1016/j.agrformet.2011.01.011
Zheng, B., Wang, S., and Xu, J. (2022). A review on the
CO
2
emission reduction scheme and countermeasures
in China’s energy and power industry under the
background of carbon peak. Sustainability, 14(2), 879.
https://doi.org/10.3390/su14020879
Effect of Frequency and Duty Cycle of a Full-Spectrum Pulsed LED Light Source on Plant Photosynthetic Rate
149
