Smart Biogas Plant Monitoring System Using Internet of Things
(IoT) Technology
Hendrik Elvian Prasetya, Ikke Dianita Sari, Rif’ah Amalia, Achmad Fawaidz Bintang Azisa,
Aulia Lailatul Fitri and Muhammad Rizal Jibran
Powerplant Engineering Departement, Politeknik Elektronika Negeri Surabaya, Surabaya, Indonesia
aulialaila12345@gmail.com, rizaljibran210800@gmail.com
Keywords: Biogas, Digester, IoT, Biogas Sensor.
Abstract: Biogas is mixture of gases produced from fermentation process of organic matter derived from animal manure.
To produce optimal biogas, it is necessary to have composition of raw materials and appropriate
environmental conditions. This study used measurement system to maintain conditions in the biogas reactor.
Two types of tanks are used, first the digester tank functions as an anaerobic biogas production process, and
second storage tank functions to store biogas produced. Thermocouple sensor to detect temperature, MQ-4
sensor to detect methane gas, MG-811 sensor to detect carbon dioxide gas, and MQ-136 sensor to detect
hydrogen sulfide. Data from the readings of all sensors will be processed first into microcontroller, Arduino
Mega 2650, which will then be monitored via smartphone with the Android IoT platform in the form of Blynk.
Sensor data can be displayed on the blynk platform using communication module. Based on the measurement
results, it is known that the accuracy of measuring instrument is compared with secondary data, precision
value of measuring instrument is analyzed based on the standard deviation with the results of all measuring
instruments not more than 5.0, and the linearity value obtained from results of regression calculations with
linearity results not more than 0.15%.
1 INTRODUCTION
To carry out economic activities in Indonesia, energy
is needed for consumption and production activities
in various economic fields. Currently in line with
economic growth and increasing energy needs.
During the 2010-2019 period, total final energy
consumption (including biomass) increased from
777.3 million to 1.009 million BOE (Barrel Oil
Equivalent). Indonesia is a country that has renewable
and non-renewable resources. However, exploration
of energy resources is more focused on the energy
that is unrenewable resources. High dependence on
fossil energy sources is still a significant problem in
the national energy supply. In 2019 it was recorded
that 90.7% of the national primary energy supply was
met from coal, oil, and natural gas.
In 2017 the government issued the Rencana
Umum Energi Nasional (RUEN), with one of the
targets for developing bioenergy-based renewable
energy is the use of biogas. Biogas is one of the
environmentally friendly renewable energy, and its
availability is abundant in Indonesia. Utilizing biogas
is expected to reduce energy dependence on fossil
fuels. Biogas is produced from the fermentation of
organic materials by microorganisms under anaerobic
conditions. Materials containing organic compounds
can be used as biogas, be it organic waste, plantation
waste, or livestock manure such as cow dung.
Biogas contains a relatively high proportion of
methane (CH4). The complete composition of the
biogas content is as follows:
Table 1: Biogas Content Composition.
Gas T
yp
e Amount
(
%
)
Metana (CH4) 50 - 70
Nitro
g
en
(
N2
)
0 - 0,3
Karbondioksida
(
CO2
)
25 - 45
Hidro
g
en
(
H2
)
1 - 5
Oksi
g
en
(
O2
)
0,1 - 0,5
Hidro
g
en Sulfida
(
H2S
)
0 - 3
Prasetya, H., Sari, I., Amalia, R., Azisa, A., Fitri, A. and Jibran, M.
Smart Biogas Plant Monitoring System Using Internet of Things (IoT) Technology.
DOI: 10.5220/0011955600003575
In Proceedings of the 5th International Conference on Applied Science and Technology on Engineering Science (iCAST-ES 2022), pages 915-920
ISBN: 978-989-758-619-4; ISSN: 2975-8246
Copyright © 2023 by SCITEPRESS – Science and Technology Publications, Lda. Under CC license (CC BY-NC-ND 4.0)
915

To produce optimal biogas, it is necessary to have a
composition of raw materials and appropriate
environmental conditions. The changing environment
will affect and can reduce the quality of biogas.
Therefore, to maintain the conditions in the biogas
reactor as desired, it is necessary to add measurements
and monitoring in real-time. This study used the batch
type for the biogas production process. The control
system used is an ON-OFF control system, where
when the methane content in the digester has reached
70%, the valve will open so that the biogas will enter
the storage tank. Inside the digester tank, a stirrer will
operate for one hour four times a day.
The gas content and temperature in the digester
tank and storage tank will be measured using sensors
and monitored via a smartphone using IoT software,
namely Blynk. From this research, it is hoped that the
conditions in the digester will be monitored according
to
the desired conditions, and the biogas yield can be
more optimal.
2
F L O W C H A R T A N D T O O L
MAKING
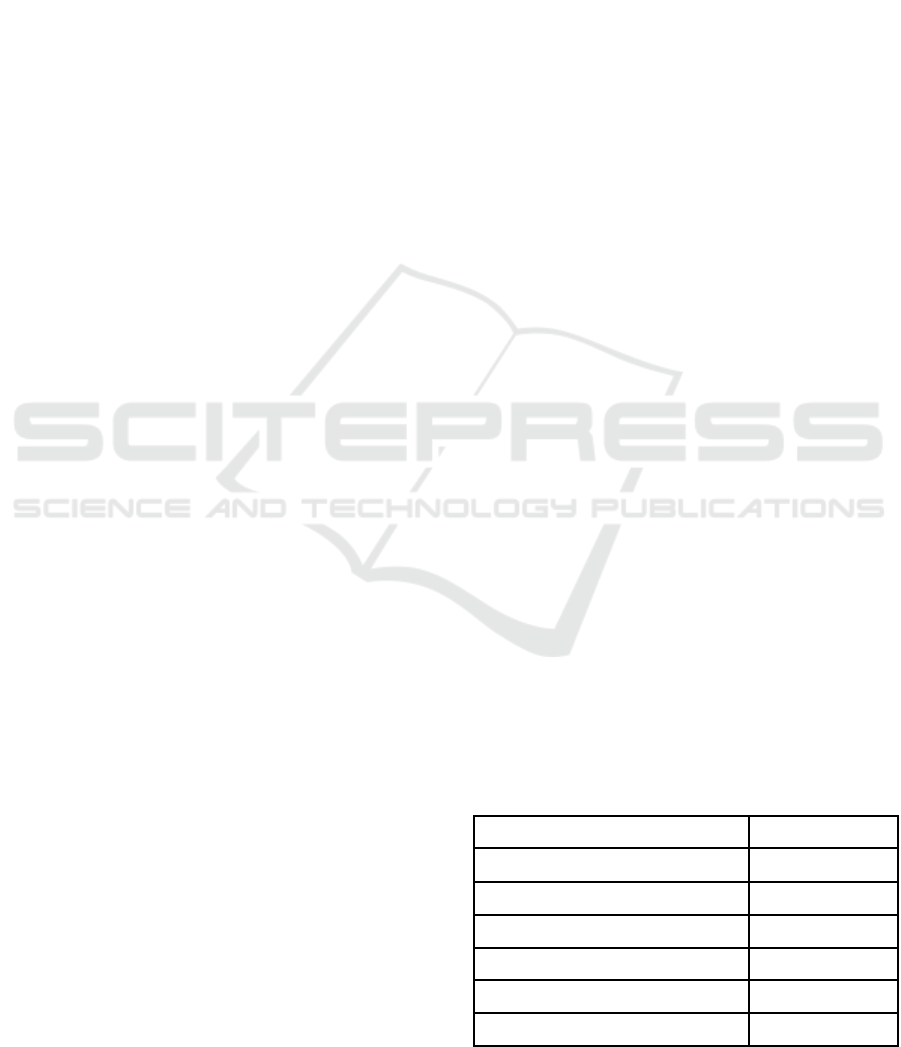
2.1 Flowchart Monitoring Process
Figure 1: Schematic P&ID of the system on the digester.
In Figure 1, the process begins with the raw materials
being put in the digester tank, and then the stirrer will
rotate according to the set timer. After the methane is
formed, the sensor will detect the methane level and
process it using a controller. When the methane
content reaches 70%, the controller will instruct the
valve to open, and the biogas fills the storage tank.
The entire process will be monitored on a smartphone
using an IoT platform in the form of Blynk.
From the hardware design above, the methane
content is obtained from the MQ-4 sensor, the carbon
dioxide level from the MG-811 sensor, the hydrogen
sulfide content from the MQ-136, and the temperature
from the K type thermocouple. The sensor will then
be connected to the Arduino Mega microcontroller.
2560. Valves and agitation motors are also connected
to the microcontroller. The output is displayed on the
smartphone on the IoT platform, namely Blynk. To be
able to display the output on the Blynk, the
microcontroller will be connected to a
communication module in the form of an ESP8266.
2.2 Manufacturing Process
In this study, the process of making the tool follows
the directions on the flowchart shown in Figure 3. The
manufacture of hardware and software is carried out
in parallel by starting with hardware design by
drawing the circuit schematic. After that, the
schematic is checked and printed on the
PCB using
the help of the EAGLE software. Followed by laying
the components on the PCB by soldering, the results
of the hardware design can be seen in Figure 2.
Figure 2: Hardware Tool Design.
The data that has been processed on the
microcontroller will then be sent to the Blynk
software via the internet network that the
microcontroller requires a communication module so
that the microcontroller can connect to the internet
network. The communication module used is ESP826
Software development is done by programming each
sensor and programming it for smartphone needs. The
program is made with the help of Arduino software.
After that, check again to ensure the program is
correct so it can be integrated. Followed by testing for
the program as a whole. If successful, the program is
iCAST-ES 2022 - International Conference on Applied Science and Technology on Engineering Science
916
uploaded to the assembled hardware. The
communication module needs to be configured first
with the microcontroller, Arduino Mega 2650.
Figure 3: Tool making flowchart.
3
CHARACTERISTICS STATIC
MEASUREMENT SYSTEM
3.1 Accuracy
Accuracy is the accuracy of measuring instruments in
providing readings (Gunterus, 1994). Measurement
accuracy is how close the measured value of a quantity
is to the actual value. This quantity indicates the
number of deviations that occur in a measuring device
or system. There are several ways to express accuracy.
3.1.1 On the Measurement Variable
For example, a thermometer with a scale of O`F -
1OO'F is said to have an accuracy of 1'F. If the
thermometer shows a temperature of 40'F, then the
actual temperature is between 39'F and 41'F
3.1.2 In Percentage Span
A pressure transmitter has a of 100-400 psi range and
span accuracy. In other words, every signal that
comes to the transmitter can deviate as much as 0.5%
x 300 psi = 1.5 psi. For example, if the transmitter
emits 250 psi, the actual pressure will be between
248.5 psi and 251.5 psi.
3.1.3 In Percentage to the Maximum Scale
The term maximum scale is usually called full scale
(FS). Thus a voltmeter is said to have an accuracy of
1% FS, which means that if the meter is set to a
maximum reading scale of 300 volts, the accuracy in
that range is ±3 volts.
3.1.4 In Percentage of Reading
In this case, the accuracy depends on the value of the
reading measured. A level transmitter is said to have
an accurate output of 0.5%. The transmitter range is
0-100 cm. If the transmitter time shows the signal at
60cm, then the actual level range is 59.7 - 60.3cm.
3.2 Precision
Precision is the ability to produce the same value from
identical and repeated measurement results
(measurement points and relative time) (Obstfeld &
Taylor, 1997). The smaller the difference between
repeated measurements, the better the instrument's
performance. This can be seen from the standard
deviation obtained from the measurement.
The standard deviation is a statistic used to
determine how spread out the sample data is and how
close each point is to the mean. If the variance from
the mean is very large, the value of the 𝜎𝑥 will be
large, but if the variance of the data from the mean is
very small, then the value of 𝜎𝑥 will also be small.
This helps to determine whether the sample data
collected is representative of the population. Higher
precision means a smaller standard deviation. The
standard deviation can be calculated according to the
formula:
Smart Biogas Plant Monitoring System Using Internet of Things (IoT) Technology
917

(1)
3.3 Linearity
An element can be said to be linear if its input and
output curves form a straight line. However, finding
a graph with an ideal linear form is very rare. There
will be indentations that are usually slightly curved or
tortuous. However, in an ideal straight line, there is
still a nonlinearity called linearity (Gunterus, 1994).
A linearity test is needed to find out whether two
variables have a linear relationship or not. The
measuring instrument can be said to have a linearity
level of 1% if the results of the input-output ratio
curve are still winding, but the difference in curvature
that is produced is still in the range of ± 1%. The
approach to a non-linear curve by cutting the curve
into smaller parts is called piecewise linear. The non-
linear shapes can be a parabola, serpentine, or curved.
The regression method is used to determine linearity.
Simple regression analysis is the relationship between
two variables: the independent variable and the
dependent variable. Multiple regression analysis is
the relationship between three or more variables,
with at least two independent variables and one
dependent variable. The purpose of regression is to
estimate the value of a variable when its value is
related to another specified variable. There are two
types of regression used: linear regression and
quadratic regression.
3.4 Linier Regression
Linear regression determines the effect between one
independent variable and one dependent variable.
The linear regression equation for a population based
on Yusuf (2009) is shown in the equation below:
𝑦
′
𝑎
0
𝑎
1
𝑥
(2)
3.5 Quadratic Regression
Quadratic regression is when the value of the
independent variable increases or decreases linearly,
or the form is displayed in a parabola if the data
results are formed in a scatter plot (the relationship
between the dependent and independent variables is
squared) and is a nonlinear regression method
(Wibisono, 2005). The mathematical model for
quadratic regression is:
𝑦
′
𝑎
0
𝑎
1
𝑥 𝑎
2
𝑥
2
(3)
4 RESULTS AND DISCUSSION
Accuracy is the precision of a measuring instrument
in providing readings (Gunterus, 1994). To determine
the accuracy of the measuring instrument, calibration
of the measuring instrument must be carried out.
Calibration is essential to determine the conventional
correctness of the designation value of measuring
instruments and measuring materials by comparing
traceable measuring standards to national standards
for units of measure. As explained in Chapter 2, there
are three types of measuring standards in calibrating.
In this study, the data produced by MQ-4 (methane
sensor), MG-811 (carbon dioxide sensor), and MQ-
136 (sulfide acid sensor) are compared with
measurement standards in the form of data from
Slamet's research, 2017. In comparison, the data
generated by the K- Type Thermocouple is compared
to NTC.
Table 2: Clean Air Composition.
No
Gas Type
Formula
Concentration Concentration
(
%
)
(pp
m
)
1
Nitrogen N
2
78,09 780.900
2
Oxygen O
2
20,95 209.500
3
Argon Ar 0,934 9.340
4
Carbon dioxide CO
2
0,032 320
5
Neon Ne 1,8 x 10
-3
18
6
Helium He 5,2 x 10
-4
5,2
7
Methane CH
4
1,5 x 10
-4
1,5
8
Krypton Kr 1,0 x 10
-4
1
9
Hydrogen H
2
5,0 x 10
-4
0,5
10 Water H
2
O
2,0 x 10
-5
0,2
11
Carbon
monoxide
CO 1,0 x 10
-5
0,1
12 Xenon Xe 1,0 x 10
-6
0,08
13 Ozone O
3
2,0 x 10
-6
0,02
14 Ammonia NH
3
6,0 x 10
-7
0,006
15 Nitogen dioxide NO
2
1,0 x 10⁻⁷ 0,001
16
Nitrogen
monoxide
NO 6,0 x 10⁻⁸ 0,0006
17 Sulfur dioxxide SO
2
2,0 x 10⁻⁸ 0,0002
In this study, calibration was carried out three
times before the sensor was installed on the tank
to conduct the experiment. The results of sensor
readings on calibration are as follows:
iCAST-ES 2022 - International Conference on Applied Science and Technology on Engineering Science
918
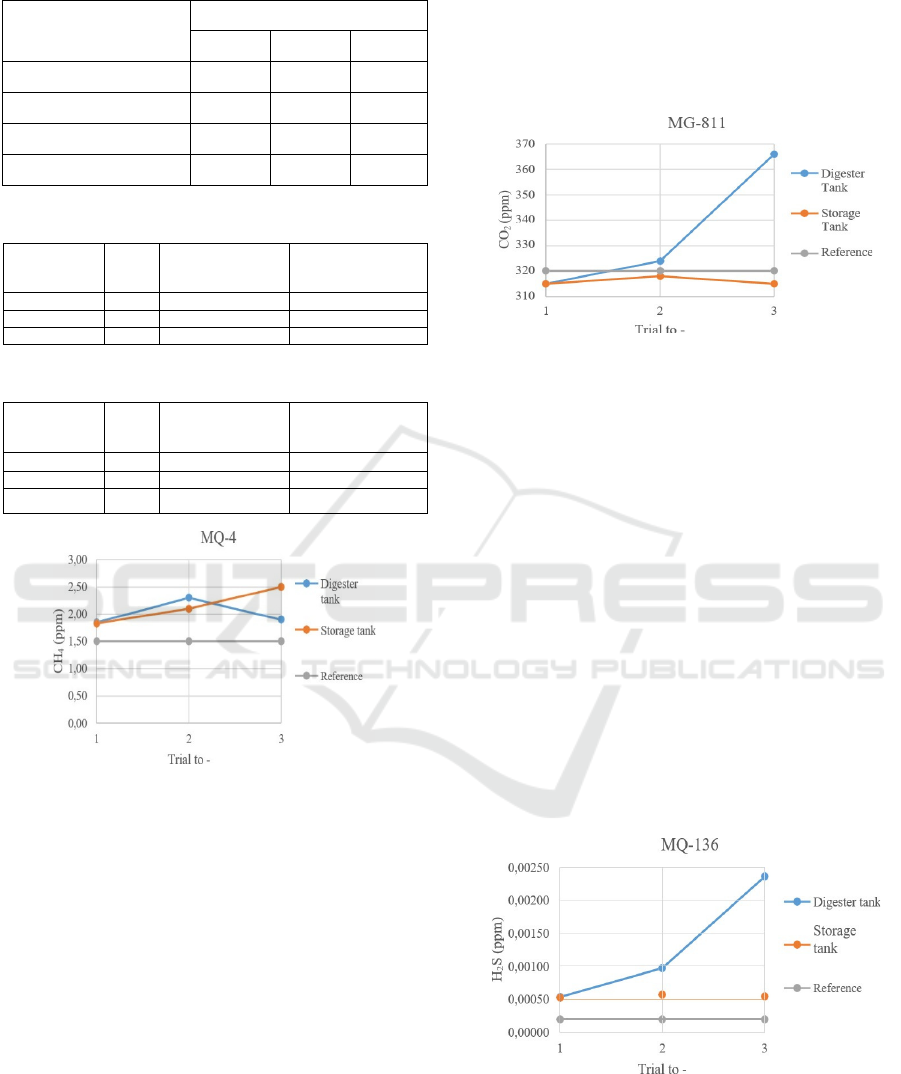
Table 4: Digester Tank Readings.
Sensor
Calibration to -
1 2 3
MQ-4 (ppm) 1,85 2,3 1,9
MG-811 (ppm) 315 324 366
MQ-136 (ppm) 0,00054 0,00098 0,00237
Thermocouple Type K
27,5℃ 28 ℃ 27,5 ℃
Table 5: Storage Tank Readings.
Calibration to
-
NT C Thermocouple type-
K
(Digester Tank)
Thermocouple type- K
(Storage Tank)
1
27,8 27,5 27,5
2
28,3 28 27,5
3
27,6 27,5 27,75
Table 6: Temperature Readings.
Calibration to
-
NT C Thermocouple type-
K
(Digester Tank)
Thermocouple type- K
(Storage Tank)
1
27,8 27,5 27,5
2
28,3 28 27,5
3
27,6 27,5 27,75
Figure 4: Calibration of the MQ-4 Sensor.
In the first calibration, the results of the MQ-4 sensor
on the digester tank and storage tank showed a
difference of 0.35 ppm by reference. In the second
calibration, the difference in the readings of the MQ-
4 sensor increased. The sensor on the digester tank
shows a difference of 0.8 ppm, while in the storage
tank, it is 0.6 ppm. The increase in the second
experiment was due to the onset of rust on the sensor.
The higher the difference between the reading and the
reference, the accuracy of the measuring instrument
decreases, so maintenance must be carried out in the
form of a large enough sensor cleaning so that the
sensor is better replaced with a new sensor. After the
MQ-4 sensor attached to the digester tank was
replaced with a new sensor, the reading difference
dropped to 0.4 ppm. Meanwhile, in storage tanks, the
difference is higher than before, which is 1.0 ppm.
There are differences in the sensors attached to the
digester tank and the storage tank. This is due to the
sensor attached to the digester tank being replaced
with a new one, while the sensor on the storage tank
is only cleaned if the reading still shows the
difference.
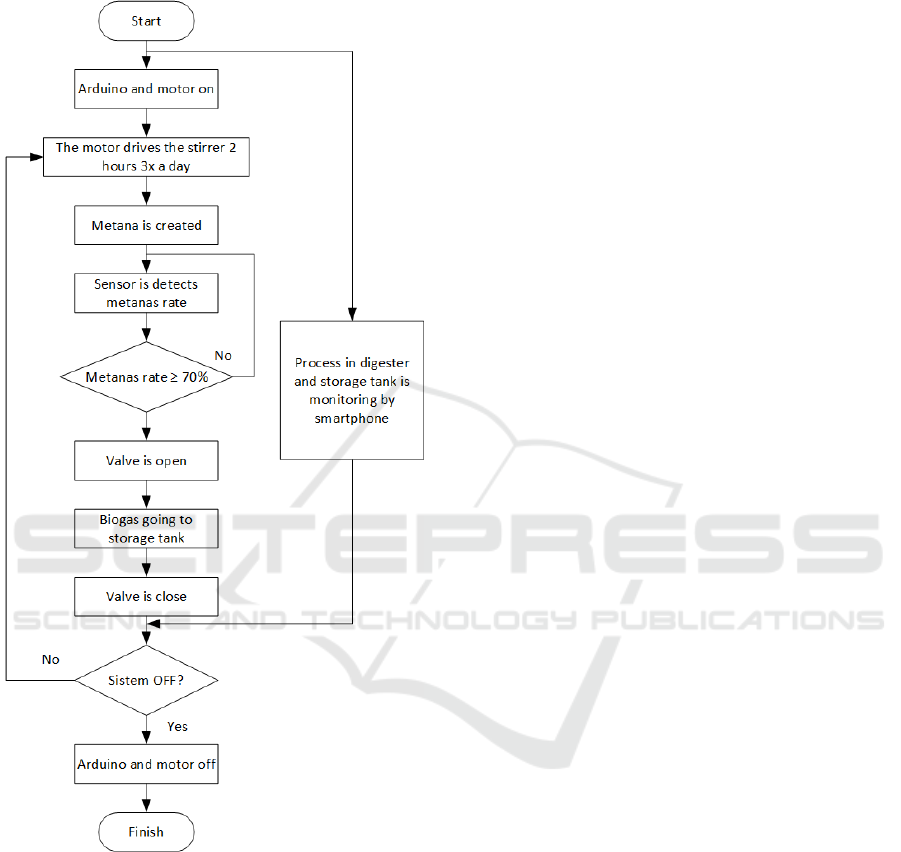
Figure 5: Calibration of the MG-811 Sensor.
From the graph in Figure 5, the readings of the MG-
811 sensor on the digester tank and the storage tank
are very different. In the first calibration, the readings
on the two tanks are the same at 315 ppm, a difference
of 5 ppm from the reference. For the second
calibration, the sensor readings are equal to the
increase. The sensor on the digester tank shows a
difference of 4 ppm, while the digester tank shows a
difference of 2 ppm. There is an increase in graphics,
and this is due to the onset of rust on the sensors. In
the third calibration, the sensor on the digester tank
has increased significantly enough to produce a
difference of 46 ppm, while in the storage tank, the
sensor shows a difference of 5 ppm. In the third
calibration, the sensor located on the digester tank
experienced a considerable increase in difference; this
is due to the sensor located in the digester tank being
exposed to the gas produced by the biogas longer than
the sensor located in the storage tank.
Figure 6: Calibration of the MQ-136 Sensor.
Figure 6 shows the calibration graph on the MQ- 136
sensor. It can be seen in the picture that the sensor
readings on the storage tank tend to be constant, while
in
the digester tank, it is constantly increasing. In the first
Smart Biogas Plant Monitoring System Using Internet of Things (IoT) Technology
919
calibration, the magnitude of the difference in
readings with a reference of 0.00034 ppm for the
digester tank and 0.00033 ppm for the storage tank.
In the second calibration, the difference in readings is
0.00078 ppm in the digester tank and 0.00038 ppm in
the storage tank. In the third calibration, the MQ-136
sensor readings on the digester tank experienced a
high enough increase to produce a difference of
0.00217 ppm, while the sensors on the storage tank
showed a difference of 0.00035 ppm. The existence
of considerable differences between the two sensors
can be caused by the environmental conditions in the
tank where the sensor is installed. The sensor attached
to
the digester tank is longer exposed to the gases
produced by the biogas, so the sensor undergoes more
ratification than the sensor on the storage tank.
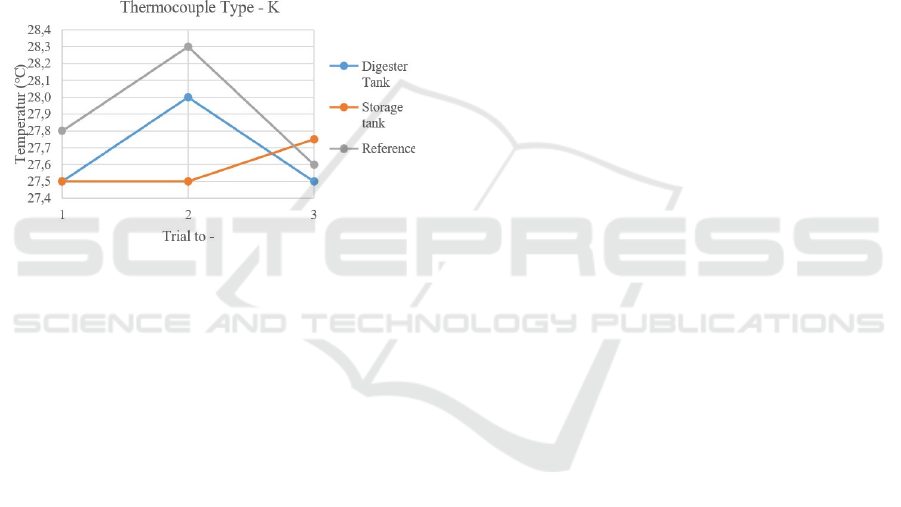
Figure 7: Calibration of K-Type Thermocouple.
Figure 7 is a calibration chart on the K-Type
Thermocouple. Unlike the previous sensors, the
thermocouple reading results are not compared with
secondary data but rather with NTC. In the first
calibration, the thermocouples on the digester tank
and the storage tank showed the same result, so it is
known that the difference is 0.3ºC. In the second
calibration, the digester tank shows a difference of
0.3ºC and in the storage tank 0.8ºC. In the third
calibration, the reading difference between the sensor
and the NTC is 0.1ºC for the digester tank and 0.15ºC
for the storage tank.
5 CONCLUSION
Based on the results of the analysis of the
measurement system in the biogas reactor, it can be
concluded that the measurement results are analyzed
based on the static characteristics of the measuring
instrument, namely accuracy, precision, and linearity.
It is known that the accuracy of the measuring
instrument is compared to secondary data with a not-
so-significant difference; the precision value of the
measuring instrument is analyzed based on the
standard deviation with the results of all measuring
instruments not more than 5.0 so that it can be
concluded that the precision measuring instrument
and linearity value are obtained from the results of
regression calculations with linearity results are not
more than 0.15%, which means that the sensor
reading output shows a deviation of 0.15%
REFERENCES
Sari, I. D. (2019, August). RANCANG BANGUN SISTEM
PENGUKURAN PADA REAKTOR
BIOGAS. In Prosiding Seminar Nasional Teknologi Elektro
Terapan (Vol. 3, No. 1, pp. 11-16).
Wicaksono, A., & Prasetya, H. E. G. (2019, November).
Pengaruh Penambahan EM4 Pada Pembuatan Biogas
dengan Bahan Baku Kotoran Sapi Menggunakan
Digester Fix Dome Sistem Batch. In Prosiding
SENTIKUIN (Seminar Nasional Teknologi Industri,
Lingkungan dan Infrastruktur) (Vol. 2, pp. A5-1).
Abdurrakhman, Arief., Tiyas, Anis W. 2016. Rancang
Bangun Sistem Pengendalian Biogas Bertekanan pada
Biogas Storage Tank System Hasil Purifikasi dengan
Metode Water Scrubber System. Jurnal Teknologi
Terapan, Volume 2 Nomor 2, 1-7.
Suharijanto. 2015. Rancang Bangun Alat Pengaduk Bahan
Biogas Berbasis Mikrokontroler MCS51. Jurnal
Teknik. Vol 7 No 2,703-705.
Fitria, B. 2009. Biogas sebagai Sumber Energi Alternatif.
Semarang.
Obstfeld, M., & Taylor, A. M. (1997). Nonlinear aspects of
goods-market arbitrage and adjustment: Heckscher's
commodity points revisited. Journal of the Japanese and
international economies, 11(4), 441-479.
Wibisono, S. (2005). Enterprise resource planning (erp)
solusi sistem informasi terintegrasi. Dinamik, 10(3).
Gunterus, Frans. (1994). Falsafah dasar : sistem
pengendalian proses (1). Jakarta: Elex Media
Komputindo.
iCAST-ES 2022 - International Conference on Applied Science and Technology on Engineering Science
920
