
Emission Spectrum Analysis of Magnetic Field Controlled Plasma
One-Dimension Jet Array
Changquan Wang
1a
, Haiyun Luo
2b
and Yong Xu
3c
1
School of Urban Safety, Beijing Vocational College of Labour and Social Security, Huixin East Street, Beijing, China
2
Department of Electrical Engineering, Tsinghua University, Beijing, China
3
Yongjia College of Wenzhou Polytechnic, Wenzhou, China
Keywords: Plasma Jet Array, Magnet Confinement, Electron Temperature, Electron Density, Emission Spectrum.
Abstract: For the purpose of studying the discharge plasma parameter of the plasma produced in jet array, emission
spectrums are taken advantage of judging the changes of plasma electron temperature and electron density.
An optical fiber spectrometer is adopted to record the emission spectrum emitted in a homemade one-
dimension jet array discharge plasma system. The research findings show that the electron excitation
temperature increase with the flow rate of discharge gas. Plasma electron density decreases first and then
increases with the velocity of discharge gas flow. It has a minimum value when the flow rate is 5 liters per
minute. These are useful to investigate magnet confined plasma jet array further.
1 INTRODUCTION
Atmospheric pressure plasma jet has the following
advantages, such as low discharge gas temperature,
convenient discharge equipment, easily producing a
large number of highly controllable chemically active
particles and unrestricted size and shape of the
material to be treated, so it has a wide range of
applications in many areas, for example, biomedical
field, material surface treatment field and organic
waste gas treatment and so on (Tendero, 2006, Park,
2018 ). Its shortcoming is small volume of plasma. So
many researchers have combined several small-scale
plasma jet elements into a parallel array which is
called jet arrays (Lu, 2012, Cao, 2009, Lu, 2011).
The jet arrays can be classified two types based on
dimension. One is one-dimensional jet array and the
other is two-dimensional jet array.
Although the magnetic field confined discharge
structure has been testified to promote the discharge
effect in dielectric barrier discharge (Rong, 2006,
Wang, 2011), only a few researchers have studied the
influence of magnet on discharge plasma. Hu et al
(Hu, 2013) investigated the influence of external
a
https://orcid.org/0000-0003-0625-0679
b
https://orcid.org/0000-0002-3346-7948
c
https://orcid.org/0000-0001-9925-2010
magnetic field on DC arc plasma jet and found that
the arc root turns, the curve of the volt-ampere and
power of plasma torch increasing with magnetic field.
There are no more reports about introducing the
magnetic confinement into the plasma jet array in the
other existing studies. Here, the emission spectrum of
discharge plasma is analyzed to obtain the plasma
electron excitation temperature and electron density
by means of one-dimensional plasma jet array
discharge system.
2 EXPERIMENTAL PROCEDURE
The experimental procedure includes a discharge
process done in a homemade experimental system
and spectral testing process carried out by an optical
fiber spectrometer.
2.1 Experimental System
Figure 1 is the schematic diagram of the jet array
experimental system established in this study. The
fluidic array reactor is composed of three single
Wang, C., Luo, H. and Xu, Y.
Emission Spectrum Analysis of Magnetic Field Controlled Plasma One-dimension Jet Array.
DOI: 10.5220/0012004500003612
In Proceedings of the 3rd International Symposium on Automation, Information and Computing (ISAIC 2022), pages 639-643
ISBN: 978-989-758-622-4; ISSN: 2975-9463
Copyright
c
2023 by SCITEPRESS – Science and Technology Publications, Lda. Under CC license (CC BY-NC-ND 4.0)
639
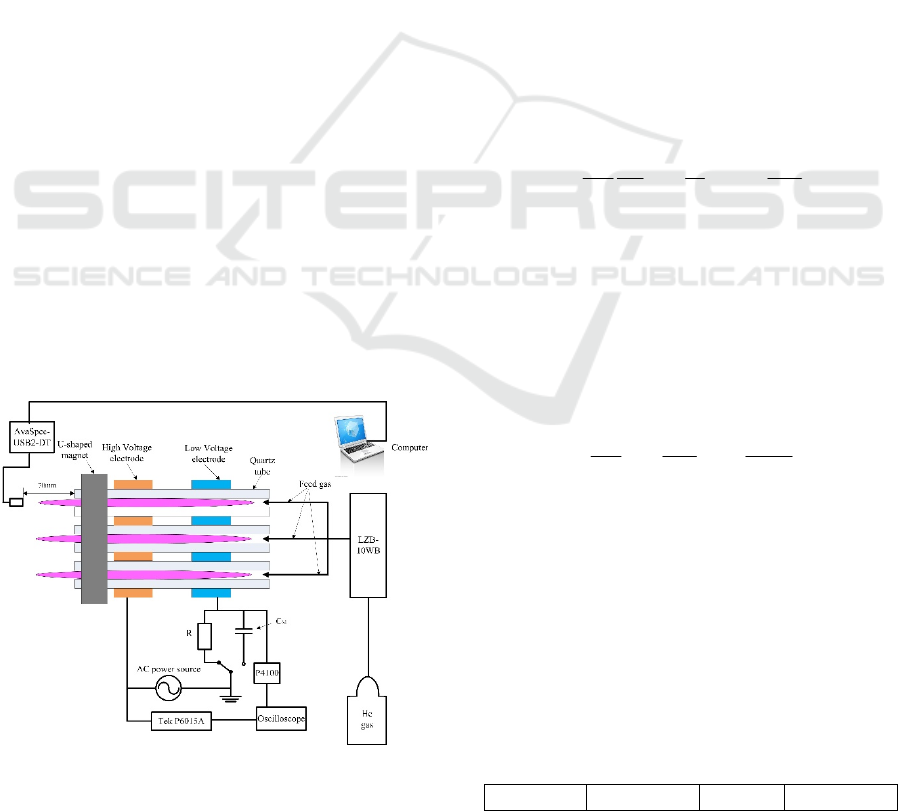
fluidic units arranged in parallel, and the spacing
between quartz tubes is 2 mm. The electrode structure
of single jet unit are two copper rings. The ring
electrodes are wrapped outside the quartz tube. Each
jet unit is composed of quartz tube, low voltage
electrode and high voltage electrode. The size of
quartz tube is 4 mm in outer diameter, 2 mm in inner
diameter, and 100 mm in length. The electrode rings
are cut from a copper pipe with the size of 6 mm in
outer diameter, 4 mm in inner diameter and 30 mm in
length. The distance between the outer side of the
high voltage electrode and the quartz nozzle is 50
mm. The experimental gas is He gas (99.99% volume
fraction), which is controlled by LZB-10WB
flowmeter and passed into the quartz tube. The
measuring range of the flowmeter is 5 ~ 45 L/min. A
power supply with 0 ~ 15 kV and 0 ~ 35 kHz is
adopted here. The high voltage electrode is connected
to high voltage terminal of the power supply. The
ground electrode is connected to the earth with a long
wire. The voltage waveform is measured by a Tek
P6015A probe. The discharge current is gotten by
connecting a 50 Ω non inductive resistor R in
discharge circuit of one-dimensional jet array. The
transfer charge in the discharge space is connected in
series with one non inductive measurement
capacitance C of 0.0068 μF in the discharge circuit.
The discharged voltage-current waveform graphics
and voltage-charge Lissajous images are recorded by
TDS1052B (50MHz, 1GS/s) digital oscilloscope. The
emission spectrums are obtained by means of a
spectrometer with the type of AvaSpeec-USB2-DT.
The spectral wavelength measured is in the range
from 200 nm to 840 nm, and the optical resolution of
the spectrometer is 0.75 nm.
Figure 1: The discharge experimental system.
2.2 Measurement
The emission optical spectrums are measured by
putting an optical fiber probe 70 mm from the quartz
nozzle in different discharge conditions. The
AvaSpeec-USB2-DT spectrometer is connected to a
computer with a USB interface. The spectrum can be
obtained by means of the corresponding software.
The velocity of flow of the discharge gas can be
measured by the LZB-10WB flowmeter. The peak
value of discharge voltage is 15kV, and the discharge
frequency is 28.3 kHz.
Emission spectroscopy is a diagnostic method of
high precision for measuring the electron excitation
temperature and electron density (Song, 2021).
2.2.1 Diagnostic Method of Electronic
Excitation Temperature
Boltzmann slope method is the main method for
diagnosing electron excitation temperature. It is
approximately considered that the plasma jet array is
in LTE state. The relative spectral intensity of a
particle in the excited state when it transitions to a
lower energy level can be described as follows:
1
exp( )
4
k
e
E
hc g
IAN
Z
kT
πλ
=−
(1)
Where, the parameters are Planck constant number
h, vacuum light speed c, spectral line wavelength λ
, transition probability A, total atomic density N,
statistical weight g, distribution function Z, excitation
energy E
k
, Boltzmann constant k and electron
excitation temperature T
e
.
We can get the following formula by taking the
logarithm of both ends of formula (1) at the same
time.
ln ln( )
4
k
e
E
I
hcN
gA kT Z
λ
π
=− +
(2)
It can be seen from formula (2) that as long as the
abscissa Boltzmann fitting diagram is obtained with
ln(I λ /gA) as the vertical coordinate and E
k
as
abscissa. The electron excitation temperature can be
achieved by fitting the slope of the straight line. Here
we use multi spectral lines of He I at 471.3 nm, 667.8
nm, 706.5 nm and 728.1 nm to calculate electron
excitation temperature. And the associated
parameters are listed in table 1.
Table 1: The associated parameters for calculating electron
excitation temperature.
λ/nm
g*A E
i
/eV Transition
ISAIC 2022 - International Symposium on Automation, Information and Computing
640
471.3
1.58ⅹ10
7
23.59 2p
3
- 4s
3
667.8
3.18ⅹ10
8
23.09 2p
1
– 3d
1
706.5
4.64ⅹ10
7
22.71 2p
3
- 3s
3
728.1
1.82ⅹ10
7
22.92 2p
1
- 3s
1
2.2.2 Diagnostic Method of Electronic
Density
Stark broadening has become the main tool to
calculate the electron density because it depends
primarily on the electron density of the plasma. When
only Stark widening is considered and the other
widening mechanisms are ignored, and the electron
density is more than 5ⅹ 10
14
cm
-3
, the expression
between stark broadening of the half height and full
width of the H
α
spectral lines (FWHM) and electron
density is as follows (Feng, 2021):
1.47135
17
10
1.098
A
s
e
N
λ
Δ
=×
(3)
Where, Ne is the electron density, Δλ
A
s
is the full
width at half area of the spectral line.
3 SPECTRUM ANALYSIS
3.1 Jet Plasma Emission Spectrum
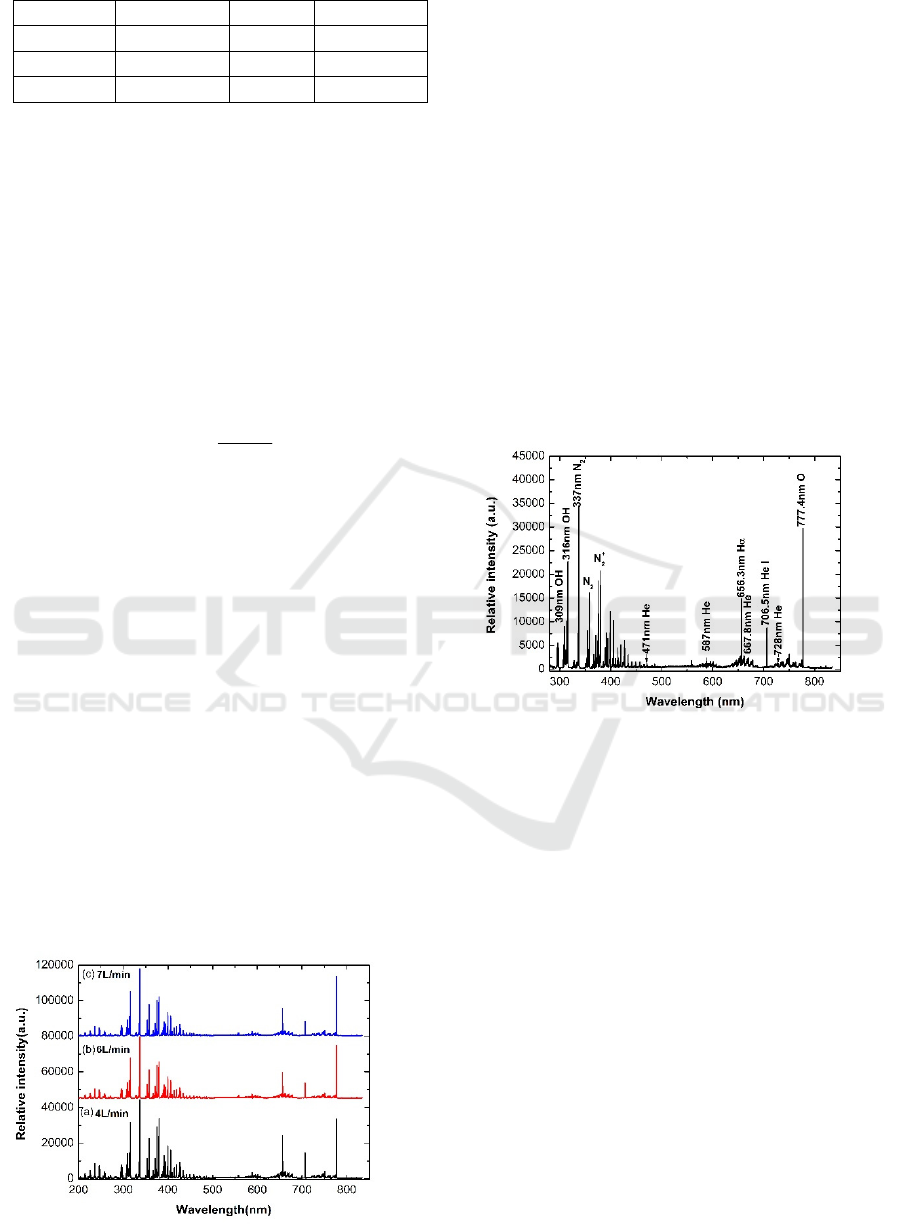
Figure 2 shows some emission spectrum obtained by
the AvaSpeec-USB2-DT spectrometer at different
flow rates of 4L/min, 6L/min and 7L/min of the
discharge gas He. As shown in figure 2, the spectrum
of the plasma in jet array include many spectral lines.
The higher spectral line positions are 308.9 nm, 313.6
nm, 315.9 nm, 337.1 nm, 357 nm, 375.3 nm, 380.3
nm, 399.6 nm, 405.8 nm, 425.9 nm, 656.3 nm, 706.5
nm, 728.3 nm, 750.4 nm and 777.4 nm. There are
different spectral line intensities at different gas flow
rates.
Figure 2: The full emission spectrum of helium plasma jet
array in magnetic confinement at different gas flow rate.
In order to obtain the atomic spectral lines and ion
spectral lines of the emission spectrum, emission
spectroscopy of 6L/min flow rate is analysed and
shown in figure 3.
As shown in figure3, the OH radical’s spectra is
found in 306 ~ 315 nm interval. The first negative
system of N
+
2
ion and the second positive system of
N
2
molecule appear in the interval of 300 ̴ 450nm. It
is also found the O atomic line at 777.4 nm. The
atomic spectral lines are determined by means of the
NIST atomic spectral database (Deng, 2018). Due to
the jet array plasma opened to the atmosphere air, the
spectral lines of N
+
2
ion, N
2
molecules and O atoms
appear. In addition, strong Balmer family line (Hα) is
also found.
Figure 3: The emission spectrum of jet array at 6L/min.
Due to the inelastic collision of high-energy
electrons with nitrogen molecules and oxygen
molecules, N
2
, N
+
2
and oxygen atoms are produced. A
great quantity of metastable helium atoms produced
in the plasma because of collisions. The metastable
helium atoms will also be violent with oxygen
molecules and nitrogen molecules inelastic collision.
The occurrence of OH group and H (Hα)is due to
the ionization of H
2
O in the air.
3.2 Application of Emission Spectrum
3.2.1 Electron Excitation Temperature
According to formula (2), table 1 and the emission
spectrum measured at different flow rate of helium,
we can obtain the electron excitation temperature of
discharge plasma jet array. The changes of the
electron excitation temperature with the error of 10
percent are depicted in figure 4.
Emission Spectrum Analysis of Magnetic Field Controlled Plasma One-dimension Jet Array
641
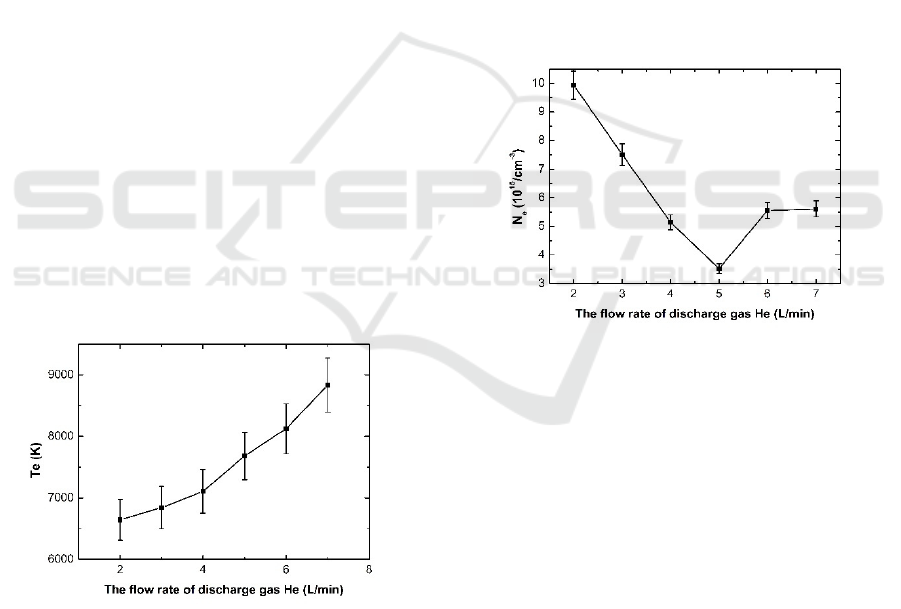
As illustrated in figure 4, the electron excitation
temperature increase with the discharge gas flow rate
which is in accordance with the study of wu et al (Wu,
2015). The jet length of the array becomes longer
with the flow rate increasing in the experimental
conditions. According to discharge theory, free
electrons in the discharge region can be accelerated to
a higher speed under the combination effect of
electric field and magnetic field confinement. As a
result, free electrons get more energy from the
external electric field and make more collisions with
other particles in discharge area. So the excitation
temperature of the electrons will show an upward
trend. Moreover, active particles in discharge plasma
can reduce the breakdown electric field, but the
increase of discharge gas helium flow causes the
Penning ionization process weakening and the
quenching of the active particles remaining in the last
discharge because of the involvement of a large
number of diatomic molecules N
2
with high
vibrational dynamics. Therefore, the increase of the
flow velocity of discharge gas helium leads to the
breakdown electric field increasing. The larger the
breakdown electric field is, the greater the average
energy (electron temperature) of electrons in the
plasma is. With the enlargement of the flow rates of
discharge gas helium, the discharge power also raises
and the electrons can accrue more energies.
Consequently, the electron temperature raises with
the increase of the flow rate of helium gas. The
similar experimental results are reported by Wang et
al (Wang, 2018).
Figure 4: The changes of electron excitation temperature.
3.2.2 Plasma Electron Density
In order to analyse the changes of electron density in
different conditions of the plasma jet array, we record
the relative intensity of the spectral line of Hα at 656.3
nm. It is used to evaluate electron density because of
its stabilization at different electron temperature.
According to formula (3), electron density at different
flow rate of discharge gas helium is computed and
shown in figure 5. It can be seen that electron density
decrease first and then increase as the helium flow
rate increasing. It has a minimum value at 5 litres per
minute. In case of low discharge gas flow rate, the
electron and particles produced in discharge are
mainly in discharge area. As the increasing of flow
rate, lots of high energy electron is blown out the
quartz tube. So the electron with more energy left in
discharge decreases. So the electron density decrease.
The electron density drops to the lowest at the flow
rate of 5 litres per minute. When the flow speed is
more than 5 litres per minute, the helium flow is
strong enough to prevent particle dispersion and the
high energy electron is main in the length of discharge
channel. So stark broadening adds the FWHM of the
Lorentz profile. Thus, electron density increases
slightly when the flow rate is greater than 5 liters per
minute.
Figure 5: The changes of plasma electron density.
4 CONCLUSIONS
A magnet controlled unidimensional plasma jet array
discharge system has been established. It includes
three quartz tubes in line arrangement, a power supply
and corresponding measuring devices. It can run on
atmospheric pressure. With the help of the jet array
system, the effect of helium flow velocity on plasma
parameters has been discussed. From the
experimental results, the plasma parameters are
changed with gas flow velocity in the range of 2 liters
per minute to 7 liters per minute. Meanwhile,
discharge emission spectrums are used to compute
electron temperature and electron density. This
research shows that electron temperature increase
with gas flow rate increasing, and the electron density
ISAIC 2022 - International Symposium on Automation, Information and Computing
642

decrease first then increase with helium flow rate
under magnetic constraint.
ACKNOWLEDGEMENTS
The work is supported by R&D Program of Beijing
Municipal Education Commission (No.
KM201914075001).
REFERENCES
Tendero, C., Tixier, C., Tristant, P., et al, 2006.
Atmospheric pressure plasmas: a review. Spectrochim.
Acta Part B.
Hyun Jung Park, Soon Hee Kim, Hyung Woo Ju, et al,
2018. Microplasma jet arrays as a therapeutic choice for
fungal keratitis. Scientific Reports.
Lu, X., Laroussi, M., Puech, V, 2012. On atmospheric-
pressure non-equilibrium plasma jets and plasma
bullets. Plasma Sour. Sci. Technol.
Cao, Z., Walsh, J.L., Kong, M.G, 2009. Atmospheric
plasma jet array in parallel electric and gas flow fields
for three-dimensional surface treatment. Appl. Phys.
Lett. (2009)
Lu, X, 2011. Plasma jets and their biomedical application.
High Volt. Eng. (in Chinese)
Rong, M.Z., Liu, J.J., Wang, X.H., et al, 2006. Research on
air purification efficiency by nonthermal plasma along
with the application of magnetic field. IEEE Trans.
Plasma Sci.
Wang, C.Q., Zhang, G.X., Wang, X.X., He, X.N, 2011.
Surface modification of polyethyleneterephthalate
(PET) by magnet enhanced dielectric barrier discharge
air plasma. Surf. Coat. Technol.
Hu Ming, Wan Shude, Xia Yangyang, Ren zhencheng, Qiu
zhijian, 2013. Influence and Its mechanism of external
magnetic field on DC ac plasma jet. High voltage
engineering.
Feng BW, Wang RY, MaYu PX, Zhong XX, 2021.
Evolution of electron density of pin-to-plate discharge
plasma under atmospheric pressure. Acta Phys. Sin.
Deng Lei, Zhang Guixin, Liu Cheng, Xie Hong, 2018.
Measurement of the gas temperature in microwave
plasma by molecular emission spectrometry.
Spectroscopy and Spectral Analysis.
Wu Ang Jian, Zhang Hao, Li Xiao Dong, Lu Sheng Yong,
Du Chang Ming, Yan Jian Hua, 2015. Determination of
Spectroscopic Temperatures and Electron Density in
Rotating Gliding Arc Discharge. IEEE Transactions on
Plasma Science
Wang Yongjie, Yin Zengqian, Wang Huijuan, Zhao
Zhanlong, 2018. Optical investigation of a plasma jet
generated by water electrodes at atmospheric pressure.
Optik.
Emission Spectrum Analysis of Magnetic Field Controlled Plasma One-dimension Jet Array
643
