
Structural Characteristics of Winter Phytoplankton Communities in
the Middle and Lower Reaches of the Hanjiang River, China
Di Jia
1,2
, Li Lin
1,2, *
, Lei Dong
1,2
, Xiong Pan
1,2
, Weihua Zhao
1,2
and Sheng Zhang
3
1
Basin Water Environmental Research Department, Changjiang River Scientific Research Institute,
Wuhan, 430010, P.R. China
2
Key Lab of Basin Water Resource and Eco-Environmental Science in Hubei Province,
Wuhan, 430010, P.R. China
3
State Key Laboratory of Pollution Control and Resources Reuse, School of Environment,
Nanjing University, Nanjing, 210023, P.R. China
Keywords: Water Quality, Algae, Functional Groups.
Abstract: The middle and lower reaches of the Hanjiang River of China occupy a very important position in the national
water resources allocation. Since the first outbreak of diatom blooms in the spring of 1992, more than ten blooms
have occurred so far, and the frequency of occurrence has gradually increased, and the outbreaks are mostly
concentrated in the late winter and early spring (January-March). In this study, nine sampling sites were set up
in the middle and lower reaches of the Hanjiang River in January 2020 (winter dry period) to investigate and
analyze the phytoplankton community structure and water quality, and the results showed that 6 phyla and 28
genera of phytoplankton were identified in winter, among which Bacillariophyta accounted for the largest
proportion. The abundance of phytoplankton at each point varied from 0.57×10
6
to 1.88×10
6
cells/L, and the
biomass varied from 0.013 to 0.222 mg/L, which can be divided into 12 functional groups. The important
functional groups are MP, P, D, E, and J, reflecting that the habitats of the middle and lower reaches of the
Hanjiang River are characterized by frequent disturbance, high mixing, and turbid mesotrophic water bodies.
The calculated values of phytoplankton diversity show that the individual distribution of phytoplankton genera
is relatively uneven, and the eutrophication trend is gradually significant from the middle to the lower reaches,
and the water body is generally moderately polluted.
1 INTRODUCTION
The Hanjiang River is the largest tributary in China’s
Yangtze River. The middle and lower reaches of the
Hanjiang River usually refer to the section from
Danjiangkou to Hankou, where the Danjiangkou
Reservoir is the starting point of the South-to-North
Water Diversion Project (He et al., 2007). Therefore,
the middle and lower reaches of the Hanjiang River
occupy a very important position in the national water
resources allocation and the development of the
Hanjiang River ecological and economic zone, and its
water quality safety and water ecology are of great
concern (Li et al., 2022).
Phytoplankton plays an important role in the
material cycle and energy flow of the ecosystem, and
is an important part of the surface water environment.
Their diversity directly affects the functional
structure of the ecosystem
(Cardinale et al., 2002),
which is of great importance in the study of rivers.
Phytoplankton species, community structure,
functional group composition, abundance
distribution, diversity, and other characteristics are
important criteria for evaluating the water quality of
rivers and lakes, and can reflect the pollution of the
water environment (Suikkanen et al., 2007),
phytoplankton has become an important indicator for
biological monitoring and evaluation of water quality,
complementing the physicochemical monitoring of
water quality, and is widely used in the investigation
and analysis of surface water environment at home
and abroad. Han et al. (2012)
analyzed the
phytoplankton community composition, abundance,
and dominant species in Anxing Wetland,
Heilongjiang Province in autumn, and inferred that
the water quality of Anxing Wetland might be
Jia, D., Lin, L., Dong, L., Pan, X., Zhao, W. and Zhang, S.
Structural Characteristics of Winter Phytoplankton Communities in the Middle and Lower Reaches of the Hanjiang River, China.
DOI: 10.5220/0012004700003536
In Proceedings of the 3rd International Symposium on Water, Ecology and Environment (ISWEE 2022), pages 235-242
ISBN: 978-989-758-639-2; ISSN: 2975-9439
Copyright
c
2023 by SCITEPRESS – Science and Technology Publications, Lda. Under CC license (CC BY-NC-ND 4.0)
235
polluted to a certain extent. Zhang et al.
(2022)
analyzed the phytoplankton community structure and
related hydrometeorological factors in the
mainstream of Qiantang River in summer, and found
that temperature and rainfall were the main drivers of
water bloom outbreak.
In recent years, with the repair of water
conservancy projects, the water ecological
environment in the middle and lower reaches of the
Hanjiang River has undergone major changes. Since
the first diatom bloom in the middle and lower
reaches of the Hanjiang River in the spring of 1992,
more than ten blooms have occurred, and the
frequency of the blooms has gradually increased,
mostly in late winter and early spring (January to
March), water blooms seriously affect the life and
health of residents, and also have a negative impact
on the ecological environment (Xin et al., 2020; Wu
et al., 2019; Xin et al., 2019). Understanding the
water quality in the middle and lower reaches of the
Hanjiang River in winter and identifying the key
drivers of phytoplankton growth is important for
scientific prevention and control of water blooms and
for ensuring water and ecological safety in the middle
and lower reaches of the Hanjiang River.
In this study, we identified the structure and
spatial distribution of phytoplankton communities,
conducted statistics on their abundance and biomass,
in the middle and lower reaches of the Hanjiang
River, provided a scientific basis for scientific
assessment of water quality conditions and
prevention of water wars in the middle and lower
reaches of the Hanjiang River, and provided
theoretical support for water quality evaluation and
ecosystem maintenance in the basin. Theoretical
support for water quality assessment and ecosystem
maintenance in the basin.
2 MATERIALS AND METHODS
2.1 Study Area and Sample Site Setup
The Hanjiang River is one of the major tributaries of
the Yangtze River and ranks first in the Yangtze River
system in terms of the watershed area. The
mainstream of the Hanjiang River is divided by the
Danjiangkou, with the upper reaches above the
Danjiangkou; the middle reaches are from the
Danjiangkou to Zhongxiang, with four tributaries
(Beihe River, Nanhe River, Qinghe River, and
Tangbaihe River) joining the middle reaches, passing
through Shiyan, Xiangyang, and Jingmen, with a
length of about 223 km; the lower reaches are from
Zhongxiang to Hankou, passing through Tianmen,
Qianjiang, Xiantao, Hanchuan and Wuhan in turn,
with a length of about 382 km, finally joining the
Longwangmiao in Wuhan. Yangtze River. The
middle and lower reaches of the Hanjiang River (111
°~115°E, 30°~33°N) are located in Hubei Province,
with the Danjiangkou, Wangfuzhou, Cuijiaying,
Xinglongzha, and other water conservancy hubs, and
the middle reaches are wider than the upper valleys,
with less flooding capacity and a gradually narrowing
river channel downstream. The average annual
temperature of the basin is about 15~17℃, and the
average annual precipitation is 800~900 mm.
According to the geographic location,
hydrological characteristics, and location of water
resources hubs in the middle and lower reaches of the
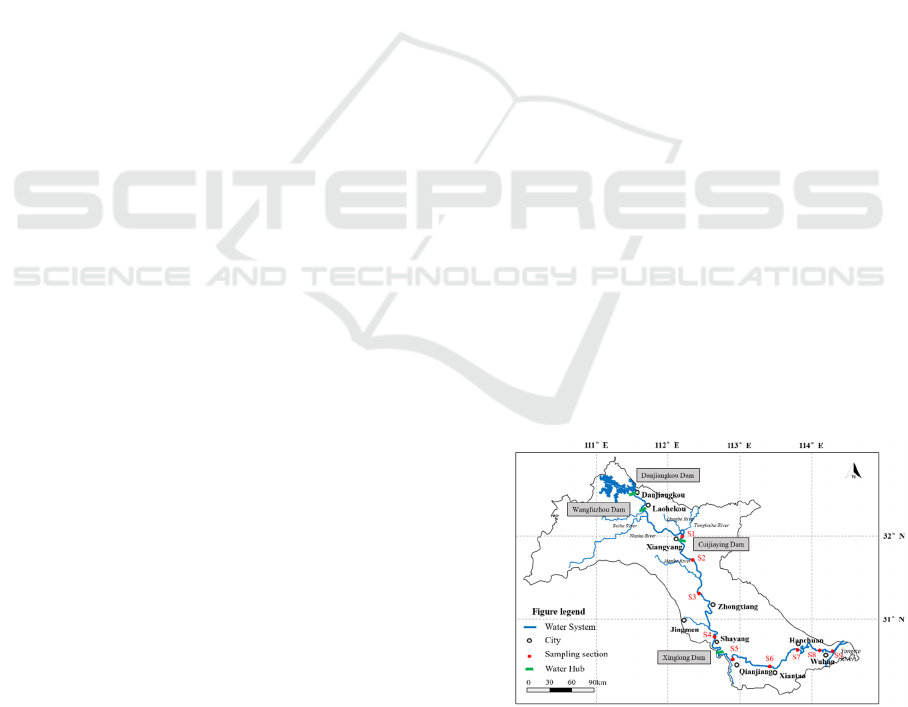
Hanjiang River, nine sampling points (Figure 1), S1
at Yujiahu hydrological station in Xiangyang, S2 at
the Hanjiang Bridge, downstream of Yicheng city, S3
at Linkuang county in Zhongxiang city, S4 at
Shayang hydrological station in Jingmen city, S5 at
Qianjiang hydrological station in Qianjiang city, S6
upstream of Xiantao city, S7 at Makou upstream of
Hanchuan city, S8 upstream of Wuhan city, and S9 at
Longwangmiao in Wuhan city. The survey of the
above sampling sites was launched in January 2020
(winter dry period).
Figure 1: Distribution of phytoplankton sampling sites.
ISWEE 2022 - International Symposium on Water, Ecology and Environment
236

2.2 Sample Collection and Processing
Phytoplankton sampling was carried out according to
Methods for Freshwater Phytoplankton Research
(Zhang et al., 1991). Qualitative samples were taken
using a No. 25 phytoplankton net and repeatedly
dragged at a water depth of 0.5 m for 3~5 min with
the figure "∞". Transfer the concentrated solution to
a 50 mL plastic bottle, add Lugol's reagent for
fixation, and bring it back to the laboratory to refer to
Freshwater Microbiological Atlas
(Zhou, 2005)
and
Freshwater algae in China: System, ecology, and
taxonomy (Hu et al., 2006)
for species classification
identification, phytoplankton pollution indicator
species analysis method reference New technology of
microbiological monitoring (Shen et al., 1994) and
Environmental and Biological Indicator (water
volumes) (Ecological Society of Japan Panel on
Environment, 1987).
Part of the conventional water quality physical
and chemical indicators with multi-parameter water
quality instrument (YSI EXO2, USA) for on-site
determination, the measured water body physical and
chemical indicators including water temperature
(WT), dissolved oxygen (DO), pH, total dissolved
solids (TDS), redox potential and conductivity, etc.
The distribution of each sampling point and the basic
conditions of the environment are shown in Table 1.
Table 1: Basic information on sampling sites in the middle and lower reaches of the Hanjiang River.
2.3 Phytoplankton Diversity
Calculation
2.3.1 Margalef Diversity Index (D)
(1)
Where: S is the number of species in the sample, and
N denotes the total number of individuals of all
species in the sample. d>3 is light or no
contamination; 1<d≤3 is medium contamination; 0<
d≤1 is heavy contamination (Hu et al., 2015).
2.3.2 Shannon-Wiener Index (
′
)
(2)
(3)
Where: n
i
is the number of individuals of the ith
species, N denotes the total number of individuals of
all species in the sample, and S is the number of
species in the sample. The Shannon-Wiener index
reflects the diversity of phytoplankton in the water
column and the complexity of the community (
Table
2).
Samplin
g site
Geographical
coordinates
Water
temperature/℃
p
H
Dissolved
oxygen/(mg/L)
Total
dissolved
solids /(mg/L)
S1
112°8′54″E, 31°57′8″N
10.828 9.58 10.07 143
S2
112°17′36″E, 31°43′26″N
10.727 7.96 10.78 71
S3
112°26′19″E, 31°18′24″N
10.304 7.96 10.84 93
S4
112°36′15″E, 30°41′49″N
9.178 8.23 11.16 103
S5
112°52′16″E, 30°29′32″N
9.211 7.91 11.4 111
S6
113°27′58″E, 30°23′6″N
8.274 8.01 11.78 103
S7
113°56′27″E, 30°39′42″N
9.22 8.14 11.59 109
S8
114°2′9″E, 30°35′37″N
7.779 7.85 11.61 104
S9
114°17′8″E, 30°33′52″N
8.375 8.13 11.13 107
Structural Characteristics of Winter Phytoplankton Communities in the Middle and Lower Reaches of the Hanjiang River, China
237

Table 2: Shannon-Wiener index grading evaluation criteria
(Tilman et al., 1976).
2.3.3 Pielou's Evenness Uniformity Index (J)
(4)
Where:
is the Shannon-Wiener index, S is the
number of species in the sample. J value of 0.5 to 0.8
is light contamination; J value of 0.3 to 0.5 is
moderate contamination; J value of 0 to 0.3 is heavy
contamination
(Shen et al., 1994).
2.4 Data Analysis
The species data and environmental data were
compiled, statistically analyzed, and plotted using
Microsoft Office 2020, SPSS, and Origin 2021 for
Windows.
3 RESULTS
3.1 Phytoplankton Species
Composition, Density, and Biomass
Analysis
During the survey, microscopic examination
identified 28 genera of phytoplankton in 6 phyla, of
which Bacillariophyta was the most important group,
with 13 genera, accounting for 46.4% of the total
number of genera; Chlorophyta has 5 genera,
accounting for 17.9% of the total number of genera;
Cyanobacteria has 4 genera, accounting for 14.3% of
the total number of genera; Dinoflagellates has 1
genus, accounting for 3.6% of the total number of
classes; Cryptophyta has 2 genera, accounting for
7.1% of the total number of classes; Chrysophyta has
3 genera, accounting for 10.7% of the total number of
classes.
Figure 2: Spatial variation of phytoplankton abundance (a),
biomass(b) in the middle and lower reaches of the Hanjiang
River.
Index Range Level Status Water pollution level
>3 Enrichment Species richness and even distribution of individuals Cleaning
2<
≤3 Richer
High species richness and relatively even distribution
of individuals
Light pollution
1<
<2 General
Species richness is low, and individuals are relatively
evenly distributed
Medium pollution
0<
≤1 Poor
Low species richness and uneven distribution of
individuals
Heavy pollution
=0 Extremely poor Species homogeneity and basic loss of diversity Severe pollution
a
S1 S2 S3 S4 S5 S6 S7 S8 S9
0.0
0.5
1.0
1.5
2.0
total abundance
Chrysophyta
Cryptophyta
Pyrrophyta
Bacillariophyta
Chlorophyta
Cyanophyta
phytoplankton abundance/(10
6
cells/L)
Sampling section
b
S1 S2 S3 S4 S5 S6 S7 S8 S9
0.00
0.05
0.10
0.15
0.20
0.25
total biomass
Chrysophyta
Cryptophyta
Pyrrophyta
Bacillariophyta
Chlorophyta
Cyanophyta
phytoplankton biomass/(mg/L)
Sampling section
ISWEE 2022 - International Symposium on Water, Ecology and Environment
238
The total cumulative abundance of phytoplankton
in the middle and lower reaches of the Hanjiang River
was 9.12×10
6
cells/L, of which the diatom abundance
was the largest at 5.16×10
6
cells/L, accounting for
56.60%, followed by Cyanobacteria at 1.90×10
6
cells/L, accounting for 20.89%. The total
phytoplankton biomass was 0.811 mg/L, of which
diatom biomass reached 0.585 mg/L, accounting for
72.16% (
Figure 2 a).
The phytoplankton abundance and biomass have
obvious spatial distribution differences, and the
variation of abundance at each point ranges from
0.57×10
6
to 1.88×10
6
cells/L, with the mean value of
1.01×10
6
cells/L; the variation of biomass ranges
from 0.13 to 2.22 mg/L, with a mean value of 0.90
mg/L. From
Figure 2(b) it can be found that the
phytoplankton abundance and biomass downstream
increased gradually. Abrupt increase in
cyanobacterial abundance and biomass in the lower
reaches of Yicheng city(S2); the abundance and
biomass of Chlorophyta increased significantly
downstream of Wuhan City at Longwangmiao (S9);
the abundance of diatoms showed a general
increasing trend along the course, and the biomass
reached a high level in the Linkuang town (S3) and
the upstream of Wuhan (S8); the peak abundance and
biomass of Chrysophyta appeared in the upstream of
Xiantao (S6) and Longwangmiao (S9), respectively.
3.2 Classification of Phytoplankton
Functional Groups
Ecologically, phytoplankton with similar habits and
survival strategies are grouped into “functional
groups”, which reflect certain habitat characteristics.
According to the classification of phytoplankton
functional groups by Reynolds et al. (2002) and Hu
Ren et al. (2015), the phytoplankton in the middle and
lower reaches of the Hanjiang River can be divided
into 12 functional groups (Table 3): B, C, D, E, J, Lo,
MP, P, S1, X2, X3, Y; among them, there are five
common functional groups with frequencies greater
than 65%, namely B, D, E, MP, X2, where B and MP
functional groups occur in each sampling site. The
functional groups with relative biomass greater than
10% are defined as important functional groups, and
there are five of them, namely MP, P, D, E, and J. The
dominant functional groups are B, MP, D, S1, E, X2,
and P. The functional groups reflect that the habitats
in the middle and lower reaches of the Hanjiang River
are characterized by frequent disturbance, high
mixing, and turbid moderately eutrophic water bodies.
3.3 Species Diversity of Phytoplankton
Communities and Biological
Evaluation of Water Quality
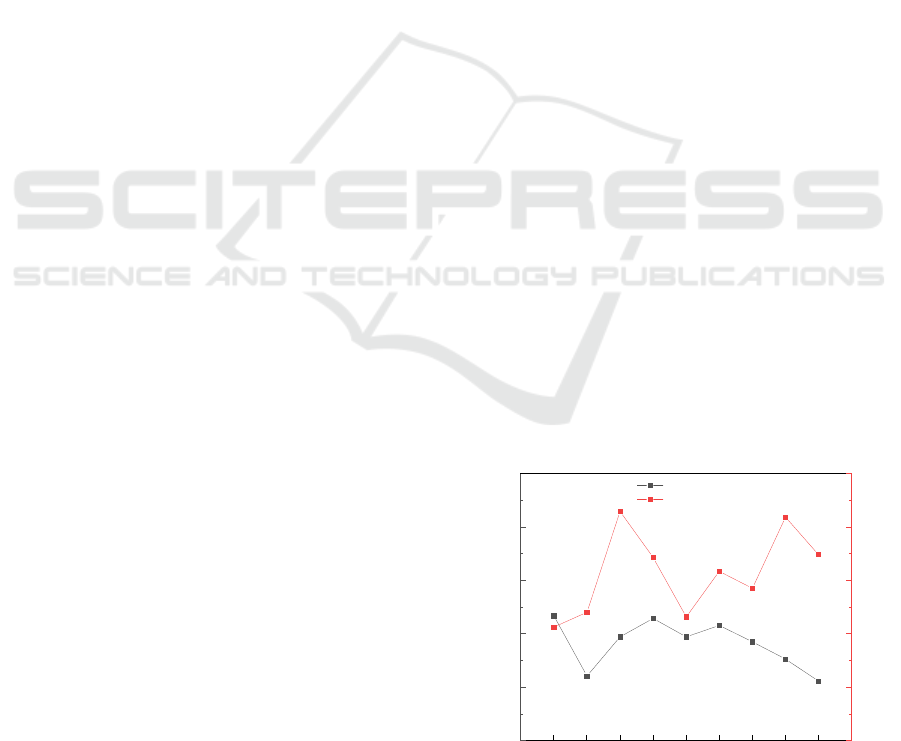
The results of phytoplankton diversity index
calculation are shown in Figure 3.
The Margalef diversity (d) in the middle
and lower reaches of the Hanjiang River ranges from
2.223 to 2.467, with a mean value of 2.364, 1< d ≤
3, indicating that the overall pollution level in the
middle and lower reaches of the Hanjiang River is
medium; the Shannon-Wiener index (
) ranges
from 1.063 to 2.147, with a mean value of 1.571,
indicating that the overall phytoplankton in the
middle and lower reaches of the Hanjiang River is
more evenly distributed but generally abundant, and
the water quality is α-medium pollution level, only
the Linkuang County and the upper reaches of Wuhan
are more abundant, and the water quality is β-medium
pollution; Pielou's evenness uniformity index J
ranges from Pielou's evenness index (J) ranges from
0.319 to 0.644, with a mean value , indicating
that the distribution of individual genera in the middle
and lower reaches of the Hanjiang River is uneven,
and the water body is moderately polluted overall
indicates that the eutrophication
trend of the Hanjiang River from the middle to the
lower reaches of the river is gradually significant, and
the pollution level changes from mild to moderate.
Figure 3: Phytoplankton diversity index in the middle and
lower reaches of the Hanjiang River.
S1 S2 S3 S4 S5 S6 S7 S8 S9
2.0
2.2
2.4
2.6
2.8
3.0
Margalef Diversity Index (d)
Shannon–Wiener Index (H'e)
sampling section
Margalef Diversity Index (d)
0.0
0.5
1.0
1.5
2.0
2.5
Shannon–Wiener Index (H'e)
Structural Characteristics of Winter Phytoplankton Communities in the Middle and Lower Reaches of the Hanjiang River, China
239

Table 3: Phytoplankton functional groups and representative species in the middle and lower reaches of the Hanjiang River.
4 DISCUSSION
The succession of phytoplankton communities is
influenced by many factors, and the succession of
functional groups corresponds to habitat changes, and
changes in nutrient salinity and disturbance level of
water bodies will cause corresponding changes
(Tilman et al., 1976). In this study, Diatoms were
found to be the dominant species in the middle and
lower reaches of the Hanjiang River, and the
frequency of population distribution showed that
Cyclotella sp. of the Bacillariophyta was found in all
sampling sites with the highest frequency of 100%,
followed by Synedra sp. of the Bacillariophyta with a
frequency of 78%, Mallomonas sp. of the
Chrysophyta and Navicula sp. of the Bacillariophyta
reached 67%. From
Figure 2 the Cyanobacteria in
downstream of Xiangyang and Yicheng in the
midstream section were larger and more numerous,
Functional
groups
Represent genus/species
in the groups
Phylum Functional Group Habitat Characteristics
B Cyclotella sp. Bacillariophyta
Mesotrophic small and medium-sized water
bodies, sensitive to stratification, silica
deficiency
C Asterionella formosa Bacillariophyta
Eutrophic small to medium-sized lakes,
sensitive to stratification
D Synedra sp. Bacillariophyta
Nutrient-rich turbid shallow water bodies,
sensitive to nutrient deficiencies
E Dinobryon sp., Mallomonas sp. Chrysophyta
Small shallow water bodies of poor or
mesotrophic type
J
Pediastrum simplex var.
duodenarium, Crucigenia tetrapedia
Chlorophyta Mixed highly eutrophic shallow water bodies
Lo Merismopedia sp., Peridinium sp.
Cyanophyta
Dinoflagellates
Wide applicability, poor to eutrophic, deep or
shallow, medium to large water bodies
MP
Navicula sp., Cymbella sp,
Cocconeis sp, Pinnularia sp.,
Stauroneis sp.
Bacillariophyta
Frequent disturbance of turbid shallow water
bodies
P
Melosira sp., Melosira granulata
var. angustissima
Bacillariophyta
Highly mixed medium eutrophic shallow
water bodies
S1
Planktothrix sp., Dactylococcopsis
sp., Planktolyngbya sp.
Cyanophyta
Medium to eutrophic, mixed water bodies,
low transparency
X2
Chlamydomonas sp.,
Plagioselmis sp.
Chlorophyta
Cryptophyta
Highly mixed medium-eutrophic shallow
water bodies
X3 Cymatopleura sp., Schroederia sp.
Bacillariophyta
Chlorophyta
Shallow mixed water bodies, sensitive to
grazing action
Y Cryptomonas sp. Cryptophyta
Medium to the eutrophic hydrostatic
environment, sensitive to phagocytosis
ISWEE 2022 - International Symposium on Water, Ecology and Environment
240
especially downstream of Yicheng, indicating the
deepening of eutrophication in the water body; the
percentage of Diatom increased significantly in the
phosphate mining county of Zhongxiang, replacing
Cyanobacteria the dominant species.
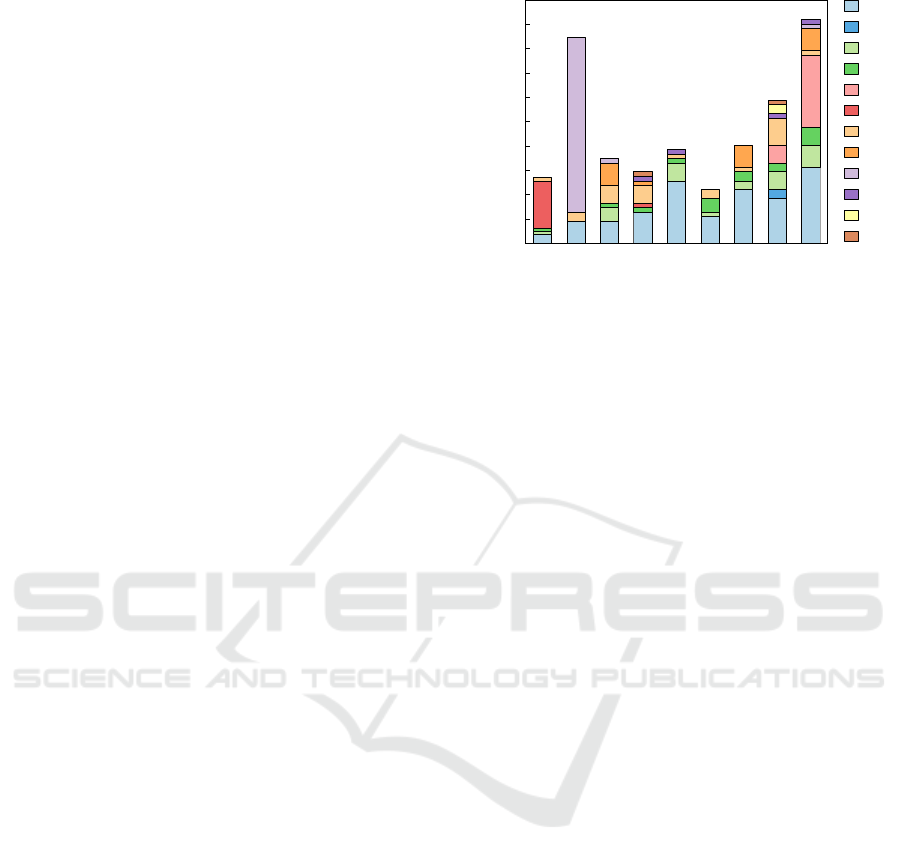
Figure 4 is the histogram of the abundance of
functional groups stacked at each sampling site, from
Figure 4 the abundance of functional group S1
increased dramatically in the downstream of Yicheng
city increased dramatically, and the number and
biomass of cyanobacteria increased, which indicates
that the pollution is more serious, the water body is
highly mixed, and the transparency is low; the
abundance of functional group J in the upstream and
downstream of Wuhan increased, and the pollution
indicator level is β-medium pollution, which
indicates that this section is a mixed highly eutrophic
diving water body. Upstream of Xiantao (S6), the
abundance of the E functional group is high, and the
number of Chrysophyta has increased significantly,
indicating that the water quality here is better.
Sampling sites S2 (downstream of Yicheng) and S9
(downstream of Wuhan) are urban downstream, and
S6, S7, and S8 are urban upstream. Comparing their
phytoplankton species and functional groups, we can
find that the populations of oligotrophic and α-
medium fouling species are larger in the upstream, the
frequency of β-medium fouling indicator species in
the downstream has increased and the proportion is
larger, the abundance of phytoplankton in the
downstream is relatively high, and the changes of
functional groups are consistent with the
environmental conditions, so it is concluded that the
water quality in the middle and lower reaches of the
Hanjiang River is polluted to some extent. Comparing
the upstream and downstream Margalef diversity
indices (d), we can find that d
S1
and d
S3
are larger than
d
S2
, and the d value of the S6-S9 section continues to
decrease; the above performance indicates that the
water quality downstream of the city is inferior to that
in the upstream, which is related to the discharge of
sewage from urban towns and cities, and the
discharge of urban sewage has a greater impact on
water quality and phytoplankton community
succession.
Figure 4: Composition of phytoplankton functional groups
in the middle and lower reaches of the Hanjiang River.
The phytoplankton community composition in the
middle and lower reaches of the Hanjiang River is not
significantly different from that of other scholars, and
the phytoplankton community is composed of
Diatom, Chlorophyta, Cyanobacteria, and others
(Dinoflagellates and Chrysophyta) in descending
order, with Cyclotella sp. as the absolute dominant
species, indicating that the water quality is still
acceptable. However, the abundance of
phytoplankton showed an upward trend along the
river, which also reflected that the pollution gradually
increased from the middle stream to the downstream.
5 CONCLUSION
A total of 28 genera of 6 phytoplankton were
identified in the middle and lower reaches of the
Hanjiang River, among which Bacillariophyta
accounted for the largest proportion, followed by
Chlorophyta and Cyanobacteria; Cyclotella sp. were
the absolute dominant species. Phytoplankton could
be divided into 12 functional groups, B, C, D, E, J,
Lo, MP, P, S1, X2, X3, Y: the range of abundance
variation at each site was 0.57×10
6
~1.88×10
6
cells/L,
and the biomass ranged from 0.013 to 0.222 mg/L.
The important functional groups were MP, P, D, E,
and J, reflecting that the habitat of the middle and
lower reaches of the Hanjiang River is characterized
by frequent disturbance, high mixing, and turbid
Meso-eutrophic water bodies. The Margalef diversity
index (d) ranged from 2.223 to 2.467, and the
Shannon-Wiener index (
) ranged from 1.063 to
S1 S2 S3 S4 S5 S6 S7 S8 S9
0.0
0.2
0.4
0.6
0.8
1.0
1.2
1.4
1.6
1.8
2.0
algal abundance/(×10
6
cells/L)
sampling section
B
C
D
E
J
Lo
MP
P
S1
X2
X3
Y
Structural Characteristics of Winter Phytoplankton Communities in the Middle and Lower Reaches of the Hanjiang River, China
241

2.147, and Pielou's evenness uniformity index J
ranged from 0.319 to 0.644, indicating that the
distribution of phytoplankton genera in the middle
and lower reaches of the Hanjiang River was not
uniform, and the eutrophication trend from the middle
to the lower reaches was significant, and the water
body was moderately polluted
ACKNOWLEDGEMENTS
This study is supported by the fundamental esearch
Funds for Central-level Public Welfare Research
Institutes (No. CKSF2021480/SH).
REFERENCES
He L, Zhang B, Liu SP, et al. Hydrological characteristics
and fishery resources status of mid-lower Hanjiang
River. Chinese Journal of Ecology, 2007(11): 1788–
1792. DOI: 10.13292/j. 1000—4890.2007.0320.
Li J, Yin W, Jia HY, et al. Study on the ecological
regulation of algal bloom control in the middle and
lower reaches of the Hanjiang River. Journal of Lake
Sciences, 2022, 34(03): 740–751. DOI
10.18307/2022.0304
Cardinale B J, Palmer M A, Collins S L. Species diversity
enhances ecosystem functioning through interspecific
facilitation. Nature, 2002, 415(6870): 426-429.
DOI:10.1038/415426a.
Suikkanen S, Laamanen M, Huttunen M. Long-term
changes in summer phytoplankton communities of the
open northern baltic sea. Estuarine, Coastal and Shelf
Science, 2007, 71(3-4): 580-592. DOI:
10.1016/j.ecss.2006.09.004.
Han HH, Fan YW. Phytoplankton community structure in
autumn of Anxing Wetland, Heilongjiang Province.
Journal of Lake Sciences, 2012, 24(04): 577-585.
Zhang P, Guo CX, Yu J, et al. Characteristics of
phytoplankton community structure and its response to
hydro-meteorology in summer of Qiantang River [J].
Journal of Lake Sciences, 2022, 34(02): 418-432. DOI
10.18307/2022.0205.
Xin X, Zhang H, Lei P, et al. Algal blooms in the middle
and lower Hanjiang River: characteristics, early
warning and prevention. Science of The Total
Environment, 2020, 706: 135293. DOI:
10.1016/j.scitotenv.2019.135293.
Wu WJ, Chen XF. Study on the Formation of Diatom
Blooms in the Middle and Lower Reaches of the
Hanjiang River during Winter and Spring.
Environmental Science & Technology, 2019, 42(09):
55-60. DOI: 10.19672/j.cnki.1003-6504.2019.09.009.
Xin XK, Wang YC, Hu S, et al. Cause Analysis of Diatom
Bloom of Lower Reaches of Hanjiang River in 2018.
Water Resources and Power, 2019, 37(03): 25-28.
Zhang ZS, Huang XF. Research methods of freshwater
plankton. Science Press, 1991.
Zhou FX. Freshwater Microbiological Atlas. Chemical
Industry Press, 2005.
Hu HJ, Wei YX. Freshwater algae in China: System,
ecology and taxonomy. Science Press, 2006.
Shen YF, Gu MR, Gong XJ, et al. New technology of
microbiological monitoring. China Architecture and
Construction Press, 1994.
Ecological Society of Japan Panel on Environment.
Environmental and Biological Indicator (water
volumes). Beijing: China Environmental Science Press,
1987:69-98. (in Chinese).
Reynolds C S, Huszar V, Kruk C, et al. Towards a
functional classification of the freshwater
phytoplankton. Journal of Plankton Research, 2002,
24(5): 417–428. DOI:10.1093/plankt/24.5.417.
Hu R, Lan YQ, Xiao LJ, et al. The concepts, classification
and application of freshwater phytoplankton functional
groups. Journal of Lake Sciences, 2015, 27(01): 11–23.
Tilman, David, Kilham, et al. Phosphate and silicate growth
and uptake kinetics of the Bacillariophyta asterionella
formosa and cyclotella meneghiniana in batch and
semicontinuous culture1. Journal of Phycology, 1976.
DOI:10.1111/j.0022-3646.1976.00375. x.
ISWEE 2022 - International Symposium on Water, Ecology and Environment
242
