Study on the Status and Problems of Domestic Waste Management in
China
Songwang Yang
1,* a
, Zhong Sun
2,† b
, Zizhao Zhao
1
, Hongyu Chen
1
, Na Dou
1
, Yao Zhao
1
,
Shuwei Zhang
1
and Guozhong He
1,‡ c
1
School of Public Health, Kunming Medical University, Kunming, China
2
Faculty of Medicine & Health Sciences, Universiti Putra Malaysia, Selangor, Malaysia
Keywords: Waste Management, Domestic Waste, Waste Disposal Capacity, Ecological Environment.
Abstract: Objective: This study aims to present publicly available data from the 2011-2020 China Statistical Yearbook,
analyze the status of domestic waste management in China, and create a prognostic model based on the data
analysis. Methods: By consulting the 2011-2020 China Statistical Yearbook results, this paper analyzes the
domestic waste collection and disposal in the recent ten years. A prognostic model is established to study and
identify the development trend of China’s domestic waste collection gap and disposal capacity gap in the next
five years. Results: China’s domestic waste output increased gradually from 2010 to 2019. In 2019, the
domestic waste output increased by 508.9 million tons compared with 2010, with an increased rate of 147%.
In 2019, China’s domestic waste collection gap was 612.8 million tons, with an increased rate of 144.9%
compared with 2010. In 2010 and 2019, China’s harmless disposal capacity gaps were 56.0 tons/day and
147.2 tons/day, respectively. Through the establishment of the prognostic model, the domestic waste
collection gap and harmless disposal capacity gaps in China are expected to reach 823.7 million tons and
196.2 tons/day by 2024. Conclusion: The annual increase of waste output in China is related to the increase
of per capita GDP. The waste collection and harmless disposal capacity gaps in China may continue to grow.
1 INTRODUCTION
Waste is produced by humans in their everyday life.
Due to its large discharge, complex and diverse
composition, it will pollute the environment and
affect environmental health (Xiaoyu L et al.,2019).
Waste disposal is to remove the waste quickly, carry
out harmless disposal, and finally make rational use
of it. The data from the Annual Report on the
Prevention and Control of Solid Waste Pollution in
China in 2019 shows that Shanghai has the largest
domestic waste output, with the output of 10.768
million tons, followed by Beijing, Guangzhou,
Chongqing and Shenzhen, with the output of 10.012
million tons, 8.088 million tons, 7.381 million tons,
and 7.124 million tons, respectively (China Waste
Official report,2020). In recent years, in the more
developed cities, urban domestic waste has also been
rising. It is of great significance to enhance the
a
https://orcid.org/0000-0002-7522-053X
b
https://orcid.org/0000-0002-3100-5053
c
https://orcid.org/0000-0001-8022-5012
capacity of waste collection and disposal in China, to
strengthen the conservation of China’s (Yujun Y et
al.,2020) ecological environment, beautify the living
environment and improve population health.
Although domestic waste management has
achieved certain results in the context of the 13th
Five-Year Plan for Economic and Social
Development of the People’s Republic of China (The
13th five-year plan of the people's Republic of
China,2016). However, there is still a management
gap (Zongguo W et al.,2021) for domestic waste
collection and disposal in China. The key to solving
domestic waste output (Hua Z et al.,2021) in China is
to control the growth of waste output and strengthen
the effective disposal of waste. On the one hand, with
the development of China’s economy and the growth
of per capita GDP, although the consumption level of
residents continues to improve, the output of
domestic waste also increases; on the other, there is a
256
Yang, S., Sun, Z., Zhao, Z., Chen, H., Dou, N., Zhao, Y., Zhang, S. and He, G.
Study on the Status and Problems of Domestic Waste Management in China.
DOI: 10.5220/0012007800003536
In Proceedings of the 3rd International Symposium on Water, Ecology and Environment (ISWEE 2022), pages 256-260
ISBN: 978-989-758-639-2; ISSN: 2975-9439
Copyright
c
2023 by SCITEPRESS – Science and Technology Publications, Lda. Under CC license (CC BY-NC-ND 4.0)
phenomenon that the output of domestic waste is far
larger than the amount of waste collection and
disposal (Xiangru L et al.,2019), and that the
domestic waste in China has not been collected and
disposed of effectively, so the gap of waste collection
and disposal increases. Few scholars study waste
collection and disposal to identify the pain point and
the difficulty of the current waste management from
a macro perspective.
Therefore, based on the current situation of the
growth of domestic waste in China and the analysis
of the insufficient waste collection and transportation
(WCT) and harmless disposal capacity (HDC) of
domestic waste, to review and find out waste
collection gap (WCG) and harmless disposal capacity
gap (HDCG) of domestic waste in China (Maarten
D,2021) is conducive to the effective management of
domestic waste and environmental protection.
2 METHODS
This study obtains data from the public data sources
from the China Statistical Yearbook 2011-2020.
Domestic waste in China is described by the data of
the population, GDP, waste collection, and waste
harmless disposal capacity in the China Statistical
Yearbook. Through research on previous literature
(George H et al.,2020) on domestic waste, we get the
decision coefficient between per capita GDP of China
and waste output per capita which is 0.086 (Statistics
of domestic waste treatment industry,2020); based on
this decision coefficient, the waste output per capita
(WOPC) can be calculated directly. It means that
every 0.086 tons of waste can be produced by
RMB10,000 per capita GDP. We construct the
following three related formulas (Table 1.) to do the
calculation with the specific multiplying the
population at the end of the year, the annual per capita
GDP, and decision coefficient (Formula 1).
Meanwhile, Formula 1 shows that the domestic
waste collection in China is less than the output, so
there will be a difference between the domestic waste
output and the collection amount. Therefore, the
annual waste collection gap (WCG) can be calculated
(Formula 2). Based on the AAWO, the daily waste
output can be obtained by dividing the number of
days of the corresponding year. It is found that the
waste output is also different from the harmless
disposal capacity of domestic waste. The gap of
harmless disposal of waste can be calculated
(Formula 3). Based on formulas 2 and 3, the gap of
waste collection and the harmless disposal capacity
gap are dependent variables. Taking the annual unit
time as the independent variable, the general time
series prediction model is constructed with the
application of SPSS 21.0 to forecast the trend of the
WCG and HDCG in the next five years.
Table 1. Related calculation formula.
Formulas Variables(10
4
p
eople, ¥
10
4
,10
4
·tons,to
ns/day
Interpretati
on of
variables
(1) AAWO=0.086
·
PL
·
GDP
PL PL=populat
ion
(2) WCG=AAWO-
WCT
AAOW
WCG
AAWO=
average
annual
output of
waste
WCG=wast
e collection
gap
(3) HDCG=(AAWO/
YDAY)-HDC
WCT
HDCG
WCT=wast
e collection
and
transportati
on
HDCG=har
mless
disposal
capacity
gap
HDC HDC=harm
less
disposal
capacit
y
YDAY YDAY=da
ys
correspondi
ng to the
correspondi
ng yea
r
3 RESULTS
We can see from table 2 that from 2010 to 2019
China’s total population increased by about 60
million, with a population growth rate of about 4.5%.
China’s per capita GDP was RMB30,000 in 2010 and
RMB71,000 in 2019, an increase of RMB41,000 in
10 years, with a growth rate of 136%. With the growth
of population and GDP, we can see that the waste
output per capita (WOPC) and average annual waste
output (AAWO) gradually increase. At the same time,
we can see that China’s WCT also grew rapidly. In
2010, China’s domestic WCT and HDC were 15804.8
tons and 38.8 tons/day, respectively. In 2019, China’s
Study on the Status and Problems of Domestic Waste Management in China
257
domestic WCT and HDC were 24206.2 tons and 87.0
tons/day, respectively. Compared with 2010, the
amount of waste collection and transportation in 2019
increased by 84.014 million tons, with a growth rate
of 53.2%. The efficiency of harmless disposal
capacity of waste in China in 2019 was about 2.2
times greater than that in 2010.
Table 2. Waste collection and disposal capacity.
Year
s
Pop
ulati
on
(10
4
)
GD
P
(10
4
·¥)
WO
PC
(ton
s)
AA
WO
(10
4
·t
ons)
WC
T
(10
4
·ton
s)
HDC
(tons/
day)
2010 134
091
3.0 0.25
8
3459
5.5
158
04.8
38.8
2011 134
735
3.5 0.30
1
4055
5.2
163
95.3
40.9
2012 135
304
3.8 0.32
68
4421
7.3
170
80.9
44.6
2013 136
072
4.2 0.36
12
4914
9.2
172
38.6
49.2
2014 136
782
4.7 0.40
42
5528
7.3
178
60.2
53.3
2015 137
462
5.0 0.43 5910
8.7
191
41.9
57.7
2016 138
271
5.4 0.46
44
6421
3.1
203
62.0
62.1
2017 139
008
6.0 0.51
6
7172
8.1
215
20.9
68.0
2018 139
538
6.5 0.55
9
7800
1.7
228
01.8
76.6
2019 140
005
7.1 0.61
06
8548
7.1
242
06.2
87.0
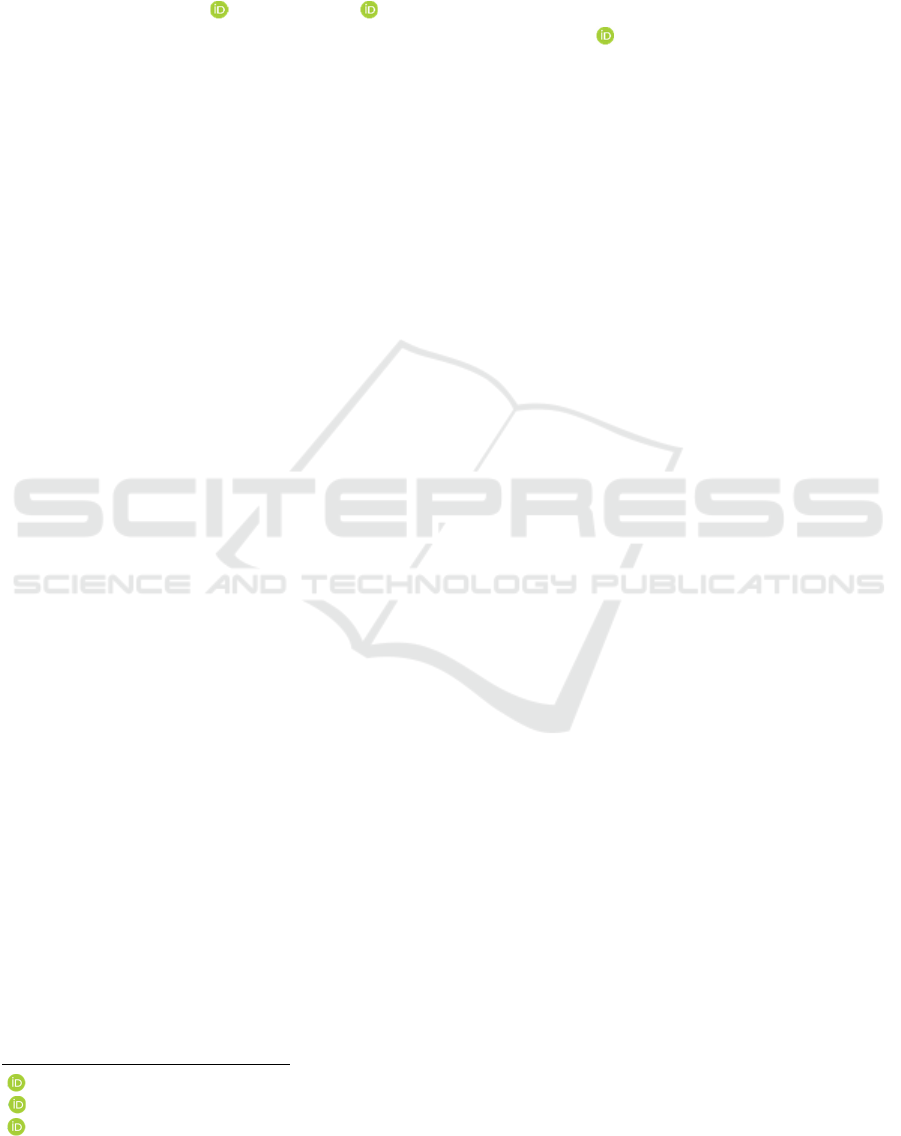
With the growth of WOPC, China’s WCT also
increases gradually. By using Formula 1, the AAWO
from 2010 to 2019 was calculated, and the data shows
that the index increases year by year. Then, we can
see from Figure 1 that the WCG between 2010 and
2019 was calculated by using Formula 2. In 2010 and
2019, China’s waste collection gaps were 187.9
million tons and 612.8 million tons, respectively, with
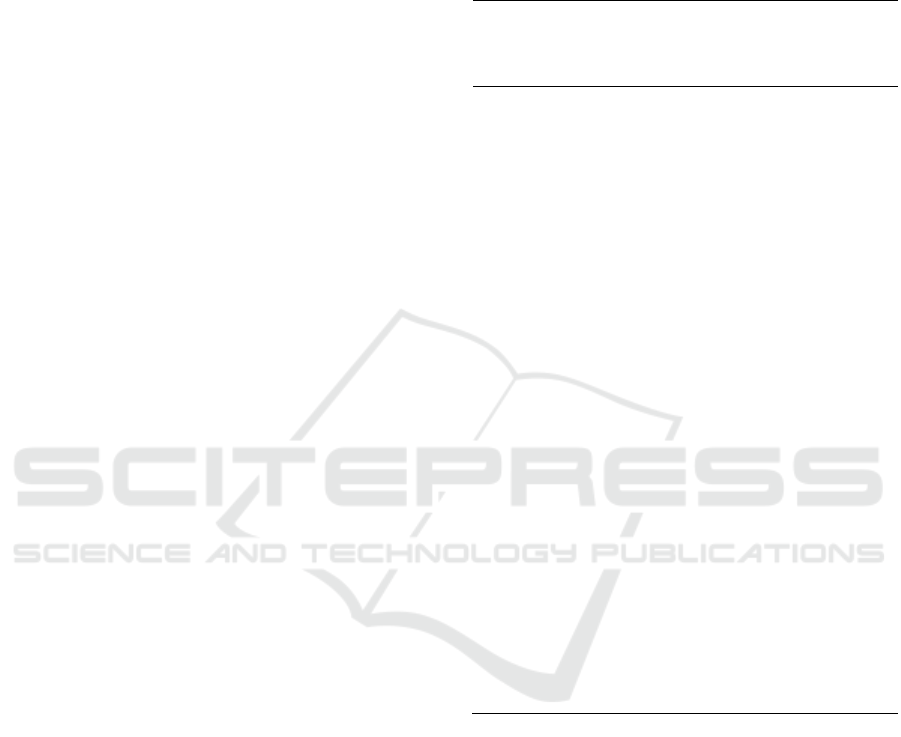
an increased rate of 144.9%. Similarly, Formula 3 can
calculate China’s waste HDCG in 2010 and 2019,
which were 56.0 tons/day and 147.2 tons/day,
respectively. They were presented in figure 2. In the
past ten years, the growth rate of HDCG was 162.8%.
Figure 1. Waste collection gap(WCG 104·tons).
Figure 2. Harmless disposal capacity gap (HDCG
tons/day).
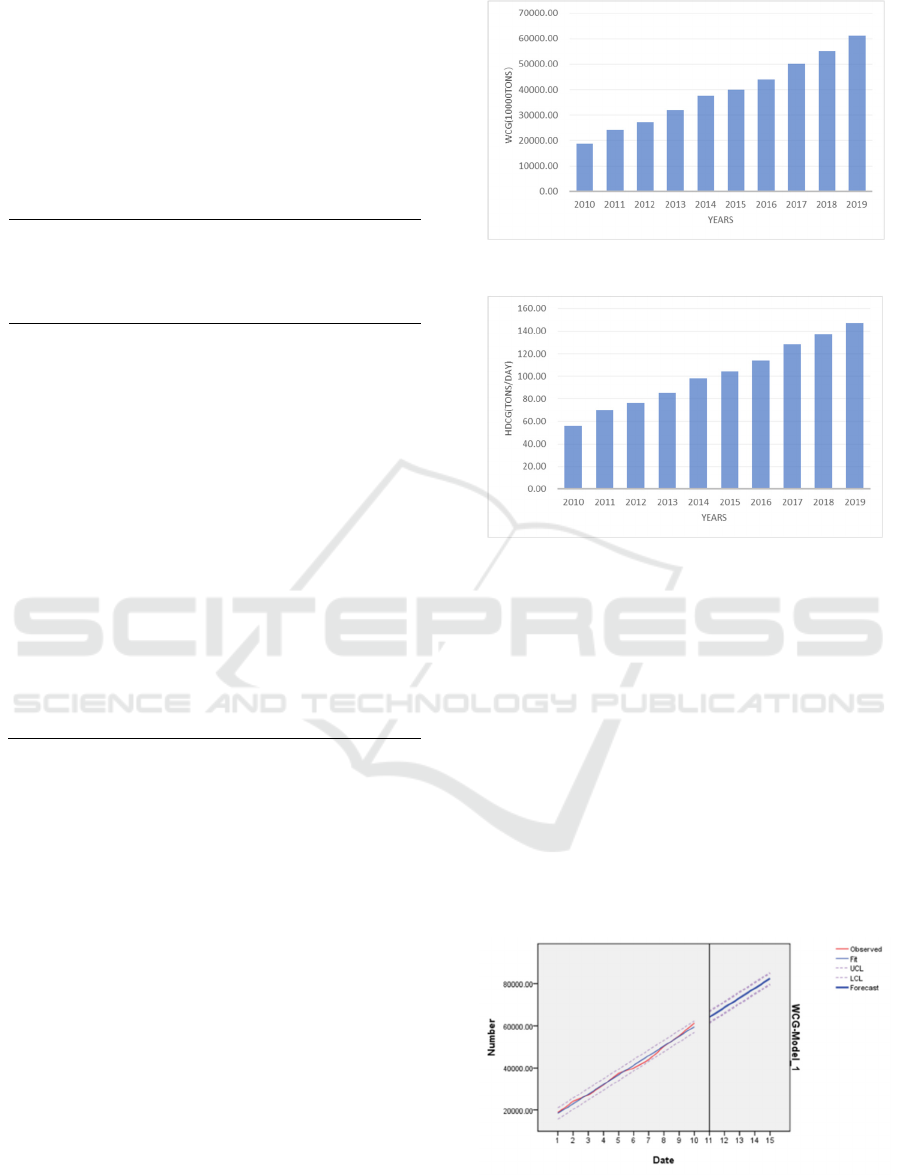
The general prognostic model was used to
prognosticate the WCG and HDCG of domestic waste
by SPSS 21.0. The period from 2010 to 2019 is
regarded as ten single time units, represented by the
number “1-10”, and the next five years from 2020 are
regarded as the prognostication time units, which are
represented by the number “11-15”. The gaps
between waste collection and waste harmless disposal
capacity are on the rise through the observation
model. It can be seen from figure 3 and figure 4 that
by 2024, the gaps between waste collection and waste
harmless disposal capacity in China will be 823.7
million tons and 196.2 tons/day, respectively.
Figure 3. Prognostic of waste collection gap(104·tons).
ISWEE 2022 - International Symposium on Water, Ecology and Environment
258

Figure 4. Prognostic of waste harmless disposal capacity
gap(tons/day).
4 DISCUSSION
This study found that the more developed the city is,
the more waste is produced. Previous studies have
shown that Beijing, Shanghai, Guangzhou, and
Shenzhen are first-tier cities with tight working
schedules. With the increase of per capita GDP, the
consumption demand of residents is greatly
stimulated. With the rapid popularization of
takeaways, fast food, and online shopping, plastic
waste, meal waste, and packaging waste increase
significantly. Especially in today’s increasingly
popular online shopping advocated by Chinese
people, the domestic waste generated by extravagant
packaging increases at an alarming rate.
For example, despite a small-sized product, it is
put in an elegant package, often a medium-sized
carton box full of bubble wraps and airbags. The
improvement of per capita GDP leads to the change
of living standards and consumption structure,
affecting domestic waste production. In 2019,
China’s population reached 1.4 billion, with the per
capita GDP of RMB71,000 and the WOPC 600 kg.
However, China’s large population, online shopping,
express delivery, takeout, and other service industries
may produce more waste than other countries, and the
decision coefficient of waste may even exceed 0.086.
In 2019, China’s AAWO was 854.9 million tons, but
the WCT was 242.1 million tons. In this case, the
amount of waste collection is far behind waste output,
increasing the WCG. At the same time, the HDC was
87.0 tons/day, but the HDCG was 147.2 tons/day. The
pollution is more serious in places where the amount
of domestic waste is large, and the growth rate of
WCG and HDCG are also faster. On the one hand,
because of the enhancement of consumption ability,
residents increase the output of personal waste, but
they do not have a strong sense of personal waste
management, which leads to the imbalance of waste
generation and transportation at the individual level,
resulting in the increase of WCG. On the other, many
cities in China do not have a standardized domestic
waste disposal industry chain. Due to the lack of
adequate final-phase disposal and utilization in the
whole process of waste disposal, only simple landfill
cannot genuinely achieve harmless disposal or the
growth rate of waste disposal stations are not enough,
which leads to a higher growth rate of domestic
waste, resulting in the increase of HDCG. Waste
disposal is not only a criticism of the traditional single
economic index pursuit model, but also a concrete
practice of China’s proposed goal of curbing the
aggravation of environmental pollution, which will be
conducive to searching for countermeasures.
Therefore, based on the above situation, which is
more likely to expand the WCG and HDCG. We can
see that the WCG and HDCG are still growing in the
next five years through the prognostic model, the
growth rate of WCG and HDCG will be 34.42% and
33.29%, respectively from 2020-2024. According to
the general prognostic model for data
prognostication, the short-term effect is still
reasonable, but with the extension of time, the
prognostication error may be significant, so this study
only prognosticates the next five-year period.
Nonetheless, we can still conclude that there are still
many disadvantages in China’s waste collection and
disposal industry chains. In the future, with the
growth of population and the improvement of per
capita income, the WCG and HDCG may be further
expanded.
5 CONCLUSION
The coordinated development of waste disposal and
economic development has become an important
economic and social problem that has aroused
widespread concern. The output and growth rate of
domestic waste in China are growing rapidly in recent
years. The growth of domestic waste in China is
closely related to the increase of per capita GDP.
Furthermore, as domestic waste collection and
harmless disposal capacity cannot catch up with
output of domestic waste, resulting in the growth of
WCG and HDCG. Although China’s per capita GDP
level has increased in recent years, in the long run, the
output of large amount of waste stimulated by GDP
growth has not only increased the gap of waste
management, but also hindered the sustainable
development of the ecological environment.
Study on the Status and Problems of Domestic Waste Management in China
259

ACKNOWLEDGEMENTS
Funding, this work is supported by the National
Natural Science Foundation of China under Grant
(No. 71964020)
REFERENCES
Xiaoyu L, Mi-Hyun P, Michael K S (2019). Socio-
economic factors of high trash generation in the city of
Los Angeles J. Water Sci Technol. 80 (3):408-412.
National annual report on prevention and control of enviro
nmental pollution by solid waste in large and medium
sized cities in (2020). Ministry of Ecological Environm
ent of the People’s Republic of China [EB/OL]. http://
www.mee.gov.cn/ywgz/gtfwyhxpgl/gtfw/202012/P02
0201228557295103367.pdf.
Yujun Y, Tong L, Qiang Z (2020). Life Cycle Impact
Assessment of Waste-Classification Based Municipal
Solid Waste Management Systems: A comparative case
study in China Int. J. Environ. Res. Public Health.
17(15):5311-5312.
The 13th five-year plan of the people's Republic of China (
2016). The Central People’s Government of the People
’s Republic of China [EB/OL]. http://www.gov.cn/zhe
ngce/index.htm.
Zongguo W, Yiling X, Muhan C, Christian Doh D (2021).
China’s plastic import ban increases prospects of
environmental impact mitigation of plastic waste trade
flow worldwide J. Nature Communications. 12(1):426-
430.
Hua Z and Yu G (2021). EnCNN-UPMWS: Waste
classification by a CNN Ensemble using the UPM
weighting strategy J. Electronics 10(4) 430-435.
Xiangru L, Feng B, Zedong H, et al (2019). Waste source
classification performance, impact factor, and
management strategy in rural areas of China: A case
study in Hangzhou J. Waste Management 89 313-314.
Maarten D (2012). Extended producer responsibility for
consumer waste: the gap between economic theory and
implementation J. Waste Manag Res. 30(9 Suppl) 36-
37.
George H, Kleoniki Natalia P (2020). The relationship
between MSW and education: WKC evidence from 25
OECD countries J. Waste Management. 114 241-243.
Statistics of domestic waste treatment industry (2020).
China Association of Circular Economy [EB/OL].
https://www.chinacace.org/news/view?id=11500.
ISWEE 2022 - International Symposium on Water, Ecology and Environment
260
