
Hepatoprotective Effect of Niclosamide on Paracetamol-Induced
Liver Toxicity in Rats
Ali M. Roshdy
1
and Ismail A. Youssef
2,*
1
School of Pharmaceutical Science and Technology, Health Sciences Platform, Tianjin University,
Tianjin 300072, P.R. China
2
Bahauddin Zakariya University, Multan, Punjab 60000, Pakistan
Keywords:
Liver Fibrosis, Niclosamide, Paracetamol-Induced Hepatoxicity.
Abstract: Liver diseases is considered one of the leading causes of death and an important barrier to increasing life
expectancy. From among, liver fibrosis which is a result of a chronic damage to the liver leading to liver
cirrhosis. Niclosamide is a potent anti-helminthic drug which has been used in treating the tapeworm
infections. It also showed a hepatoprotective effect in induced liver toxicity models. The present study was
conducted to identify the hepatoprotective effect of niclosamide in a paracetamol-induced liver toxicity. Rats
were divided into five groups (6 rats per group): control group, disease group, 5 mg niclosamide group, 10
mg niclosamide group and 15 mg niclosamide group. Three doses of niclosamide (5 mg/kg, 10 mg/kg and 15
mg/kg) were injected intraperitoneal (i.p) for 4 weeks. Assessments included hepatic enzymes (AST, ALT,
ALP and GGT), oxidative stress (MDA, GSH and SOD) and inflammatory markers (IL-6, TNF- α and NF-
kB). The three doses of niclosamide (5 mg/kg, 10 mg/kg and 15 mg/kg) had significantly reduced the hepatic
enzymes with the prominent effect at dose 15 mg/kg. There was also a significant decrease in the MDA
activity, while significant increase in the GSH and SOD activity. Moreover, there was significant reduction
in the levels of IL-6, TNF- α and NF-kB with the use of niclosamide (5 mg/kg, 10 mg/kg and 15 mg/kg).
Therefore, in the current study, it presents the niclosamide as a promising hepatoprotective agent.
1 INTRODUCTION
Liver diseases have become a major health concern
globally ranks as one of the leading causes of death
and an important barrier to increasing life expectancy.
From among, liver fibrosis which is a result of a
chronic damage to the liver leading to the
accumulation of the extracellular matrix (ECM)
proteins (Friedman, 2003). The accumulation of
ECM proteins will cause the formation of fibrous
scar, changes in the hepatic architecture and
eventually leading to liver cirrhosis (Ginès, 2004).
Viral infection, autoimmune disease, alcohol intake,
*
Correspondence: All correspondence should be
addressed to
Dr. Ismail A.Youssef
Lecturer of Pharmacology and Toxicology
Department of Pharmacology & Toxicology
Faculty of Pharmacy, Bahauddin Zakariya University,
Multan, Pakistan
Mobile: +2-01118420848
Fax: +202-
22751038
*
E-mail: ismail.a.youssef@gmail.com
drug-induced and metabolic disorder are the most
common etiologies of chronic liver disease,
consequently, leads to liver fibrosis and cirrhosis
(Friedman, 2004). Drug-induced liver toxicity
manifestations can be ranging from increase in the
hepatic enzymes to liver cirrhosis. An overdose of
paracetamol can cause sever liver toxicity in
accordance to pervious study (Vermeulen, 1992).
Such toxicity arises from the generation of the toxic
metabolite NAPQI (N-acetyl-p-benzoquinoneimine),
which is produced from the metabolism of the
paracetamol by the liver due to the oxidation through
the cytochrome P450 (Cyp450) (Vermeulen, 1992;
Roshdy, A. and Youssef, I.
Hepatoprotective Effect of Niclosamide on Paracetamol-Induced Liver Toxicity in Rats.
DOI: 10.5220/0012013200003633
In Proceedings of the 4th International Conference on Biotechnology and Biomedicine (ICBB 2022), pages 61-68
ISBN: 978-989-758-637-8
Copyright
c
2023 by SCITEPRESS – Science and Technology Publications, Lda. Under CC license (CC BY-NC-ND 4.0)
61

Cohen, 1997). Although, the toxic effect of NAPQI is
neutralized by glutathione (GSH) under normal
conditions, the overproduction of it will eventually
deplete the GSH stores and accumulate reactive
oxygen species (ROS) causing liver damage due to
oxidative stress (Guo, 2016; Wang, 2017; Salem,
2018). Paracetamol induced oxidative stress also
stimuli the production of inflammatory markers
interleukin-6 (IL6), tumor necrosis factor-alpha
(TNF-α) and nuclear factor-kappa B (NF-kB) (Liao,
2016).
Niclosamide is a potent anti-helminthic drug
which has been used for long period in treating the
tapeworm infections (Al-Hadiya, 2005). Niclosamide
mechanism of action can be illustrated by its ability
to uncouple oxidative phosphorylation in
mitochondria, such mechanism protects the
mitochondria by reducing ROS production (Alasadi,
2018; Al-Gareeb, 2017). In a previous study,
niclosamide showed a hepatoprotective effect against
methotrexate-induced liver toxicity (Zeki, 2021).
Therefore, in the present study, we investigate the
hepatoprotective effect of niclosamide against
paracetamol-induced liver toxicity using in vivo
model (albino Wistar rats).
2 MATERIALS AND METHODS
2.1 Drugs and Chemicals
Niclosamide was obtained from Sigma-Aldrich. The
selection of niclosamide doses was according to a
previous study (Boyapally, 2019). Dimethyl
sulfoxide (DMSO) and chlorpromazine were
purchased from Thermo Fisher Scientific. Normal
saline solution, Polyethylene glycol (PEG) and
ketamine were purchased from Sigma-Aldrich. The
vehicle used for injection of niclosamide was DMSO
and PEG 200 with ratio 1:4 in normal saline. The
concentration of DMSO in normal saline was 1%.
The chemicals useful for these studies were almost of
analytical rank.
2.2 Animals
Experiments were conducted using Male albino
Wistar rats (250-300 g. n=30), procured from the
Holding company for biological products and
Vaccines (VACCERA, Egypt). The animals were
maintained at temperature of 25 ◦C and with 12/12 h
light/dark cycle. They were housed for 2 weeks prior
to the pharmacological experiments to adapt the
laboratory conditions. The study has been approved
by recommendations approved by the Egyptian
Russian University Research Ethics Committee
(REC-ERU), Egypt.
2.3 Paracetamol Induced Toxicity
Paracetamol was used for the induction of acute
hepatotoxicity according to the liver damage model
(Sreedevi, 2009). The paracetamol was suspended in
0.5% tween-80 and the dose administered was 2
gm/kg per oral.
2.4 Experimental Design
Animals were divided into five groups with 6 rats per
each group. Group 1: was the control group, rats
received vehicle only. Group 2: was the disease
group, rats injected with paracetamol (2 g/kg, p.o.).
Group 3: was the 5 mg niclosamide group, rats were
injected with paracetamol (2 g/kg, p.o.) and 5
mg/kg/day niclosamide i.p. for 4 weeks. Group 4: was
the 10 mg niclosamide group, rats were injected with
paracetamol (2 g/kg, p.o.) and 10 mg/kg/day
niclosamide i.p. for 4 weeks. Group 5: was the 15 mg
niclosamide group, rats were injected with
paracetamol (2 g/kg, p.o.) and 15 mg/kg/day
niclosamide i.p. for 4 weeks. The injection of
niclosamide and vehicle was started at the same day
of surgery.
After 4 weeks, the animals were anesthetized
using ketamine (100 mg/kg) and chlorpromazine i.p.
(0.75 mg/kg), then sacrificed. The blood samples
were collected by puncturing the retro-orbital plexus
for analysis of biochemical markers, and the liver was
removed for examination of oxidative stress and
inflammatory markers.
2.5 Biochemical Spectrophotometric
Analysis of
2.5.1 Biomarkers for Liver Function
A colorimetric method was used to assess Serum
aspartate transaminase (AST) and Alanine
transaminase (ALT) according to the instructions of
manufacturer’s (TECO DIAG- NOSTICS, 1268 N.
Lakeview Ave, Anaheim, U.S.A.). Modifications has
been carried on the original methods by Doumas and
Briggs, and Reitman and Frankel respectively
(Doumas, 1969; Reitmen, 1957).
Colorimetric method was used to assess Gamma-
Glutamyl Transferase (GGT) using kit (XpressBio
503 Gateway Dr W Thurmont, MD 21788,). It
measures the level of the product p-nitroaniline
ICBB 2022 - International Conference on Biotechnology and Biomedicine
62

(pNA) at 405 nm, which is produced from the
cleavage of the GGT substrate (©-glutamyl-p-
ntiroanilide) by the enzyme. The product pNA is
directly proportional to the GGT level. All the results
from AST, ALT and GGT assays expressed in U/L.
2.5.2 Biomarkers for Cholestasis
Colorimetric method was used to assess Serum
alkaline phosphate (ALP) according to the
instructions of manufacturer (BioAssay Systems.
3191 Corporate Place, Hayward, USA). It measures
the yellow-colored product at 405 nm, obtained from
the hydrolysis of the p-nitrophenyl phosphate by the
ALP. The yellow-colored product is directly
proportional to the ALP activity. The result value was
expressed as U/L.
2.5.3 Oxidative Stress Marker
Malondialdehyde (MDA)
Assessment of the tissue MDA was carried according
to the instructions of manufacturer (MyBioSource,
sunny Southern California, San Diego, USA).
Evaluation of the tissue MDA was based on the
reaction with thiobarbituric acid (TBA) to produce
thiobarbituric acid reactive substance (TBARS); pink
chromogen; which is measured at 532-535 nm.
2.6 Enzyme- Linked Immunosorbent
Assay (ELISA)
2.6.1 General Principle
This assay employs the quantitative sandwich
enzyme immunoassay technique. Antibodies specific
to the target antigens were used to pre-coat the ELISA
plates. For detection antibody, Biotin conjugated
antibody was used. Samples and biotin conjugated
antibody were added simultaneously to the wells and
washed using wash buffer. After using the wash
buffer to wash the wells, avidin conjugated
horseradish peroxidase (HRP) was added. To
visualize the HRP reaction, tetramethylbenzidine
(TMB) was used as substrate. The produced color
intensity was measured at 450 nm, which is
proportional to the amount of the antigen in the
sample.
2.6.2 Assessment of Oxidative Stress
Markers Superoxide Dismutase (SOD)
And Glutathione (GSH)
Assessment of the SOD and GSH tissue levels was
carried according to the instructions of manufacturer
(MyBioSource, sunny Southern California, San
Diego, USA), (Blue gene Biotech CO., LTD,
Shanghai, China), respectively. The results values
were expressed as mmol/mg protein.
2.6.3 Assessment of Inflammatory Markers
Assessment of the interleukin-6 (IL-6), tumor
necrosis factor-alpha (TNF-α) and nuclear factor-
kappa B (NF-kB) was carried according to the
instructions of the manufacturer (Cat no.
MBS175908, MyBioSource, sunny Southern
California, San Diego, USA), (Cat no. MBS9711597,
MyBioSource, sunny Southern California, San
Diego, USA) and (Cat no. MBS268833,
MyBioSource, sunny Southern California, San
Diego, USA), respectively. The result value of NF-
kB level was expressed as ng/mg protein, however,
the results values for both IL-6 and TNF-α were
expressed as pg/mg protein.
2.6.4 Statistical Analysis
The results were all expressed as mean ± S.D. To
compare between different groups, one-way analysis
of variance (ANOVA) was used followed by Tukey’s
test. The data considered statistically significant when
the P < 0.05. All of the statistical analysis and graphs
were done using GraphPad Prism version 5 software
(ISI Software, United States).
3 RESULTS
3.1 Effect of Niclosamide on Liver
Function and Cholestasis Markers
After 4 weeks, there was a significant increase in the
AST, ALT, ALP and GGT values in the disease group
by 5, 6, 5 and 8-fold respectively, when compared to
the control group. Treatment with niclosamide in
group 3 ( 5 mg/kg/day) cause a significant decrease in
the values of AST, ALT, ALP and GGT by 40%,
45%, 50% and 53% respectively, when compared to
the disease group. On the other hand, treatment with
niclosamide in group 4 ( 10 mg/kg/day) cause a
significant decrease in the values of AST, ALT, ALP
and GGT by 59%, 67%, 70% and 78% respectively,
when compared to the disease group. Furthermore,
treatment with niclosamide in group 5 ( 15
mg/kg/day) cause a significant decrease in the values
of AST, ALT, ALP and GGT by 63%, 70%, 73% and
80% respectively, when compared to the disease
group (Table 1).
Hepatoprotective Effect of Niclosamide on Paracetamol-Induced Liver Toxicity in Rats
63
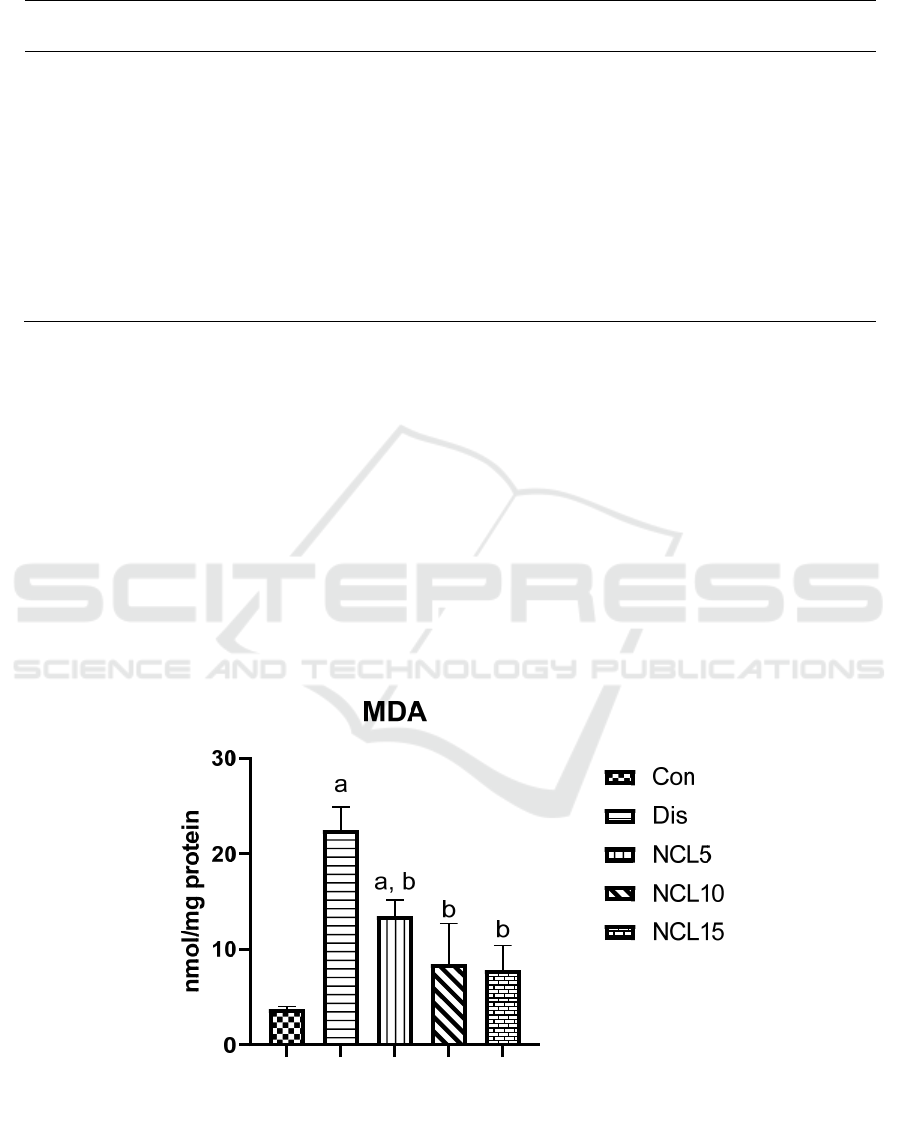
Table 1: Effect of Niclosamide (5, 10 and 15 mg/kg) on paracetamol induced changes in liver functions.
Groups AST (U/L) ALT (U/L) ALP (U/L) GGT (U/L)
Control 45.06 ± 5.312 32.64 ± 4.51 52.83 ± 4.13 23.95 ± 3.46
Disease 235.50 ± 5.39
a
198.01 ± 7.66
a
264.01 ± 5.81
a
188.0 ± 7.37
a
5 mg Niclosamide 138.50 ± 7.78
a, b
108.30 ± 7.36
a, b
132.7 ± 6.09
a, b
89.82 ± 4.93
a, b
10 mg Niclosamide 98.50 ± 3.85
a, b
66.42 ± 5.60
a, b
80.45 ± 5.08
a, b
42.82 ±4.21
a, b
15 mg Niclosamide 89.02 ± 4.63
a, b
60.76 ± 6.59
a, b
73.99 ± 6.53
a, b
37.27 ± 6.40
b
Data are represented as mean ± SD of 6 rats per group. a: significant difference from control group, and b: significant
difference from disease group at p < 0.05 using ANOVA followed by Tukey’s post-hoc test.
3.2 Effect of Niclosamide on Oxidative
Stress and Antioxidant Capacity
Comparing the level of the MDA in the control group
to the disease group. There was a significant increase
with around 6 folds in the disease group. Treatment
with niclosamide in the group 3 (5 mg/kg/day), group
4 (10 mg/kg/day) and group 5 (15 mg/kg/day) caused
a significant reduction by 40%, 64% and 69%
respectively, when compared to the disease group
(Figure 1). Moreover, GSH and SOD levels were
significantly decrease in the disease group by 75%
and 70% respectively, when compared to the control
group. Treatment with niclosamide in group 3 (5
mg/kg/day), group 4 (10 mg/kg/day) and group 5 (15
mg/kg/day) caused a significant increase in the levels
of GSH by 2 folds, 3.5 folds and 4 folds respectively,
when compared to the disease group (Figure 2).
While levels of SOD were increased with niclosamide
treatment in group 3 (5 mg/kg/day), group 4 (10
mg/kg/day) and group 5 (15 mg/kg/day) by 1.7 folds,
2.5 folds and 3 folds, respectively, when compared to
the disease group (Figure 3).
Figure 1: Effect of niclosamide on MDA. Data are presented as mean ± SD of 6 rats per group, a: significant difference from
control group, and b: significant difference from disease group at p < 0.05 using one-way ANOVA followed by Tukey’s post
hoc test. Con, control group; Dis, disease group; NCL5, 5 mg niclosamide group; NCL10, 10 mg niclosamide group; NCL15,
15 mg niclosamide group.
ICBB 2022 - International Conference on Biotechnology and Biomedicine
64
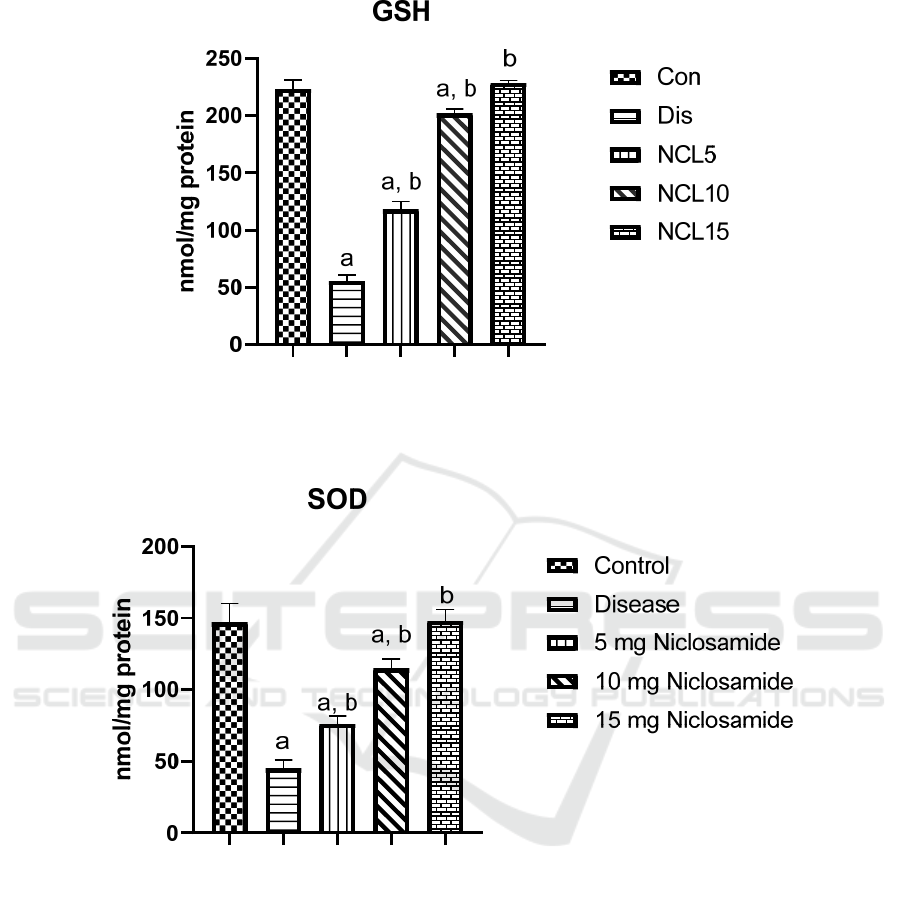
Figure 2: Effect of niclosamide on GSH. Data are presented as mean ± SD of 6 rats per group, a: significant difference from
control group, and b: significant difference from disease group at p < 0.05 using one-way ANOVA followed by Tukey’s post
hoc test. Con, control group; Dis, disease group; NCL5, 5 mg niclosamide group; NCL10, 10 mg niclosamide group; NCL15,
15 mg niclosamide group.
Figure 3: Effect of niclosamide on SOD. Data are presented as mean ± SD of 6 rats per group, a: significant difference from
control group, and b: significant difference from disease group at p < 0.05 using one-way ANOVA followed by Tukey’s post
hoc test. Con, control group; Dis, disease group; NCL5, 5 mg niclosamide group; NCL10, 10 mg niclosamide group; NCL15,
15 mg niclosamide group.
3.3 Effect of Niclosamide on
Inflammatory Markers
There was a significant increase in the levels of IL-6,
TNF-α and NF-kB by 4.9, 5.6, 6.5 folds in the disease
group compared to the control group. On the other
hand, treatment using niclosamide in group 3 (5
mg/kg/day) caused significant reduction on IL-6,
TNF-α and NF-kB by 39%, 42% and 49%
respectively, when compared to the disease group.
Also, treatment using niclosamide in group 4 (10
mg/kg/day) caused a significant reduction on IL-6,
TNF-α and NF-kB by 58%, 60% and 71%
respectively, when compared to the disease group. In
addition, treatment using niclosamide in group 5 (15
mg/kg/day) caused a significant reduction on IL-6,
TNF-α and NF-kB by 63%, 67% and 76%
respectively, when compared to the disease group
(Figures 4, 5 and 6).
Hepatoprotective Effect of Niclosamide on Paracetamol-Induced Liver Toxicity in Rats
65
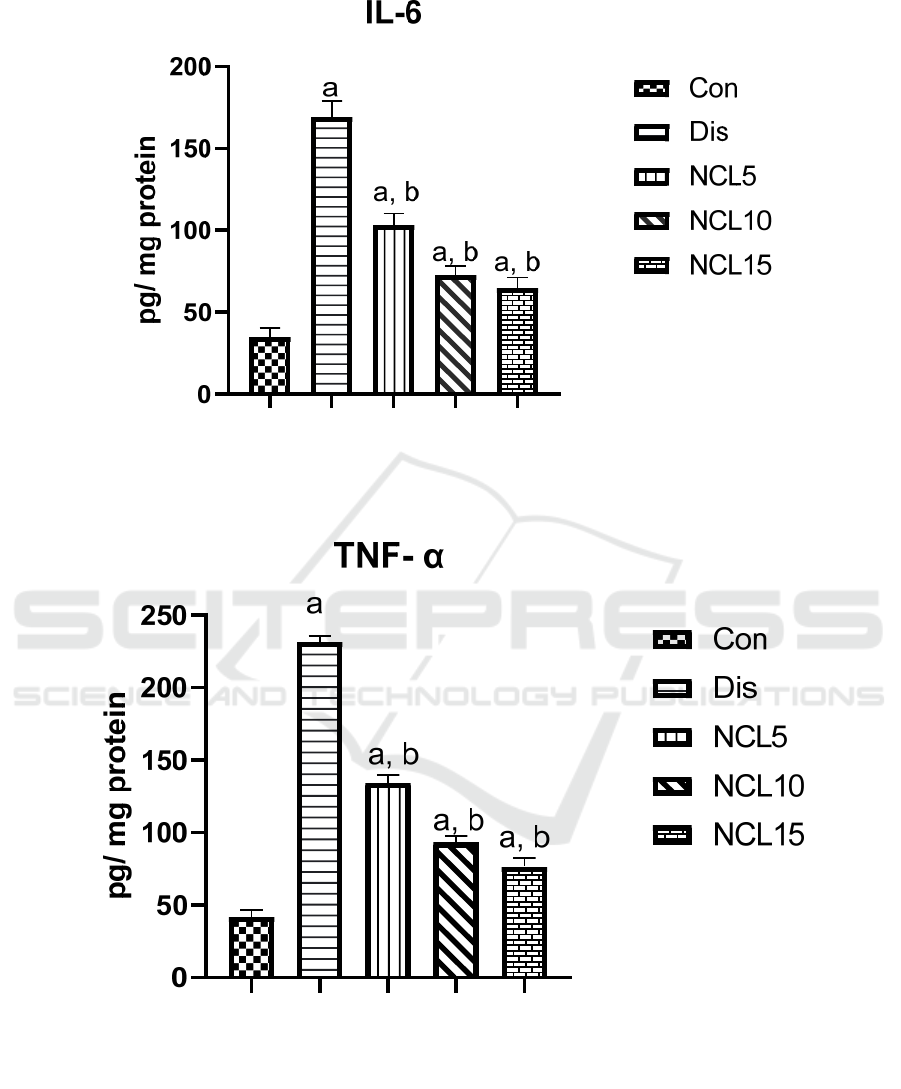
Figure 4: Effect of niclosamide on IL-6. Data are presented as mean ± SD of 6 rats per group, a: significant difference from
control group, and b: significant difference from disease group at p < 0.05 using one-way ANOVA followed by Tukey’s post
hoc test. Con, control group; Dis, disease group; NCL5, 5 mg niclosamide group; NCL10, 10 mg niclosamide group; NCL15,
15 mg niclosamide group.
Figure 5: Effect of niclosamide on TNF-α. Data are presented as mean ± SD of 6 rats per group, a: significant difference from
control group, and b: significant difference from disease group at p < 0.05 using one-way ANOVA followed by Tukey’s post
hoc test. Con, control group; Dis, disease group; NCL5, 5 mg niclosamide group; NCL10, 10 mg niclosamide group; NCL15,
15 mg niclosamide group.
ICBB 2022 - International Conference on Biotechnology and Biomedicine
66
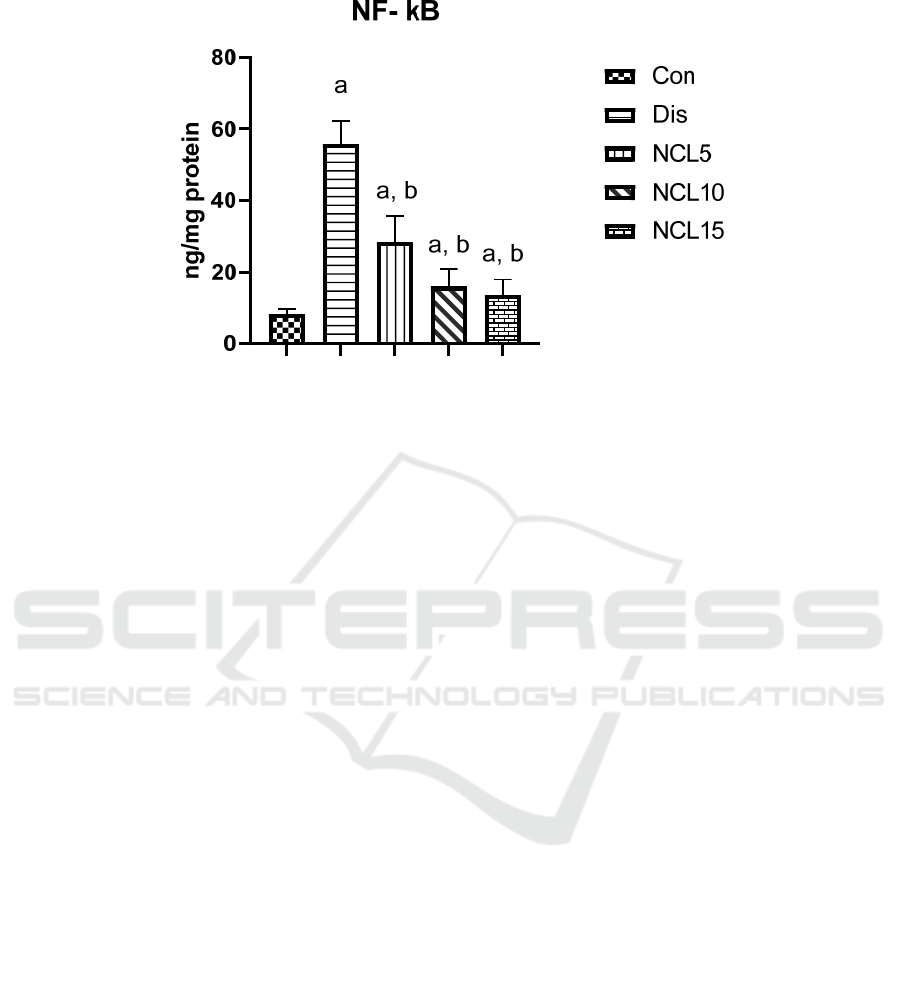
Figure 6: Effect of niclosamide on NF-kB. Data are presented as mean ± SD of 6 rats per group, a: significant difference from
control group, and b: significant difference from disease group at p < 0.05 using one-way ANOVA followed by Tukey’s post
hoc test. Con, control group; Dis, disease group; NCL5, 5 mg niclosamide group; NCL10, 10 mg niclosamide group; NCL15,
15 mg niclosamide group.
4 DISCUSSION
Liver is an essential organ for regulation of the internal
body environment. Therefore, any damage affects the
liver due to any reasons can have a serious
consequence. One example of the causes behind liver
toxicity, is drug-induced toxicity by paracetamol.
Paracetamol is used as analgesic and antipyretic drug
at normal doses, however, in high doses it possesses a
hepatotoxic effect. Moreover, paracetamol-induced
hepatotoxicity was used as an experimental model for
evaluation of hepatoprotective agents.
In this study, liver fibrosis in rodents was induced
using paracetamol-induced hepatotoxicity model.
There was elevation in the hepatic markers AST, ALT,
ALP and GGT showing hepatic dysfunction
15
. Using
different doses of niclosamide ( 5, 10 and 15 mg/kg),
it displayed a significant decrease in the AST, ALT,
ALP and GGT enzymes activity. The prominent effect
was at dose 15 mg/kg, however, the effect of doses 10
mg/kg and 15 mg/kg was almost the same.
Paracetamol-induced liver toxicity showed before
an increase in the ROS and depletion in the antioxidant
reservoirs (Canayakin, 2016). Depletion of GSH
stores and decrease in its value in this study was in
accordance with a previously published results
(Kushwah, 2014). Treatment using niclosamide
different doses ( 5, 10 and 15 mg/kg) had a significant
effect on restoring the GSH stores displayed increase
of its values. Although there was a significant
difference in the effect on GSH between the dose 5
mg/kg and 10 mg/kg but comparing the effect of dose
10 mg/kg to 15 mg/kg, the values were closely related.
Same pattern was obvious with the SOD, where there
was a significant decrease in SOD value in the disease
group, correlated with the previous results (Madi,
2015). Co-treatment using niclosamide (5, 10 and 15
mg/kg) lead to the increase of SOD activity with the
prominent effect at 10 mg/kg and 15 mg/kg. Free
radicals cause tissue damage due to lipid peroxidation
(Esterbauer, 1991). One of the lipid peroxidation
products is MDA, which showed a surge in its values
in this study due to paracetamol-induced
hepatotoxicity in accordance with a recent study
(Rašković, 2017). Treatment using niclosamide (5, 10
and 15 mg/kg) displayed a decrease in MDA values.
Comparing the 3 different doses, the effect was the
most with 15 mg/kg and the dose 5 mg/kg showed the
lowest effect.
In addition, herein inflammatory markers such as
IL-6 and TNF-α was significantly increased with
paracetamol-induced liver toxicity. This elevation is
correlated to recent studies (Karakus, 2013; James,
2003). Co-treatment using niclosamide (5, 10 and 15
mg/kg) decrease the activity of these markers, doses
10 mg/kg and 15 mg/kg showed almost same pattern
with prominent effect if compared to dose 5 mg/kg.
Also, the inflammatory marker NF-kB was
significantly boosted with the paracetamol-induced
toxicity, in alignment with the recent study (Jiang,
2021). Using niclosamide various doses (5, 10 and 15
mg/kg) caused significant reduction in NF-kB
activity, such reduction was more obvious with the 10
mg/kg and 15 mg/kg doses.
Hepatoprotective Effect of Niclosamide on Paracetamol-Induced Liver Toxicity in Rats
67

5 CONCLUSION
The hepatoprotective effect of niclosamide against
liver toxicity induced by paracetamol for four-weeks
period was elevated by the author. Niclosamide
significantly cause reduction in the hepatic enzymes
AST, ALT, ALP and GGT. Moreover, niclosamide
had the ability to ameliorate oxidative stress by
significantly reduce MDA and increase SOD and
GSH. Nevertheless, niclosamide had also part in
inflammation reduction by significantly decrease the
inflammatory markers TNF-α, IL-6 and NF-kB.
Although further studies are needed for
understanding the exact mechanism of niclosamide in
healing liver toxicity, but niclosamide can be
considered a promising hepatoprotective drug.
REFERENCES
Al‐Hadiya, B. M. Niclosamide: comprehensive profile.
Profiles of Drug Substances, Excipients and Related
Methodology 32, 67-96 (2005).
Alasadi, A. et al. Effect of mitochondrial uncouplers
niclosamide ethanolamine (NEN) and oxyclozanide on
hepatic metastasis of colon cancer. Cell death & disease
9, 1-14 (2018).
Al-Gareeb, A. I., Aljubory, K. D. & Alkuraishy, H. M.
Niclosamide as an anti-obesity drug: an experimental
study. Eating and Weight Disorders-Studies on
Anorexia, Bulimia and Obesity 22, 339-344 (2017).
Boyapally, R., Pulivendala, G., Bale, S. & Godugu, C.
Niclosamide alleviates pulmonary fibrosis in vitro and
in vivo by attenuation of epithelial-to-mesenchymal
transition, matrix proteins & Wnt/β-catenin signaling: A
drug repurposing study. Life Sciences 220, 8-20,
doi:10.1016/j.lfs.2018.12.061 (2019).
Canayakin, D. et al. Paracetamol-induced nephrotoxicity
and oxidative stress in rats: the protective role of Nigella
sativa. Pharmaceutical biology 54, 2082-2091 (2016).
Cohen, S. D. & Khairallah, E. A. Selective protein arylation
and acetaminophen-induced hepatotoxicity. Drug
metabolism reviews 29, 59-77 (1997).
Doumas, B. & Biggs, H. G. A colorimetric method for
assaying serum aspartate aminotransferase activities.
Clinica Chimica Acta 23, 75-82 (1969).
Esterbauer, H., Schaur, R. J. & Zollner, H. Chemistry and
biochemistry of 4-hydroxynonenal, malonaldehyde and
related aldehydes. Free radical Biology and medicine
11, 81-128 (1991).
Friedman, S. L. Liver fibrosis–from bench to bedside.
Journal of hepatology 38, 38-53 (2003).
Friedman, S. L. in Portal Hypertension in the 21st Century
27-35 (Springer, 2004).
Ginès, P., Cárdenas, A., Arroyo, V. & Rodés, J.
Management of cirrhosis and ascites. New England
Journal of Medicine 350, 1646-1654 (2004).
Guo, C. et al. Characterization of acetaminophen-induced
cytotoxicity in target tissues. American Journal of
Translational Research 8, 4440 (2016).
James, L. P., McCullough, S. S., Lamps, L. W. & Hinson, J.
A. Effect of N-acetylcysteine on acetaminophen toxicity
in mice: relationship to reactive nitrogen and cytokine
formation. Toxicological sciences 75, 458-467 (2003).
Jiang, W.-P. et al. Sanghuangporus sanghuang Mycelium
Prevents Paracetamol-Induced Hepatotoxicity through
Regulating the MAPK/NF-κB, Keap1/Nrf2/HO-1,
TLR4/PI3K/Akt, and CaMKKβ/LKB1/AMPK
Pathways and Suppressing Oxidative Stress and
Inflammation. Antioxidants 10, 897 (2021).
Karakus, E. et al. Agomelatine: an antidepressant with new
potent hepatoprotective effects on paracetamol-induced
liver damage in rats. Human & experimental toxicology
32, 846-857 (2013).
Kushwah, D. S., Salman, M. T., Singh, P., Verma, V. K. &
Ahmad, A. Protective effects of ethanolic extract of
Nigella sativa seed in paracetamol induced acute
hepatotoxicity in vivo. Pak J Biol Sci 17, 517-522,
doi:10.3923/pjbs.2014.517.522 (2014).
Liao, C.-C. et al. Baicalin attenuates IL-17-mediated
acetaminophen-induced liver injury in a mouse model.
PLoS One 11, e0166856 (2016).
Madi Almajwal, A. & Farouk Elsadek, M. Lipid-lowering
and hepatoprotective effects of Vitis vinifera dried seeds
on paracetamol-induced hepatotoxicity in rats. nrp 9, 37-
42, doi:10.4162/nrp.2015.9.1.37 (2014).
Rašković, A. et al. Antioxidative and Protective Actions of
Apigenin in a Paracetamol-Induced Hepatotoxicity Rat
Model. European Journal of Drug Metabolism and
Pharmacokinetics 42, 849-856, doi:10.1007/s13318-
017-0407-0 (2017).
Reitmen, S. A colorimetric method for the determination of
serum glutamate oxaloacetate and serum glutamate
pyruvate transminase. Am. J. Clin. Pathol. 28, 56 (1957).
Salem, G. A. et al. Phoenix dactylifera protects against
oxidative stress and hepatic injury induced by
paracetamol intoxication in rats. Biomedicine &
Pharmacotherapy 104, 366-374 (2018).
Sreedevi, C. et al. Hepatoprotective studies on Sida acuta
Burm. f. Journal of ethnopharmacology 124, 171-175
(2009).
Vermeulen, N., Bessems, J. & Van de Straat, R. Molecular
aspects of paracetamol-induced hepatotoxicity and its
mechanism-based prevention. Drug metabolism reviews
24, 367-407 (1992).
Wang, X. et al. Paracetamol: overdose-induced oxidative
stress toxicity, metabolism, and protective effects of
various compounds in vivo and in vitro. Drug
metabolism reviews 49, 395-437 (2017).
Zeki, Z. & Al-Gareeb, A. Comparative study between effect
of niclosamide and vitamin c on methotrexate-induced
liver injury in mice. Mustansiriya Medical Journal 20,
55-61, doi:10.4103/mj.mj_4_21 (2021).
ICBB 2022 - International Conference on Biotechnology and Biomedicine
68
