
Combining Transformer and Reverse Attention Mechanism for Polyp
Segmentation
Jianzhuang Lin
*
, Wenzhong Yang
*
and Sixiang Tan
College of Information Science and Engineering, Xinjiang University, Urumqi 830046, China
Keywords:
Transformer, Inverted Attention, Polyp Segmentation, Deep Learning, Medical Image Segmentation.
Abstract: The polyp region can be accurately segmented from the images obtained by colonoscopy to assist doctors in
diagnosis, which is of great significance for reducing the incidence of colon cancer. For the polyp
segmentation problem, a segmentation network combining Transformer and reverse attention (CTRNet) is
proposed. First, using the swin Transformer as the backbone network, the polyp image is modeled
hierarchically, and long-distance dependencies are obtained, and the receptive field is gradually expanded to
obtain more contextual information of the polyp target area; secondly, an inversion attention is proposed. The
mechanism is used to mine the polyp area information in the feature map, correct the inconsistent area,
establish the relationship between the foreground area and the boundary, and suppress the irrelevant
background information through the attention gate, thereby improving the accuracy of the model's
segmentation of the polyp boundary. Extensive experiments are carried out on five challenging datasets.
Compared with other existing methods under different evaluation indicators, CTRNet's performance is better
than most of the compared methods, and it can effectively segment polyp regions. Especially on Kvasir and
ETIS, STRNet achieves 0.922 and 0.793 mDICE.
1 INTRODUCTION
In the digestive tract, the most common cancer sites
are the esophagus, stomach and colon, especially the
colon with the highest incidence. Colon, lung and
breast cancer account for one-third of cancer deaths
worldwide. As reported by GLOBOCAN in 2018, the
incidence and mortality of colorectal cancer (CRC)
have increased substantially. Colorectal cancer kills
900,000 people every year, making it the third most
diagnosed cancer in the world and the second leading
cause of cancer-related deaths (FREDDIE, 2018).
Studies have shown that early detection and
treatment of polyps in the intestinal tract can
effectively control the occurrence of the disease,
reduce the probability of colorectal cancer, and
improve the survival rate (KAMINSKI, 2019). At
present, with the development of medical imaging
technology, it has become an important method for
the diagnosis of colon cancer. Colon cancers mostly
arise from colonic polyps, which are abnormal
growths of tissue that protrude from the local
mucosal surface and can be found in the colon,
rectum, stomach and even the throat. And polyps
have the potential to become cancerous, so a long-
term diagnosis is needed, including the growth or
location of the polyp, and whether it becomes
malignant. The gold standard for early colon cancer
screening is the use of colonoscopy to detect polyps
in the bowel (LIEBERMAN, 2012). Colon polyps
can be detected and removed before they develop into
cancer (DONE, 2021). Colonoscopy can observe the
range and shape of polyps, tumors, etc. in the
intestinal tract, as well as the appearance of small
intestinal stenosis.
Therefore, the use of colonoscopy to detect
polyps in the intestine is an important basis for
doctors to diagnose colon cancer. Polyps in the
intestine are usually classified based on vascular
structure or tissue structure. The better the
segmentation performance, the higher the
classification accuracy (BREIER, 2011). Therefore,
accurate segmentation of colorectal polyps is of great
significance for reducing the incidence of colon
cancer.
Traditional polyp segmentation algorithms
mainly achieve segmentation tasks by manually
designing polyp features by researchers. According
to the difference between the foreground and the
background, the design is carried out from three
Lin, J., Yang, W. and Tan, S.
Combining Transformer and Reverse Attention Mechanism for Polyp Segmentation.
DOI: 10.5220/0012014800003633
In Proceedings of the 4th International Conference on Biotechnology and Biomedicine (ICBB 2022), pages 125-137
ISBN: 978-989-758-637-8
Copyright
c
2023 by SCITEPRESS – Science and Technology Publications, Lda. Under CC license (CC BY-NC-ND 4.0)
125

aspects: gray value, contrast information and texture
information. Includes threshold-based segmentation
algorithm (VARGA-SZEMES, 2016), Boundary-
Based Segmentation Algorithms (GREVE, 2009) and
Segmentation Algorithm Based on Region Growing
(CAO, 2009). Because polyps are the same type, they
may vary in appearance, such as size, texture, and
color. In colonoscopy images, the boundaries
between polyps and surrounding mucosa are often
very blurred, lacking the contrast required by
traditional segmentation algorithms. Using
traditional segmentation algorithms to segment
polyps requires a lot of manpower, low efficiency,
and incomplete segmentation. Due to the limitations
of traditional segmentation algorithms, a better polyp
segmentation method is needed.
With the rapid development of computer
technology and artificial intelligence, many deep
neural networks have emerged, such as FCN (LONG,
2015), U-Net (RONNEBERGER, 2015), SegNet
(BADRINARAYANAN, 2017), DenseNet
(HUANG, 2017) and so on, they can help process
large volumes of colonoscopy image and video data,
assisting clinicians in making decisions about
colonoscopy to detect the presence and classification
of colonic polyps (WANG, 2021). Due to the
versatility and efficiency of deep learning, its
segmentation effect is superior to traditional
segmentation algorithms, and it has been applied in
many fields such as medical image segmentation.
Analyzing the images obtained during
colonoscopy, the borders between the polyp region
and the surrounding mucosa are often very blurred
and lack contrast in most of the images. Due to the
low contrast between the foreground and the
background, more effective context information
cannot be extracted and the segmentation of polyp
regions is incomplete. In this paper, a polyp
segmentation method combining Swin Transformer
and inverse attention mechanism is proposed. The
experimental results show that the method proposed
in this paper has achieved very good results in the
segmentation of polyps compared with the existing
methods.
2 RELATE WORK
With the deepening of research on deep learning-
based methods, many excellent polyp segmentation
methods have emerged:
Fang et al. (FANG, 2019) proposed a selective
feature aggregation network with area and boundary
constraints for polyp segmentation, and proposed a
new loss that considers the correlation between the
area and boundary branches such that the two
branches can influence each other to make
predictions more accurate. Fan et al. (FAN, 2020)
proposed to aggregate features using parallel decoder
components and a recursive reverse attention module,
using parallel connections to aggregate high-level
features. Then, a partial decoder (Pd) (WU, 2019) is
used to compute the global feature map. Finally, the
relationship between the region and the boundary is
established through the global map and the reverse
attention mechanism to achieve accurate
segmentation of the polyp region. Kim et al. (KIM,
2021) proposed to enhance contextual information by
acquiring unidentified region information.
Specifically, it combines foreground and background
regions for the contextual attention module by
computing the scores of regions with blurred
saliency. And we propose parallel axis attention for
backbone feature encoder and initial saliency map
decoder. The network achieves good results on
unseen datasets. Zhao et al. (ZHAO, 2021) proposed
a multi-scale subtractive network segmentation
model, which designed a subtraction unit to generate
the difference features between adjacent layers in the
encoder. Then, different receptive fields are set for
different levels of subtraction units in a pyramid
manner, so as to obtain rich multi-scale difference
information. And this paper establishes a training-
free network to comprehensively supervise the
polygon-aware features from the bottom to the top,
thus facilitating the network to capture more details
and structural cues. Wei et al. (WEI, 2021) proposed
a shallow attention network, which designed a color
exchange operation, mainly to decouple the image
content and color, so that the network model pays
more attention to the shape and structure of the
region. In addition, a shallow attention module is
adopted to filter the background noise of shallow
features. Finally, the paper proposes a probabilistic
correction strategy (PCS) to alleviate the serious
pixel imbalance problem of small polyp targets.
Most of the existing polyp segmentation methods
use VGG (SIMONYAN, 2014) or ResNet (HE, 2016)
as the backbone network to extract features from
pathological images, and design related methods to
improve the segmentation ability of polyp regions.
However, convolution lacks a global understanding
of the image, cannot model the dependencies
between features, and has certain limitations,
Furthermore, the context information cannot be fully
utilized. The Transformer has a strong ability to learn
long-distance dependencies, uses the attention
mechanism to capture global context information,
ICBB 2022 - International Conference on Biotechnology and Biomedicine
126
and can obtain more powerful features, and it has a
strong multi-modal fusion ability, making the
Transformer replace the convolutional neural
network. become possible.
in recent years, many researchers have tried to
transfer the Transformer model from the field of
natural language to computer vision tasks. With the
Image Transformer proposed by Parmar et al.
(PARMAR, 2018) in 2018, the Transformer
architecture was applied to the field of computer
vision, which led to the upsurge of Transformer
research and promoted the rapid development of
Transformer-based vision models. Dong et al.
(DONG, 2021) used Transformer as an encoder,
introduced a cascade fusion module to obtain
semantic and location information of polyp regions
from shallow features, and introduced a camouflage
recognition module to obtain polyp information
camouflaged in deep features. In the similarity
aggregation module, the semantic location
information of the shallow polyp region is extended
to the entire foreground region, so as to fuse the
features of other layers. Compared with existing
polyp segmentation methods, this method achieves
very good experimental results.
With the continuous research on Transformer by
researchers, Liu et al. (LIU, 2021) improved on the
basis of Transformer, which not only has the ability
of Transformer to pay attention to the global
information of the image, but also model the local
image, and it adopts the method of moving window
to realize cross-window connection, so that it can pay
attention to the information of other adjacent
windows and realize feature interaction across
windows, thereby expanding the receptive field and
obtaining more contextual information.
In this paper, Swin Transformer is used as the
backbone network to encode polyp images, and an
inversion attention mechanism is proposed to mine
polyp region information in feature maps, correct
inconsistent regions, suppress irrelevant background
information, and establish a relationship between
foreground regions and boundaries. The relationship
between the two can improve the model to obtain
more semantic information of the polyp region,
thereby improving the accuracy of the model's
segmentation of the polyp boundary.
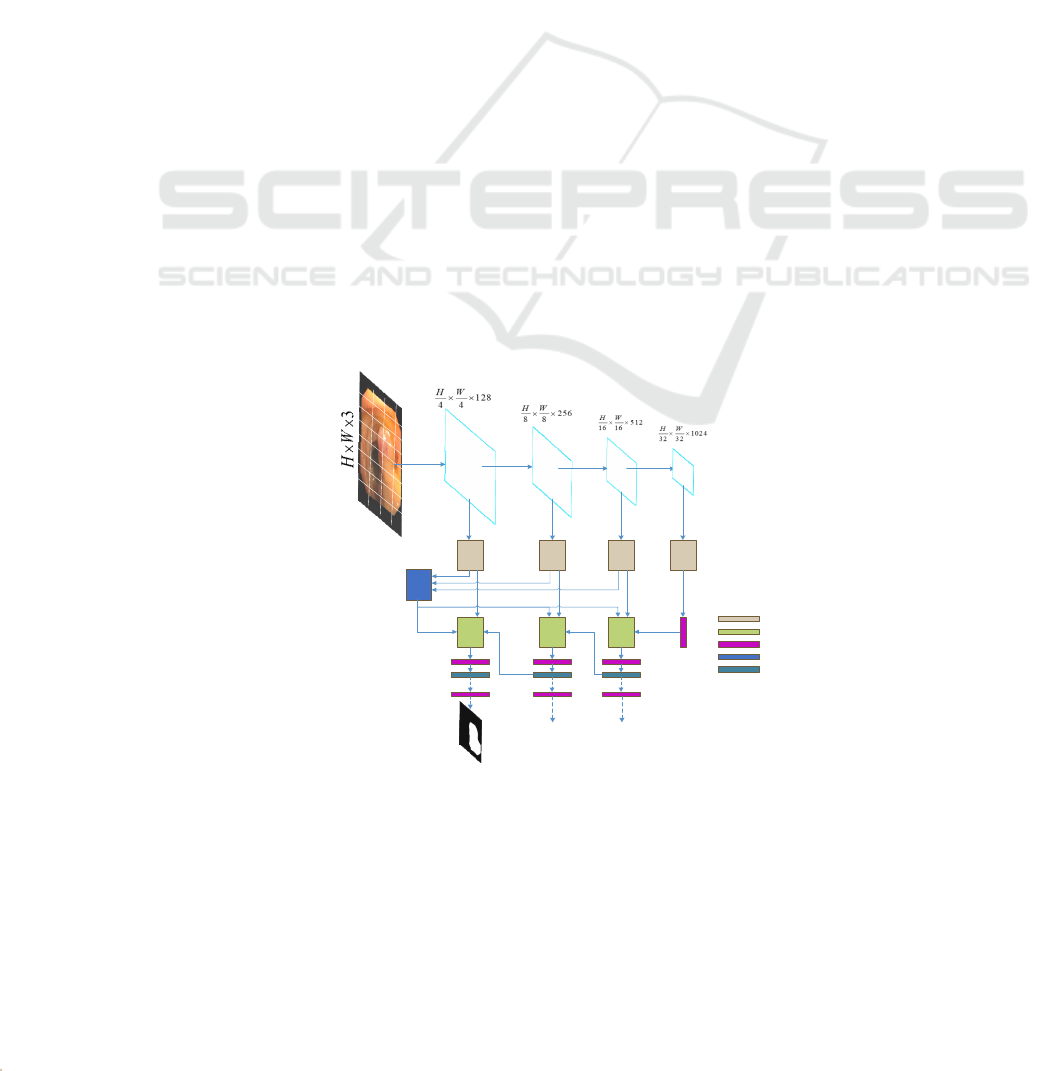
3 THE PROPOSED METHOD
Input an image
H
WC
xR
××
∈
, with an spatial resolution
of
HW×
, and
C
number of channels. Through
CTRNet, output the corresponding pixel-level label
map of size
1HW××
. Figure 1 shows the CTRNet
network structure. First, the input image is divided
into blocks and input into the backbone network Swin
Transformer to encode the image and obtain rich
global semantic information. Next, the receptive field
blocks are used to reduce the number of feature
channels, and the fusion inversion attention and
attention gate modules are used to deeply mine and
correct the target regions. This paper will first
introduce the Swin Transformer backbone network in
Section 2.1. Second, the inverse attention mechanism
will be elaborated in Section 2.2. Section 2.3
introduces the Receptive Field Block, and Section 2.4
introduces Loss Computation.
Reverse Attention Module
Receptive Field Block
Global Map Module
Upsample
Conv 3 x 3,BatchNorm,Relu
Figure 1: CTRNet network structure.
Combining Transformer and Reverse Attention Mechanism for Polyp Segmentation
127

3.1 Swin Transformer
Since polyp images contain significant noise and blur
between the target area and the surrounding mucosa,
it is difficult to extract effective features. Some recent
studies (BHOJANAPALLI, 2021) (XIE, 2021) found
that Transformer (DOSOVITSKIY, 2020) (WANG,
2021) (WANG, 2021) (LIU, 2021) for computer
vision showed stronger performance and better
resistance to input disturbance than CNN (HE, 2016)
(SIMONYAN, 2014) robustness. Inspired by this,
this paper uses the Swin Transformer as the backbone
network to extract more robust and powerful feature
information for subsequent polyp segmentation. Its
structure is shown in Figure 2(a), with a total of 4
layers, each layer is composed of multiple Swin
Transformer blocks. The Swin Transformer block is
shown in Figure 2(b), which consists of Multi-head
Self-Attention (MSA), Multi-layer perceptron
(MLP), and layer normalization, and uses residual
connections.
The Swin Transformer block is calculated as
follows:
ˆ
_(())
iii
YWMSALNY Y=+
(1)
1
ˆ
ˆˆ
(())
iii
Y MLP LN Y Y
+
=+
(2)
211
ˆˆˆ
_(())
iii
YSWMSALNY Y
+++
=+
(3)
222
ˆˆ
(( ))
iii
YMLPLNY Y
+++
=+
(4)
where W_MSA is the window-based multi-head self-
attention and SW_MSA is the shifted window-based
multi-head self-attention. LN is layer normalization.
Input
Patch Partition
Linear Embedding
Swin Transformer Block
Patch Merging
Swin Transformer Block
Swin Transformer Block
Patch Merging
Swin Transformer Block
Patch Merging
2
2
6
2
Layer
Norm
W-MSA
Layer
Norm
MLP
Layer
Norm
SW-MSA
Layer
Norm
MLP
Input
Feature datas
output
(a)
(b)
Figure 2: (a) Backbone network structure (b) Swin Transformer block structure.
3.2 Global Map Module
As shown in Figure 3, the feature map output from
the coding layer is multiplied and aggregated
sequentially from deep-level features to shallow-
level features, and the aggregated features obtain rich
contextual information. Inspired by Cbam (WOO,
2018) proposed by Woo et al., a hybrid attention
mechanism is added to the output process, which is a
fusion mechanism of channel attention and spatial
attention. The final global map is obtained by
sequentially deriving attention maps along two
independent dimensions of channel and space, and
then multiplying the attention maps to the input
feature maps for adaptive feature refinement.
ICBB 2022 - International Conference on Biotechnology and Biomedicine
128

F1
F2
F3
Channel
Attention
Mudule
Spatial
Attention
Mudule
Global Map
Aggregation
Aggregation
Aggregation
Aggregation
Aggregation
Up-sample
Figure 3: Global map module processing.
The channel attention block and the spatial
attention block adopted in the module are similar to
the attention proposed in (WANG, 2020) (LIU,
2020). By aggregating the output features of the
encoding layer, the aggregated features
HWC
F
R
××
∈
are obtained, and then the attention
C
M
of one dimension of the channel is calculated
to obtain the attention weights
11
()
C
C
MF R
××
∈
,
the aggregated features
F
and
'
()
S
M
F
are
multiplied to obtain the feature
'
F
. Then, the
obtained
'
F
is input into the two-dimensional
spatial attention
S
M
, and
'1
()
WH
S
MF R
××
∈
is
calculated. Finally, multiply
'
F
and
'
()
S
M
F
to
get the final feature
'' WHC
F
R
××
∈
. Its calculation
expression is as follows:
'
()
C
FMF F=⊗
(5)
'' ' '
()
S
FMF F=⊗
(6)
In formulas 5 and 6,
⊗
is a transposition
multiplication operation.
F
is the aggregated
feature output.
'
F
and
''
F
are channel attention
output features and mixed attention output features,
respectively.
At the same time of aggregating features, a hybrid
attention mechanism is introduced to refine the
features, so that the network can focus on the target
area more accurately and obtain a fine global map.
3.3 Reverse Attention Mechanism
In order to solve the problem of insufficient
segmentation of the polyp region by the network,
inspired by (FAN, 2020) (CHEN, 2018) (WEI, 2017),
a reverse attention module is introduced in the
upsampling process. Different from (FAN, 2020),
this paper adopts the global The map module fuses
multi-scale features to generate global weights, and
combines the upsampling side output features to
refine the reverse attention weights, and then passes
through the reverse attention module to generate a
rough saliency map from a low-resolution deep layer,
The method of erasure coding layer output side
feature map of foreground object area gradually
mines the distinguishing target area and guides the
segmentation network to find complementary
foreground area and detail information, and adds
attention gate block to suppress irrelevant
background information. In the shallow layer, the
reverse attention module is used repeatedly to correct
the low-resolution rough prediction map and output a
high-resolution and complete saliency map, so as to
improve the segmentation effect of the network.
Concatenate
Global Map
Attention
gate block
Figure 4: Reverse Attention Module processing.
Combining Transformer and Reverse Attention Mechanism for Polyp Segmentation
129
The detailed processing process of the reverse
attention module is shown in Figure 4.
up sampling
f
−
is the output of the upsampling process, and the
feature
f
is the output feature of the encoding
layer. First, the initial weight
p
A
is obtained
through
up sampling
f
−
, and the global map
'' WHC
F
R
××
∈
in Section 3.2 is used as the global
weight
g
A
, and the composite weight
i
A
is
obtained by element-wise addition:
()
iPg
A
sigmoid A A=+
(7)
Next, through a multi-scale weight overlay
strategy. Upsample the deep weights (using bilinear
interpolation here), and then add them to the current
weights. In this way, the completeness of the inverse
attention module for target region extraction is
improved, and some missing details are
supplemented.
'
12
...
iii i
AAA A
−−
=+ + +
(8)
By combining
i
f
and multi-scale attention
weights
'
i
A
, using dot product, the reverse attention
feature
'
i
f
is output:
''
(1 1)
ii i
ff A=−∗+
(9)
Finally, using the attention gate and residual
connection, the output features of the coding layer
and the output features through the reverse attention
are processed and effectively fused, and the
concatenate operation is used to obtain the feature
'
up sampling
f
−
:
' ''
(,(()))
up sampling up sampling i i i
f
cat f Sigmoid RELU f f f
−−
=+×
(10)
In the network, by combining the global weight
and the upsampling weight, the composite weight can
more effectively dig out the structural information of
the foreground area in the feature map, and by erasing
the existing estimated foreground area information
from the output features of the coding layer. Mining
complementary regions and boundary details
sequentially. This bottom-up multi-scale reverse
attention mechanism erases, corrects some
inconsistent areas, suppresses irrelevant information,
and the model can finally refine the coarse and low-
resolution prediction map into a complete exploration
target area and details High-resolution saliency map.
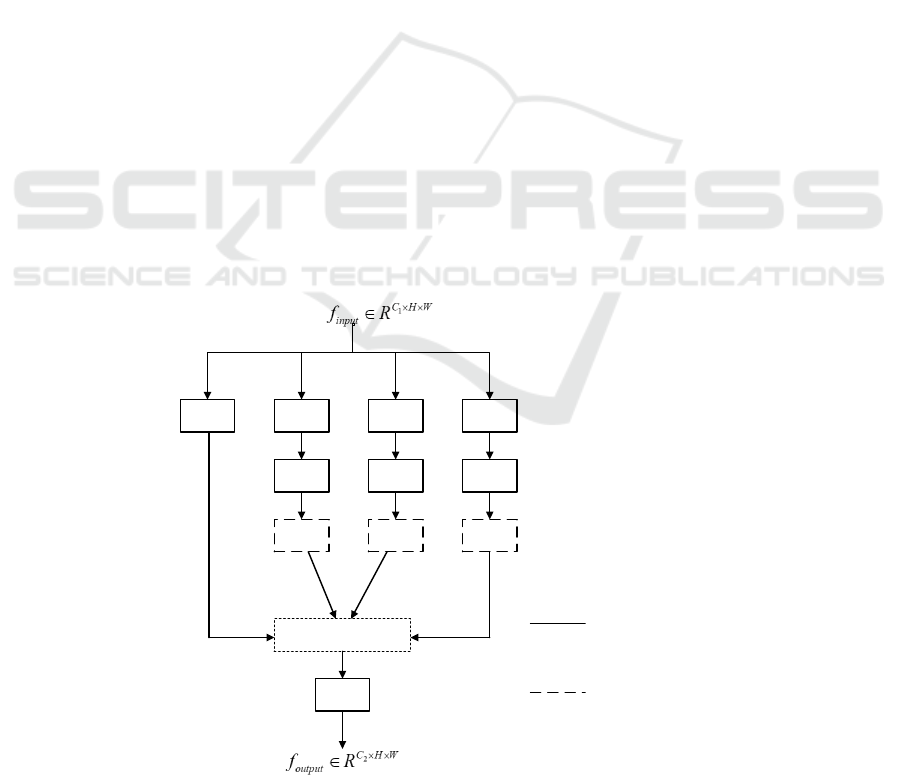
3.4 Receptive Field Block
In the process of skip-level connection, in order to
retain more useful information in the features and
reduce the number of feature channels, this paper
introduces a receptive field block
[35]
( LIU,2018). It is
a multi-branch convolution that uses convolution
kernels of different sizes to obtain features with
different receptive fields in the image. As shown in
Figure 5.
1x1 1x3 1x5 1x7
3x1 5x1 7x1
3x3 3x3 3x3
Concatenate
1x1
Dilated Convolution
Convolution
Figure 5: The processing of the Receptive Field Block.
ICBB 2022 - International Conference on Biotechnology and Biomedicine
130

3.5 Loss Computation
InCTRNet, we use binary cross entropy (BCE) loss
and the weighted IOU loss. It can be expressed as
follows:
total BCE IOU
=+
(11)
The definition of the loss function is the same as
in (FAN, 2020).
I
OU
is the weighted IoU loss,
which is based on global as well as local (pixel-level)
constraints, with
IOU
increasing the weight of
difficult samples to highlight their importance.
BCE
is the binary cross entropy BCE loss, and
BCE
makes the network pay more attention to
difficult samples during the training process, which
does not assign equal weights to all pixels.
4 EXPERIMENTS
4.1 Datasets
In the experiments, we adopt the training dataset from
randomly selected images from Kvasir (JHA, 2020)
and CVC-ClinicDB (BERNAL, 2015). For a fair
comparison with existing methods, the same training
data is extracted as (FAN, 2020) for model training.
Among them, 900 images in the training are from the
Kvasir, and 550 are from the CVC-ClinicDB. And
tested on 5 image-based datasets to verify the
segmentation ability of the network model. The
following are 5 image-based polyp benchmark
datasets used to train and test the model:
(1) Kvasir: This dataset contains 1000 polyp
images, of which 900 are used for network model
training and 100 are used for model testing. It is a
little different from other datasets. The images in the
Kvasir dataset are of different sizes, ranging from
332 487×
to
1920 1072×
, and the size and
shape of the polyp area in the image are also different.
By analyzing the images in the dataset, the proportion
of the polyp area in the image is also different. About
0.79% to 62.13%, the proportion of foreground area
varies greatly. Therefore, testing with this dataset is
somewhat challenging.
(2) CVC-ColonDB (TAJBAKHSH, 2015): This
dataset consists of 380 images sampled from 15
different sequences of colonoscopy. Its image size is
384 288× . Analyzing the images in the ColonDB
dataset, the proportion of polyp target regions was
approximately between 0.30% and 63.15%. In this
paper, this dataset is used to test the generalization
ability of the network model.
(3) CVC-ClinicDB (BERNAL, 2015): This
dataset consists of 612 images extracted from 25
colonoscopy videos. Its image size is
384 288×
.
The images used for network model training and
testing are 550 and 62, respectively. Analyzing the
images in the ClinicDB dataset, the proportion of
polyp target regions was approximately between
0.34% and 45.88%.
(4) EndoScene (VáZQUEZ, 2017): This dataset
consists of 912 images extracted from 44
colonoscopy sequences of 36 patients. Since
EndoScene is combined by CVC-ClinicDB and
CVC-300, CVC-300 is used as the test dataset for the
model, with a total of 60 polyp sample images with a
size of
574 500×
. Analysis of images in the CVC-
300 dataset showed that the proportion of polyp
target regions ranged from approximately 0.55% to
18.42%.
(5) ETIS (SILVA, 2014): This dataset has 196
images extracted from 34 colonoscopy videos, all of
which are of size
1225 966× . By observing the
images in this dataset, it can be seen that the target
area is small. In the experiment, when the image input
size is adjusted, the target area is proportionally
reduced, and it is very challenging to use the model
to segment it. Analyzing images in the ETIS dataset,
the proportion of polyp target regions ranged from
approximately 0.11% to 29.05%.
4.2 Implementation Details
The network model proposed in this paper is
implemented using the Pytorch framework and
accelerated by TITAN RTX GPU. In the training
phase, image preprocessing operations such as
normalization, rotation, and horizontal flipping are
performed. The size of the polyp image input into the
network model is uniformly adjusted to
352 352×
. The network was initialized with the parameters pre-
trained on ImageNet from the Swin Transformer
model. 16 batches are set, the learning rate is set to
1e-4, and the model is trained for 100 epochs using
the adamW optimizer with a multi-scale training
strategy
{0.75,1.0,1.25}
.
4.3 Evaluation Metrics
In the deep learning neural network model, it is very
important to use the evaluation index to evaluate the
Combining Transformer and Reverse Attention Mechanism for Polyp Segmentation
131

performance of the network model. Evaluate
different models through a variety of evaluation
indicators, and select the model with the best
performance or further optimize the model through
indicators. In order to better compare with the
existing methods, the method in this paper adopts the
same evaluation index as (FAN, 2020). include:
(1) mDice: Calculate the similarity between the
predicted target area and the actual target area.
(2) mIou: Calculate the ratio of the intersection
and union of two sets of network predictions and
actual values.
(3) 𝐹
(MARGOLIN, 2014): Weighted
similarity measure coefficients to fix the "equally
important flaws" problem in Dice.
(4) 𝐸
(FAN, 2018): Enhanced alignment
metrics.
(5)
S
α
(FAN, 2017): Structural similarity
measure (Structure-measure), which measures the
structural similarity between the predicted image and
the actual image.
(6) MAE: Compare the pixel-by-pixel absolute
value difference between the predicted value and the
actual value.
4.4 Experiments on Polyp Segmentation
Kvasir is the largest dataset released recently. The
images vary in size, and when analyzing the images
in this dataset, the appearance and texture of the
polyp regions within them vary widely. So
segmenting this dataset is quite challenging.
On this dataset, this paper selects 8 existing polyp
segmentation methods to compare with the method
proposed in this paper. The relevant experimental
results are shown in Table1. The current state-of-the-
art method selected includes the enhanced context
information model (KIM, 2021), Inverse Attention
Model (FAN, 2020), Area and Boundary Constrained
Selective Feature Aggregation Model (FANG, 2019),
Transformer-based Networks (DONG, 2021), and
some other deep learning models (RONNEBERGER,
2015) (ZHOU, 2018) (PATEL, 2021) (WEI, 2021).
As can be seen from Table 1. Compared with the
latest Transformer-based model Polyp-PVT, the
mDICE is increased by 0.5%, achieving the best
mDice, and other evaluation indicators also exceed
the existing state-of-the-art methods. Compared with
the mIOU, CTRNet is 1.2 % improvement over
Polyp-PVT. It can be seen that the CTRNet model
proposed in this paper can segment a more complete
polyp region than Polyp-PVT.
Among them, the PraNet (FAN, 2020) method
uses reverse attention in the network, and the reverse
attention mechanism proposed in this paper is also
improved on this method. Through experiments, the
effectiveness of the reverse attention mechanism
proposed in this paper is fully demonstrated.
Therefore, the CTRNet proposed in this paper can
accurately localize and segment polyp regions in
many challenging and complex scenarios.
Table 1: Quantitative results on Kvasir, comparing with the previous State-of-the-art methods.
methods year mDice mIou
F
ω
β
S
α
MAE
max
E
φ
U-Net
[10]
2015 0.818 0.746 0.794 0.858 0.055 0.893
Unet++
[44]
2018 0.821 0.743 0.808 0.862 0.048 0.910
SFA
[14]
2019 0.723 0.611 0.670 0.782 0.075 0.849
PraNet
[15]
2019 0.898 0.840 0.885 0.915 0.030 0.948
EU-Net
[45]
2021 0.908 0.854 0.893 0.917 0.028 0.954
SANet
[19]
2021 0.904 0.847 0.892 0.915 0.028 0.953
UACANet
[17]
(S) 2021 0.905 0.852 0.897 0.914 0.026 0.951
UACANet
[17]
(L) 2021 0.912 0.859 0.902 0.917 0.025 0.958
Polyp-PVT
[23]
2021 0.917 0.864 0.911 0.925 0.023 0.962
CTRNet 0.922 0.876 0.918 0.928 0.023 0.964
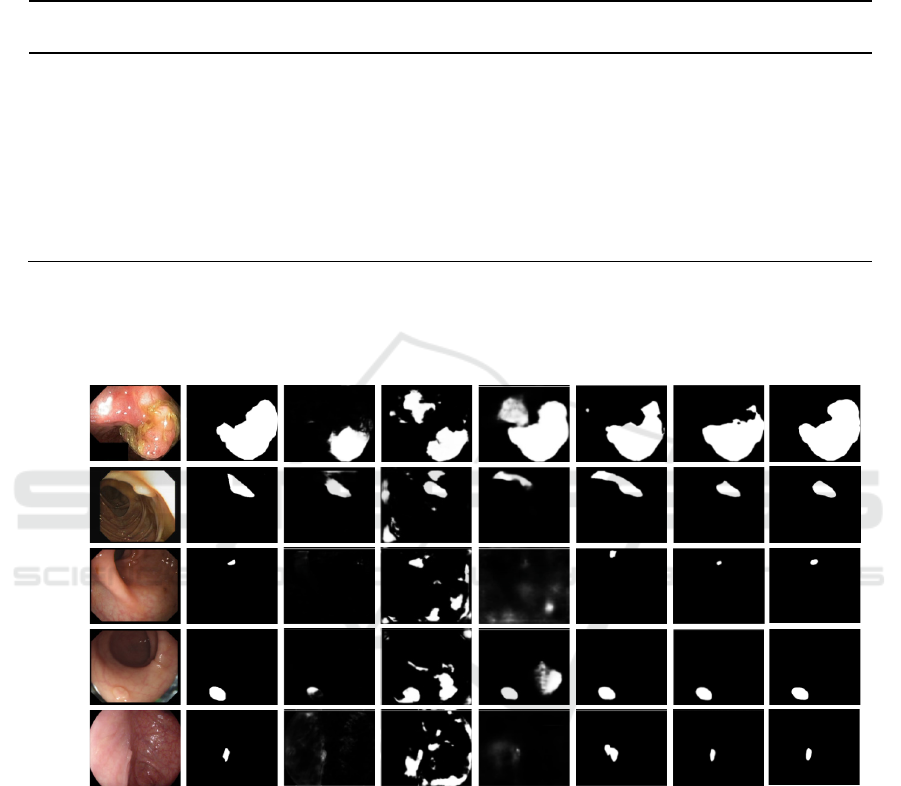
As shown in Table 2. On the CVC-ClinicDB,
CTRNet improves by 0.3 percentage points and 1.4
percentage points compared to the Transformer-
based methods Polyp-PVT and UACANet(L). As
shown in Figure 6. Partial segmentation results of the
two polyp segmentation methods proposed in this
chapter and other methods on 5 benchmarks are
shown. It can be intuitively shown that the
segmentation method proposed in this paper
compares the segmentation results of other methods
in polyp regions of different sizes, and the
segmentation of polyp target regions is more
complete and closer to the actual labeling results.
ICBB 2022 - International Conference on Biotechnology and Biomedicine
132

Table 2: Quantitative results on CVC-ClinicDB, comparing with the previous State-of-the-art methods.
methods year mDice mIou
F
ω
β
S
α
MAE
max
E
φ
U-Net
[10]
2015 0.823 0.755 0.811 0.889 0.019 0.954
Unet++
[44]
2018 0.794 0.729 0.785 0.873 0.022 0.931
SFA
[14]
2019 0.700 0.607 0.647 0.793 0.042 0.885
PraNet
[15]
2019 0.899 0.849 0.896 0.936 0.009 0.979
EU-Net
[45]
2021 0.902 0.846 0.891 0.936 0.011 0.965
SANet
[19]
2021 0.916 0.859 0.909 0.939 0.012 0.976
UACANet
[17]
(S) 2021 0.916 0.870 0.917 0.940 0.008 0.968
UACANet
[17]
(L) 2021 0.926 0.880 0.928 0.943 0.006 0.976
Polyp-PVT
[23]
2021 0.937 0.889 0.936 0.949 0.006 0.989
CTRNet 0.940 0.891 0.941 0.947 0.006 0.989
This paper uses datasets not involved in training
(ColonDB, EndoScene, ETIS) to test the
generalization ability of the proposed model (the
training datasets used by the network model are only
from Kvasir and CVC-ClinicDB). The experimental
results are shown in Tables 3, 4 and 5. In the ETIS,
the proportion of polyp target regions in most images
is very low. Therefore, it is very difficult and
challenging to segment polyp regions for prediction.
However, CTRNet achieves mDice of 79.3% on
ETIS, which is 0.6 % higher than the Transformer-
based method Polyp-PVT, and 2.7 % and 4.3 %
higher than the UACANet(L) method and the SANet
method, respectively. To sum up, the network model
proposed in this paper has good generalization
ability.
Table 3: Quantitative results on ETIS, comparing with the previous State-of-the-art methods.
methods year mDice mIou
F
ω
β
S
α
MAE
max
E
φ
U-Net
[10]
2015 0.398 0.335 0.366 0.684 0.036 0.740
SFA
[14]
2019 0.297 0.217 0.231 0.557 0.109 0.633
PraNet
[15]
2019 0.628 0.567 0.600 0.794 0.031 0.841
EU-Net
[45]
2021 0.687 0.609 0.636 0.793 0.067 0.841
SANet
[19]
2021 0.750 0.654 0.685 0.849 0.015 0.897
UACANet
[17]
(S) 2021 0.694 0.615 0.650 0.815 0.023 0.851
UACANet
[17]
(L) 2021 0.766 0.689 0.740 0.859 0.012 0.905
Polyp-PVT
[23]
2021 0.787 0.706 0.750 0.871 0.013 0.910
CTRNet 0.793 0.713 0.758 0.871 0.011 0.925
Table 4: Quantitative results on EndoScene, comparing with the previous State-of-the-art methods.
methods year mDice mIou
F
ω
β
S
α
MAE
max
E
φ
U-Net
[10]
2015 0.710 0.627 0.684 0.843 0.022 0.876
SFA
[14]
2019 0.467 0.329 0.341 0.640 0.065 0.817
PraNet
[15]
2019 0.871 0.797 0.843 0.925 0.010 0.972
EU-Net
[45]
2021 0.837 0.765 0.805 0.904 0.015 0.933
SANet
[19]
2021 0.888 0.815 0.859 0.928 0.008 0.972
UACANet
[17]
(S) 2021 0.902 0.837 0.886 0.934 0.006 0.976
UACANet
[17]
(L) 2021 0.910 0.849 0.901 0.937 0.005 0.980
Polyp-PVT
[23]
2021 0.900 0.833 0.884 0.935 0.007 0.981
CTRNet 0.890 0.811 0.869 0.918 0.007 0.969
Combining Transformer and Reverse Attention Mechanism for Polyp Segmentation
133
On the EndoScene, the experimental results of
CTRNet are better than most existing polyp
segmentation methods. Among them, CTRNet and
SANet have achieved a comparable level. Compared
with EU-Net, the mDice has increased by 5.3 %, and
the mIou has increased by 4.6 %.
Table 5: Quantitative results on CVC-ColonDB, comparing with the previous State-of-the-art methods.
methods year mDice mIou
F
ω
β
S
α
MAE
max
E
φ
U-Net
[10]
2015 0.512 0.444 0.498 0.712 0.061 0.776
SFA
[14]
2019 0.469 0.347 0.379 0.634 0.094 0.765
PraNet
[15]
2019 0.709 0.640 0.696 0.819 0.045 0.869
EU-Net
[45]
2021 0.756 0.681 0.730 0.831 0.045 0.872
SANet
[19]
2021 0.753 0.670 0.726 0.837 0.043 0.878
UACANet
[17]
(S) 2021 0.783 0.704 0.772 0.848 0.034 0.897
UACANet
[17]
(L) 2021 0.751 0.678 0.746 0.835 0.039 0.878
Polyp-PVT
[23]
2021 0.808 0.727 0.795 0.865 0.031 0.919
CTRNet 0.775 0.695 0.763 0.839 0.034 0.899
On the ColonDB, STRNet improves the mDice by
2.4 % and the mIou by 1.7 % over the UACANet (L)
method. The experimental results outperform most
existing state-of-the-art methods.
ORiginal Image label
Kvasir
CVC-
ClinicDB
ETIS
CVC-
ColonDB
EndoScene
Unet++ SFA PraNet
UACANet-S
UACANet-L
CTRNet
Figure 6: Qualitative Results of different methods on five different benchmarks.
4.5 Ablation Study
In this section, ablation experiments are performed
on the CTRNet proposed in this section, and the
network model components are tested on both visible
and unseen datasets to gain a deeper understanding of
the model.
Table 6 shows the ablation experiment results of
the polyp segmentation method based on Swin
Transformer and inverse attention. Among them,
Backbone: use the backbone network Swin
Transformer for training (without any components);
RAM: Reverse Attention mechanism.
Effectiveness of Reverse Attention Mechanism
(RAM). As shown in Table 6, this paper conducts
ablation experiments on 5 datasets. It can be found
that the experimental results after adding the reverse
attention mechanism to the backbone network, the
average similarity coefficient and the average
intersection ratio and other related evaluations have a
great effect. increase in magnitude. Especially on the
latest dataset Kvasir, the mDice and mIou are
improved by 2.4 % and 2.8 %. On the ETIS, because
ICBB 2022 - International Conference on Biotechnology and Biomedicine
134

the proportion of polyp regions in this dataset is very
low, it is difficult to segment it. In the experiment
using the backbone network, the mDice and mIou
were obtained. 0.720 and 0.634, but adding the
reverse After the attention mechanism, the network
improved by 7.3 % and 7.9 %. It can be seen that the
reverse attention mechanism proposed in this paper
has played a certain role in the network, which can
effectively mine target area information, correct
inconsistent areas, suppress irrelevant background
information, and accurately segment polyp areas.
Table 6: Ablation study for CTRNet.
Datasets
Module Evaluation indicators
Backbone RAM mDice mIou
F
ω
β
S
α
MAE
max
E
φ
Kvasir
√ 0.898 0.848 0.891 0.910 0.028 0.952
√
√
0.922 0.876 0.918 0.928 0.023 0.964
CVC-ClinicDB
√
0.901 0.848 0.890 0.928 0.010 0.959
√
√
0.940 0.891 0.941 0.947 0.006 0.989
CVC-ColonDB
√
0.744 0.664 0.717 0.825 0.046 0.864
√
√
0.775 0.695 0.763 0.839 0.034 0.899
EndoScene
√
0.862 0.777 0.823 0.907 0.009 0.947
√
√
0.890 0.811 0.869 0.918 0.007 0.969
ETIS
√
0.720 0.634 0.667 0.833 0.024 0.841
√
√
0.793 0.713 0.758 0.871 0.011 0.925
5 CONCLUSION
Aiming at the problems of incomplete segmentation
of polyp regions in the current methods of intestinal
polyp segmentation, this paper proposes an inversion
attention mechanism, and designs a polyp network
combining Swin Transformer and inversion
attention, which is mainly used for intestinal polyps.
segmentation. First of all, the coding layer uses the
swin Transformer to encode the image. The polyp
image is partially modeled by layers, and long-
distance dependencies are obtained. The receptive
field is gradually expanded, and the contextual
information of the target area is obtained to solve the
problem of polyp image feature extraction. Secondly,
an inversion attention mechanism is proposed to mine
the polyp region information in the feature map,
correct the inconsistent regions, establish the
relationship between the foreground region and the
boundary, improve the model to obtain more
semantic information of the polyp region, and
Through the attention gate, irrelevant background
information in the feature can be suppressed, thereby
improving the accuracy of the model's segmentation
of polyp boundaries, and solving the problems of
insufficient and excessive segmentation of polyp
regions. Our network achieves 0.922 mDICE and
0.876 mIOU on the latest dataset Kvasir. In order to
compare with existing state-of-the-art methods, the
input image of the network model adopts the same
fixed size. However, the image sizes of different
datasets are different, and the fixed size will greatly
affect the final segmentation result, especially for the
segmentation of small target areas of some polyps,
the effect is not particularly ideal. Afterwards, the
model will be further improved for the small target
problem.
ACKNOWLEDGMENTS
This work was supported in part by the National
Natural Science Foundation of China
(No.U1603115), National key R\&D plan project
(2017YFC08207023) and National Engineering
Laboratory for Public Safety Risk Perception and
Control by Big Data (XJ201810101).
REFERENCES
Badrinarayanan V, Kendall A, Cipolla R. Segnet: A deep
convolutional encoder-decoder architecture for image
segmentation [J]. IEEE transactions on pattern analysis
and machine intelligence, 2017, 39(12): 2481-95.
Bernal J, Sánchez F J, Fernández-Esparrach G, et al. WM-
DOVA maps for accurate polyp highlighting in
colonoscopy: Validation vs. saliency maps from
physicians [J]. Computerized Medical Imaging and
Graphics, 2015, 43: 99-111.
Combining Transformer and Reverse Attention Mechanism for Polyp Segmentation
135

Bhojanapalli S, Chakrabarti A, Glasner D, et al.
Understanding Robustness of Transformers for Image
Classification [J]. 2021.
Breier M, Summers R M, Ginneken B V, et al. Active
contours for localizing polyps in colonoscopic NBI
image data [J]. International Society for Optics and
Photonics, 2011, 7963: 79632M.
Cao C X, Dong H W. Mesh model segmentation based on
region growth [J]. Computer Engineering and
Applications, 2008.
Chen S, Tan X, Wang B, et al. Reverse attention for salient
object detection; proceedings of the Proceedings of the
European Conference on Computer Vision (ECCV), F,
2018 [C].
Done J Z, Fang S H. Young-onset colorectal cancer: A
review [J]. World Journal of Gastrointestinal
Oncology, 2021, 13(8): 856.
Dong B, Wang W, Fan D P, et al. Polyp-PVT: Polyp
Segmentation with Pyramid Vision Transformers [J].
2021.
Dosovitskiy A, Beyer L, Kolesnikov A, et al. An Image is
Worth 16x16 Words: Transformers for Image
Recognition at Scale [J]. 2020.
Fang Y, Chen C, Yuan Y, et al. Selective feature
aggregation network with area-boundary constraints
for polyp segmentation; proceedings of the
International Conference on Medical Image Computing
and Computer-Assisted Intervention, F, 2019 [C].
Springer.
Fan D-P, Ji G-P, Zhou T, et al. Pranet: Parallel reverse
attention network for polyp segmentation; proceedings
of the International Conference on Medical Image
Computing and Computer-Assisted Intervention, F,
2020 [C]. Springer.
Fan D-P, Gong C, Cao Y, et al. Enhanced-alignment
measure for binary foreground map evaluation [J].
arXiv preprint arXiv:180510421, 2018.
Fan D-P, Cheng M-M, Liu Y, et al. Structure-measure: A
new way to evaluate foreground maps; proceedings of
the Proceedings of the IEEE international conference
on computer vision, F, 2017 [C].
freddie, Bray, Jacques, et al. Global cancer statistics 2018:
GLOBOCAN estimates of incidence and mortality
worldwide for 36 cancers in 185 countries [J]. CA: a
cancer journal for clinicians, 2018.
Greve D N, Fischl B. Accurate and robust brain image
alignment using boundary-based registration [J].
Neuroimage, 2009, 48(1): 63-72.
Huang G, Liu Z, Van Der Maaten L, et al. Densely
connected convolutional networks; proceedings of the
Proceedings of the IEEE conference on computer
vision and pattern recognition, F, 2017 [C].
He K, Zhang X, Ren S, et al. Deep Residual Learning for
Image Recognition [J]. IEEE, 2016.
Jha D, Smedsrud P H, Riegler M A, et al. Kvasir-seg: A
segmented polyp dataset; proceedings of the
International Conference on Multimedia Modeling, F,
2020 [C]. Springer.
Kaminski M F, Robertson D J, Senore C, et al. Optimizing
the Quality of Colorectal Cancer Screening Worldwide
[J]. Gastroenterology, 2019, 158(2).
Kim T, Lee H, Kim D. UACANet: Uncertainty Augmented
Context Attention for Polyp Segmentation;
proceedings of the Proceedings of the 29th ACM
International Conference on Multimedia, F, 2021 [C].
Lieberman D A, Rex D K, Winawer S J, et al. Guidelines
for colonoscopy surveillance after screening and
polypectomy: a consensus update by the US Multi-
Society Task Force on Colorectal Cancer [J].
Gastroenterology, 2012, 143(3): 844-57.
Liu Z, Lin Y, Cao Y, et al. Swin Transformer: Hierarchical
Vision Transformer using Shifted Windows [J]. 2021.
Liu J, Zhang W, Tang Y, et al. Residual feature aggregation
network for image super-resolution; proceedings of the
Proceedings of the IEEE/CVF Conference on
Computer Vision and Pattern Recognition, F, 2020 [C].
Liu S, Huang D. Receptive field block net for accurate and
fast object detection; proceedings of the Proceedings of
the European Conference on Computer Vision
(ECCV), F, 2018 [C].
Long J, Shelhamer E, Darrell T. Fully convolutional
networks for semantic segmentation; proceedings of
the Proceedings of the IEEE conference on computer
vision and pattern recognition, F, 2015 [C].
Margolin R, Zelnik-Manor L, Tal A. How to evaluate
foreground maps?; proceedings of the Proceedings of
the IEEE conference on computer vision and pattern
recognition, F, 2014 [C].
Parmar N, Vaswani A, Uszkoreit J, et al. Image
Transformer [J]. 2018.
Patel K, Bur A M, Wang G. Enhanced U-Net: A Feature
Enhancement Network for Polyp Segmentation [J].
2021.
Ronneberger O, Fischer P, Brox T. U-net: Convolutional
networks for biomedical image segmentation;
proceedings of the International Conference on
Medical image computing and computer-assisted
intervention, F, 2015 [C]. Springer.
Simonyan K, Zisserman A. Very Deep Convolutional
Networks for Large-Scale Image Recognition [J].
Computer Science, 2014.
Silva J, Histace A, Romain O, et al. Toward embedded
detection of polyps in wce images for early diagnosis
of colorectal cancer [J]. International journal of
computer assisted radiology and surgery, 2014, 9(2):
283-93.
Tajbakhsh N, Gurudu S R, Liang J. Automated polyp
detection in colonoscopy videos using shape and
context information [J]. IEEE transactions on medical
imaging, 2015, 35(2): 630-44.
Varga-Szemes A, Muscogiuri G, Schoepf U J, et al.
Clinical feasibility of a myocardial signal intensity
threshold-based semi-automated cardiac magnetic
resonance segmentation method [J]. European
radiology, 2016, 26(5): 1503-11.
Vázquez D, Bernal J, Sánchez F J, et al. A benchmark for
endoluminal scene segmentation of colonoscopy
ICBB 2022 - International Conference on Biotechnology and Biomedicine
136

images [J]. Journal of healthcare engineering, 2017,
2017.
Wang X,Huang J,Ji X,et al.Application of artificial
intelligence for detection and classisfication of colon
polyps[J]. Journal of Southern Medical University,
2021. 41 (2):4.
Wang W, Xie E, Li X, et al. Pyramid Vision Transformer:
A Versatile Backbone for Dense Prediction without
Convolutions [J]. 2021.
Wang W, Xie E, Li X, et al. PVTv2: Improved Baselines
with Pyramid Vision Transformer [J]. 2021.
Wang Q, Wu B, Zhu P, et al. ECA-Net: efficient channel
attention for deep convolutional neural networks, 2020
IEEE; proceedings of the CVF Conference on
Computer Vision and Pattern Recognition (CVPR)
IEEE, F, 2020 [C].
Wei J, Hu Y, Zhang R, et al. Shallow Attention Network
for Polyp Segmentation [J]. 2021.
Wei Y, Feng J, Liang X, et al. Object region mining with
adversarial erasing: A simple classification to semantic
segmentation approach; proceedings of the
Proceedings of the IEEE conference on computer
vision and pattern recognition, F, 2017 [C].
Woo S, Park J, Lee J-Y, et al. Cbam: Convolutional block
attention module; proceedings of the Proceedings of the
European conference on computer vision (ECCV), F,
2018 [C].
Wu Z, Su L, Huang Q. Cascaded partial decoder for fast
and accurate salient object detection; proceedings of
the Proceedings of the IEEE/CVF Conference on
Computer Vision and Pattern Recognition, F, 2019 [C].
Xie E, Wang W, Yu Z, et al. SegFormer: Simple and
Efficient Design for Semantic Segmentation with
Transformers [J]. 2021.
Zhao X, Zhang L, Lu H. Automatic Polyp Segmentation
via Multi-scale Subtraction Network [J]. 2021.
Zhou Z, Siddiquee M M R, Tajbakhsh N, et al. Unet++: A
nested u-net architecture for medical image
segmentation [M]. Deep learning in medical image
analysis and multimodal learning for clinical decision
support. Springer. 2018: 3-11.
.
Combining Transformer and Reverse Attention Mechanism for Polyp Segmentation
137
