
Detection of Sleep Staging from EEG: A Comparison of Feature
Dimensionality Reduction and Classifier Selection
Xiaotong Ding
1,*
, Lei Yang
1
, Zhongcai Liao
2
and Yanwen Fang
2
1
China Academy of Information and Communications Technology, Beijing 100191, China
2
Zhejiang Heye Health Technology, Anji 313300, China
Keywords:
Factor Analysis, Principal Component Analysis, Autoencoders, Random Forest, Support Vector Machine,
Sleep Staging.
Abstract:
Sleep is an important part of maintaining human health. With the high incidence of sleep disorders, sleep
has attracted much attention. Sleep staging is an effective means to study sleep structure. This paper studies
the effect of different feature dimensionality reduction algorithms on the accuracy of sleep analysis, including
the influence of principal component analysis, factor analysis and autoencoders on common classifiers,
s u c h a s random forest and support vector machine for automated sleep stage detection. The combination
with the highest accuracy was used to verify the sleep EEG data obtained in our laboratory. The results show
that, using autoencoders to reduce dimension can keep the performance of the model, while using principal
component analysis and factor analysis can improve the accuracy of the model in most cases.
1 INTRODUCTION
According to the WHO survey, about 30% people
worldwide suffer from sleep disorders. The automatic
sleep stage classification algorithm helps to improve
the detection efficiency and reduce the detection time.
A large number of studies have proposed methods
for automatic sleep staging (Chriskos, 2018;
Aboalayon, 2015; Sanders, 2014). Features are
usually used as the input of classical classification
algorithms, such as support vector machine (SVM)
(Zhang, 2014), k- nearest neighbor (Malaekah, 2014),
RF etc. In recent years, neural networks have also
been widely used in automatic classification of sleep
stages. Different architectures were created, such as
convolution (Tsinalis, 2016), and the deep neural
network architecture (Stanislas Chambon, 2018).
Different methods are proposed to reduce the content
of large data. Fan et al. (Fan, 2018) used multi-scale
entropy combined with principal component analysis
(PCA) to extract features and automatically detect
sleep stages in MIT-BIH database. The final accuracy
rate reached 87.9%. Autoencoders (AE) can
compress the input data in different degrees (Najdi,
2017).
In this paper, the influence of different
dimensionality reduction methods on different types
of classifier models will be evaluated. By using less
computational load, the memory consumption can be
reduced, and more modal information can be fused
for sleep staging in the future, which increases the
variability of classification model and expands its
applicability.
2 MATERIALS AND METHODS
As shown in Figure 1, after feature extraction and
dimension reduction technology are applied, the
obtained feature data is used to train the classifiers.
Then the obtain training classification model is tested.
In the case of cross-validation, the performance of
each model is evaluated. The best performance model
is used to identify the existing sleep EEG data in our
laboratory by stages.
266
Ding, X., Yang, L., Liao, Z. and Fang, Y.
Detection of Sleep Staging from EEG: A Comparison of Feature Dimensionality Reduction and Classifier Selection.
DOI: 10.5220/0012019300003633
In Proceedings of the 4th International Conference on Biotechnology and Biomedicine (ICBB 2022), pages 266-269
ISBN: 978-989-758-637-8
Copyright
c
2023 by SCITEPRESS – Science and Technology Publications, Lda. Under CC license (CC BY-NC-ND 4.0)
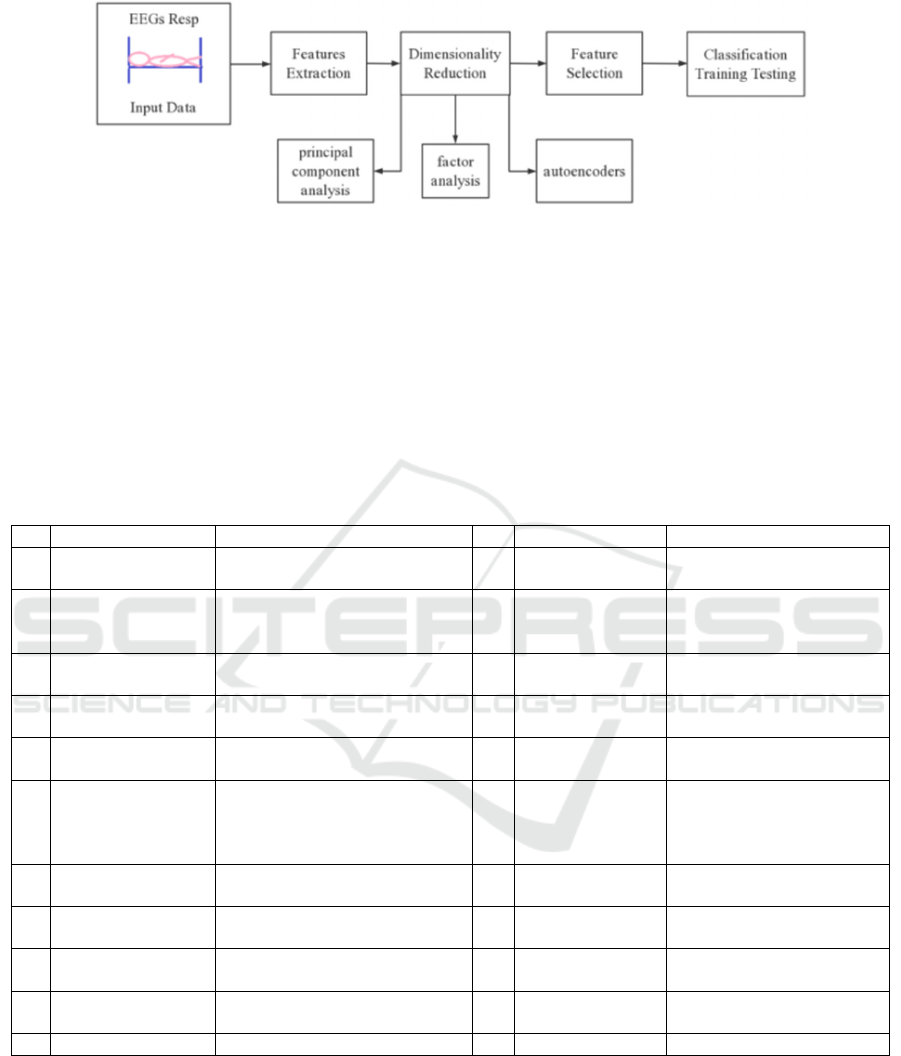
Figure 1: Overview of the method of obtaining the automatic sleep stage model from polysomnographic recordings.
●Data set description: The sleep EEG data in our
laboratory includes the sleep EEG data of 41 male
students in college for 2 nights each, of which 20
sleep on ordinary mattresses and 21 sleep on sleeping
mattresses with magnets. The sampling frequency is
100hz and the acquisition channel is Pz-Oz.
The distribution of sleep stages in the whole sleep
is unequal. To provide the classifier with the same
amount of data from each sleep stage category, we
preprocessed the category distribution in the dataset.
We selected the smallest available category and
randomly sampled other categories, so that all sleep
stages have the same performance in the input seen
by the classifier.
●Extracted features: Table 1 lists the general
situation of all extracted features. Each sleep stage is
represented by different EEG features.
Table 1: The general situation of all extracted features.
i
d
Feature Description i
d
Feature Description
1 Spectral power spectral power: absolute 12
Amplitude env
mean
envelope: mean value
2
Spectral relative
power
spectral power: relative
(normalised to total spectral
p
ower)
13
Amplitude env
SD
envelope: standard
deviation
3 Spectral flatness
spectral entropy: Wiener
(
measure of s
p
ectral flatness
)
14 rEEG mean range EEG: mean
4 Spectral diff
difference between consecutive
short-time spectral estimates
15 rEEG median range EEG: median
5 Spectral entropy spectral entropy: Shannon 16
rEEG lower
margin
range EEG: lower margin
(5th percentile)
6
Spectral edge
frequency
spectral edge frequency: 95% of
spectral power contained
between 0.5 and fc Hz (cut-off
fre
q
uenc
y)
17
rEEG upper
margin
range EEG: upper margin
(95th percentile)
7 FD fractal dimension 18 rEEG width
range EEG: upper margin -
lower mar
g
in
8
Amplitude total
p
owe
r
time-domain signal: total power 19 rEEG SD
range EEG: standard
deviation
9 Amplitude SD
time-domain signal: standard
deviation
20 rEEG CV
range EEG: coefficient of
variation
10 Amplitude skew time-domain signal: skewness 21 rEEG asymmetry
range EEG: measure of
skew about median
11 Am
p
litude kurtosis time-domain si
g
nal: kurtosis
●Dimensionality reduction and Classification:
The purpose of feature dimension reduction is to
reduce the amount of computation and memory
requirements, at the same time try to improve the
performance through different feature expressions.
This paper reduced the total number of features to 10,
20 and 40 components. Three dimensionality
reduction methods are used, including PCA, FA and
AE (The implementation of AE is shown in Figure 2.
The model was fitted with 16 batch size to avoid over-
fitting, and was carried out within 100 epochs.).
Detection of Sleep Staging from EEG: A Comparison of Feature Dimensionality Reduction and Classifier Selection
267
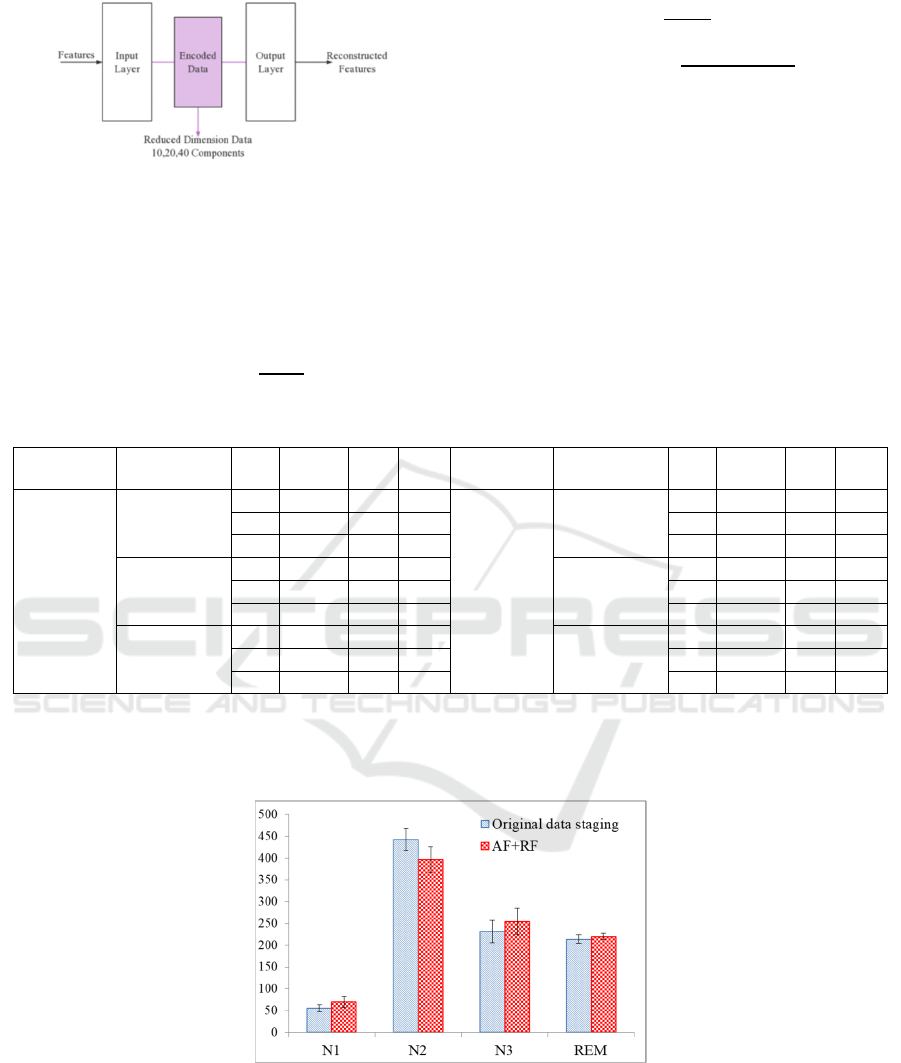
Figure 2: Dimensionality reduction with autoencoders.
We choose two classifiers to evaluate: One is RF
(Twenty decision trees were used.). The other is SVM.
Each generated model was evaluated by 10 times
cross validation. The average accuracy and F1
of all sleep stage categories were used to compare the
performance.
Precision
(1)
Recall
(2)
F1
2∗
∗
(3)
where TP – true positive, TN – true negative, FP –
false positive, FN – false negative.
3
RESULTS
Table 2 shows the results. For the automated sleep
stage scoring using SVM and RF, after using FA, 20
components are obtained by feature decomposition,
and then by using RF the classification accuracy
increased to 88%.
Table 2: The change results of different dimension reduction algorithms (PCA, FA, AE).
Classification Dimensionality NO. Precision Recall
F1-
score
Classification Dimensionality NO. Precision Recall
F1-
score
SVM
PCA
10 0.75 0.76 0.75
RF
PCA
10 0.82 0.81 0.81
20 0.75 0.76 0.75 20 0.83 0.83 0.83
40 0.75 0.76 0.75 40 0.88 0.88 0.88
FA
10 0.81 0.82 0.81
FA
10 0.79 0.80 0.80
20 0.86 0.67 0.70 20 0.88 0.88 0.88
40 0.86 0.67 0.70 40 0.87 0.87 0.87
AE
10 0.76 0.77 0.81
AE
10 0.80 0.80 0.80
20 0.83 0.68 0.70 20 0.86 0.87 0.88
40 0.81 0.75 0.70 40 0.87 0.88 0.87
20 components were obtained by FA feature
decomposition, and the experimental laboratory data
were identified by stages using RF classification
model. The comparison between the stage results and
the original stage results is as figure 3.
Figure 3: The comparison between the stage results and the original stage results.
4 DISCUSSION
In this paper, the sleep stage was realized according
to the steps of feature extraction, feature selection and
classification recognition of single lead EEG (Pz-
Oz). In the sleep stage recognition experiment, a
relatively ideal experimental result has been
obtained.
ICBB 2022 - International Conference on Biotechnology and Biomedicine
268

In this paper, three levels of feature quantities are
used respectively: 10, 20, 40; Three dimensionality
reduction methods: PCA, FA and AE; Two
classification methods: SVM and RF. By
comparison, it is found that the best classification
results are obtained when using the RF classifier in
combination with PCA (40 features) and FA (20
features). Among them, FA uses fewer features and
occupies less computing space.
The best model in this paper is used to verify and
analyze the EEG data in our laboratory. The
agreement between the results and the original results
reaches 89.26%, among which N1 is 80.00%, N2 is
88.41%, N3 is 91.34% and REM is 97.27%. Among
them, N1 has the greatest difference in staging and
REM has the highest coincidence.
5 CONCLUSION
In this paper, several dimensionality reduction
techniques of EEG data set for automatic detection of
sleep stage are analyzed. Among them, FA uses fewer
features and occupies less computing space.
Dimension reduction technology helps to reshape the
input data, thus reducing the computing power and
improving the performance for some transformations.
The analysis of sleep EEG data in our laboratory
supports that static magnetic field can improve sleep
quality, whether it is sleep time or sleep structure.
REFERENCES
E. Malaekah, C. R. Patti, and D. Cvetkovic, “Automatic
sleep-wake detection using electrooculogram signals,”
in Proc. IEEE Conf. Biomed. Eng. Sci. (IECBES), Dec.
2014, pp. 724–728.
Fan Y. Research on feature extraction of EEG signals using
MSE-PCA and sleep staging. IEEE International
Conference on Tăuţan et al.: Dimensionality reduction
and sleep stage detection 135 Signal Processing,
Communications and Computing, Qingdao, China:
ICSPCC, IEEE, 2018, 2. p. 1–5.
K. A. I. Aboalayon, W. S. Almuhammadi, and M.
Faezipour, “A comparison of different machine
learning algorithms using single channel EEG signal for
classifying human sleep stages,” in Proc. Long Island
Syst., Appl. Technol. (LISAT), 2015, pp. 1–6.
Najdi S, Gharbali AA, Fonseca JM. Feature transformation
based on stacked sparse autoencoders for sleep stage
classification. IFIP Int Fed Inf Process 2017, 499:144–
53.
O. Tsinalis, P. M. Matthews, Y. Guo, and S. Zafeiriou.
(2016). “Automatic sleep stage scoring with single-
channel EEG using convolutional neural networks.”
[Online]. Available: https://arxiv.org/abs/1610.01683.
P. Chriskos, C. A. Frantzidis, P. T. Gkivogkli, P. D.
Bamidis, and C. Kourtidou-Papadeli, “Achieving
accurate automatic sleep staging on manually pre-
processed EEG data through synchronization feature
extraction and graph metrics,” Frontiers Hum.
Neurosci., vol. 12, p. 110, Mar. 2018.
Stanislas Chambon, Mathieu N Galtier, Pierrick J Arnal,
Gilles Wainrib, and Alexandre Gramfort. A deep
learning architecture for temporal sleep stage
classification using multivariate and multimodal time
series. IEEE Transactions on Neural Systems and
Rehabilitation Engineering, 26(4):758–769, 2018.
T. H. Sanders, M. McCurry, and M. A. Clements, “Sleep
stage classification with cross frequency coupling,” in
Proc. 36th Annu. Int. Conf. IEEE Eng. Med. Biol. Soc.,
Aug. 2014, pp. 4579–4582.
Y. Zhang et al., “Automatic sleep staging using multi-
dimensional feature extraction and multi-kernel fuzzy
support vector machine,” J. Healthcare Eng., vol. 5, no.
4, pp. 505–520, 2014.
Detection of Sleep Staging from EEG: A Comparison of Feature Dimensionality Reduction and Classifier Selection
269
