
Big Data Financial Analysis of Vanke's Solvency Based on Power BI
Software
Tieping Wang
Department of Economics and Management, Taishan University Tai’an, China
Keywords: Big Data, Solvency, Power BI.
Abstract: Big data financial analysis is the specific application of big data information technology in financial analysis.
Power BI software can be used for visualization of the company's big data financial analysis. Solvency
analysis allows firm managers, investors, creditors to understand the financial status and financial risk of the
firm. The paper uses Power BI software to conduct big data financial analysis on Vanke’s solvency. The
paper adopts the industry analysis method and trend analysis method, and takes the real estate industry and
the industry's leading Greenfields as the reference objects, and conducts an in-depth analysis of Vanke.
From 2016 to 2020, Vanke's short-term solvency index was lower than the industry average and empirical
value, and the short-term financial risk was relatively large; the long-term solvency gradually improved, but
it was still lower than the overall level of the industry.
1 INTRODUCTION
Big data financial analysis is the application of big
data information technology in financial analysis.
Big data technology enables the availability of data
and enables real-time financial reporting (George,
2014). Big data financial analysis comprehensively
analyzes relevant data information available,
including non-financial information that is not
available in traditional financial analysis. Big data
financial analysis can make a more comprehensive
evaluation of corporate finance than traditional
financial analysis. It is a combination of accounting
and information engineering (Koop, 2006). Through
specialized techniques and methods, it collects,
prepares and analyzes financial and non-financial
data inside and outside the company to better meet
the needs of accounting information users.
Power BI software can be used for visualization
of the company's big data financial analysis
(McAfee, 2012). It can easily realize horizontal
analysis, structural analysis and trend analysis of
enterprise balance sheet and income statement;
provide powerful multi-dimensional analysis of
accounting projects; budget analysis; DuPont
analysis and other functions. Through the mouse,
you can drill down to the sub-ledgers and vouchers
at will, and you do not need to master the
complicated operations of financial software. It
breaks through many defects such as cumbersome,
rigid, and no charts in the setting of fixed report
forms, and helps enterprises transform from
book-keeping financial management to analytical
financial management.
This paper uses Power BI software to conduct
big data financial analysis on Vanke's solvency. It
uses the industry analysis method and the trend
diagram method to analyze the short-term solvency
of Vanke's ability to pay current liabilities and the
long-term solvency of non-current liabilities.
Solvency analysis can not only allow firm operators,
investors, creditors, etc. to understand the firm's
financial status and the level of financial risks that
the firm takes, but also predict the firm's prospects
and provide an important reference for the firm to
carry out various financial activities.
2 SHORT-TERM SOLVENCY
The indicators that reflect the short-term solvency of
the firm are based on the analysis of the relationship
between the firm's current assets and current
liabilities. Short-term solvency is analyzed by the
current ratio, quick ratio and cash ratio. Vanke
belongs to the real estate industry, and the industry
Wang, T.
Big Data Financial Analysis of Vanke’s Solvency Based on Power BI Software.
DOI: 10.5220/0012023600003620
In Proceedings of the 4th Inter national Conference on Economic Management and Model Engineering (ICEMME 2022), pages 61-66
ISBN: 978-989-758-636-1
Copyright
c
2023 by SCITEPRESS – Science and Technology Publications, Lda. Under CC license (CC BY-NC-ND 4.0)
61
leader is Greenland Firm. This article uses
Greenland as the benchmark to conduct industry
analysis by comparing Vanke with the real estate
industry and Greenland Firm, and conduct trend
analysis by comparing the firm's data from 2016 to
2020.
Table 1: Short-term solvency indicators.
Short-term solvency
2020 Average 2016-2020
Vanke Real estate Greenland Vanke Real estate Greenland
Current ratio 1.17 1.39 1.19 1.18 1.47 1.28
Quick ratio 0.41 0.48 0.49 0.45 0.50 0.43
Cash ratio 0.14 0.18 0.1 0.16 0.21 0.12
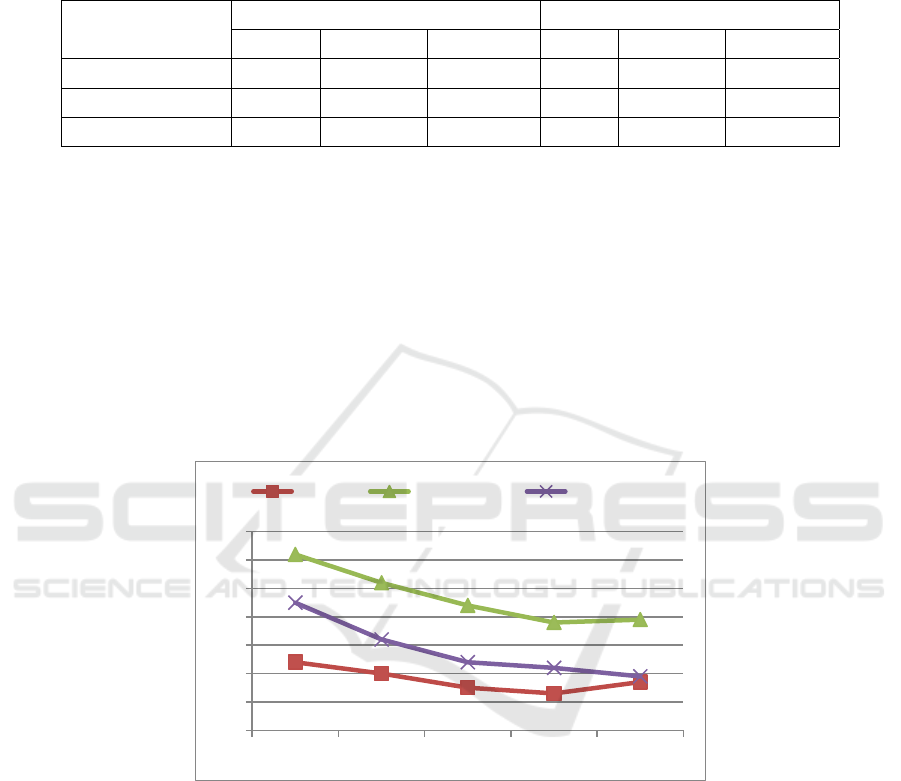
2.1 Current Ratio
Current ratio equals current assets divided by current
liabilities. It is generally believed that this indicator
should reach 2 or more (Koop, 2006). As shown in
Figure 1, the current ratios of Vanke, Real Estate
and Greenland are all lower than 2, indicating that
the overall short-term solvency of the real estate
industry is weak. Vanke's current ratio changed little
from 2016 to 2020. The firm's current ratio was 1.24
in 2016 and 1.13 in 2018. Vanke's current ratio
fluctuated between 1.13 and 1.24 over the years.
From 2019 to 2020, the current ratio was fine-tuned
from 1.13 to 1.17. The average current ratio of
Vanke over the years is less than the average current
ratio of the industry and benchmark Greenland
companies over the years. The industry to which
Vanke belongs is the real estate industry. The
change in the current ratio of the real estate industry
was relatively small from 2016 to 2020.The average
current ratio of the real estate industry over the years
is 1.28.
Figure 1: Current ratio from 2016 to 2019.
2.2 Quick Ratio
Quick ratio evaluates the short-term solvency of a
firm, eliminates the influence of inventory and other
current asset items with poor liquidity (Schroeder,
2019). The indicator should reach 1. If the quick
ratio is less than 1, it indicates that the solvency is
poor, but the analysis should be combined with other
factors to evaluate. As can be seen from Figure 2,
the quick ratios of the real estate industry, Vanke
and Greenland are all lower than 1, indicating that
the overall short-term solvency of the real estate
industry is weak and the financial risk is relatively
high. From 2017 to 2020, Vanke showed a
downward trend of change. The firm's quick ratio
value fluctuated between 0.41 and 0.49, and the
firm's average quick ratio over the years was 0.45.
In the real estate industry of Vanke, the quick ratio
of the real estate industry dropped from 0.53 to 0.46
from 2016 to 2019, and rose slightly to 0.48 in 2020,
with little change over the years. The five-year
average of the real estate quick ratio is 0.50.
1,24
1,2
1,15
1,13
1,17
1,62
1,52
1,44
1,38
1,39
1,45
1,32
1,24
1,22
1,19
1
1,1
1,2
1,3
1,4
1,5
1,6
1,7
2016 2017 2018 2019 2020
Vanke Real estate Greenland
ICEMME 2022 - The International Conference on Economic Management and Model Engineering
62
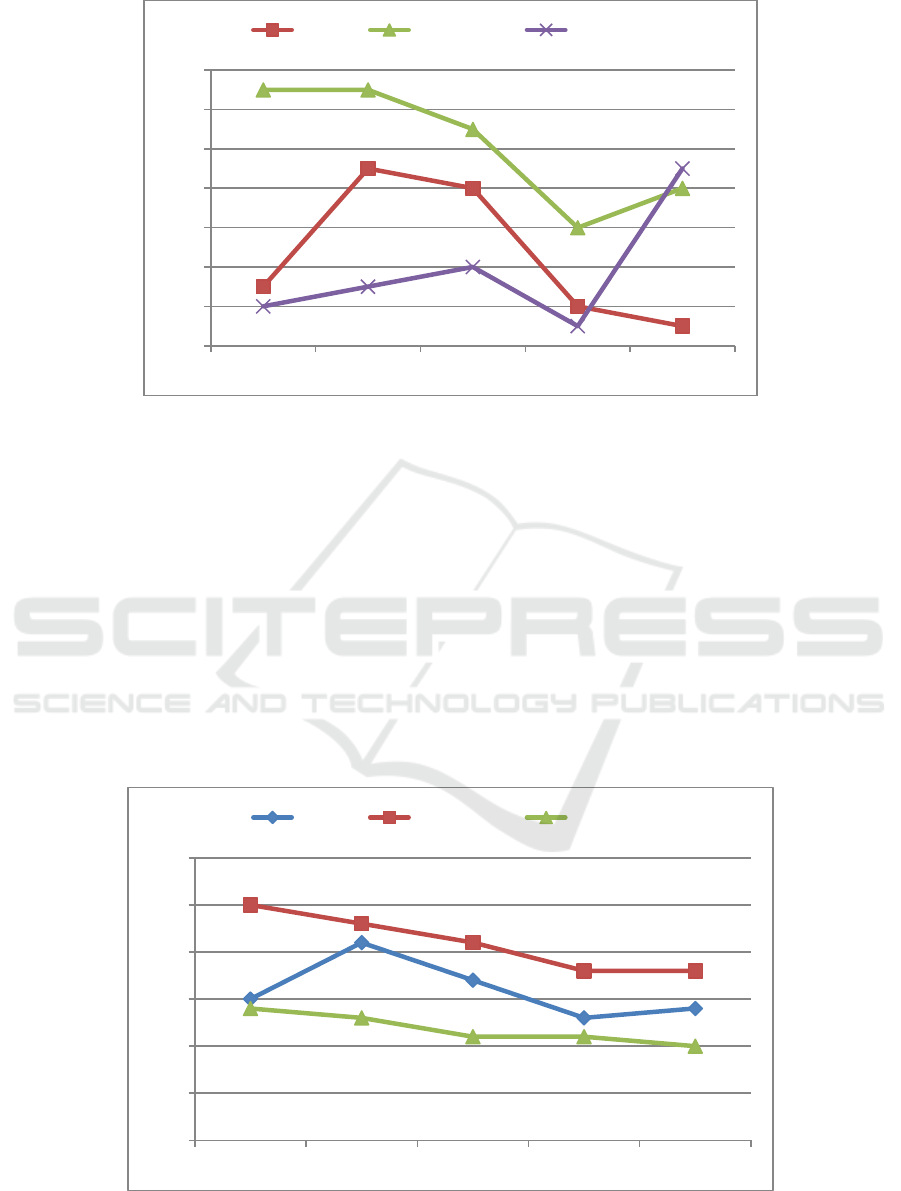
Figure 2: The change trend of quick ratio.
2.3 Cash Ratio
When the firm is faced with the need for a large
amount of cash on the day of paying wages or the
day of bulk purchase, the cash ratio can show its
important role, because the cash ratio does not take
into account the inventory and demand in the current
assets of the firm. Therefore, this indicator is
particularly important for companies that have
problems with receivables and inventory realization.
Due to the low profitability of the firm's cash assets,
it is impossible and unnecessary for the firm to keep
too many cash assets. High, indicating that the
liquidity raised by the firm through debt has not
been fully utilized, so the firm is not encouraged to
retain more cash assets. This ratio should be around
20%. As shown in Figure 3, the change in Vanke's
cash ratio from 2016 to 2020 showed a slight
increase at first, then a decrease, and a slight upward
trend. The cash ratios have fluctuated between 0.13
and 0.21 over the years. The average annual cash
ratio of Vanke was 0.16. In the real estate industry
to which Vanke belongs, the cash ratio of the real
estate industry has shown a downward trend over
the years, ranging from 0.25 to 0.18. The industry
average cash ratio over the years is 0.21.
Figure 3: The change trend of cash ratio.
0,43
0,49
0,48
0,42
0,41
0,53 0,53
0,51
0,46
0,48
0,42
0,43
0,44
0,41
0,49
0,4
0,42
0,44
0,46
0,48
0,5
0,52
0,54
2016 2017 2018 2019 2020
Vanke Real estate Greenland
0,15
0,21
0,17
0,13
0,14
0,25
0,23
0,21
0,18 0,18
0,14
0,13
0,11 0,11
0,1
0
0,05
0,1
0,15
0,2
0,25
0,3
2016 2017 2018 2019 2020
Vanke Real estate Greenland
Big Data Financial Analysis of Vanke’s Solvency Based on Power BI Software
63

Vanke's short-term solvency indicators all
showed a downward trend from 2017 to 2020, and
the three trends changed in the same direction, and
they were all lower than industry values and
experience values. Vanke's short-term solvency is
weak.
3 LONG-TERM SOLVENCY
The long-term solvency is analyzed in terms of
asset-liability ratio, equity ratio, shareholders' equity
ratio.
3.1 Asset-Liability Ratio
Asset liability ratio is an indicator reflecting the debt
burden of an firm. The appropriate level of asset
liability ratio is 40% - 60%. As shown in Figure 4,
Vanke's asset liability ratio changed significantly
from 2016 to 2020. Vanke's asset liability ratio
ranges from 81% to 85%, with a five-year average
of 83%. Vanke's asset liability ratio in 2020 is lower
than that in 2018, indicating that the debt burden in
2020 is slightly lower than that in 2018. According
to the empirical value, Vanke's total asset liability
ratio is too large, and the risk of long-term solvency
is large. The average ratio of Vanke over the years is
83%, and the average asset liability ratio of real
estate industry and benchmark Greenland over the
years are 79% and 89% respectively. The long-term
financial risk of Vanke is less than Greenland firm
and higher than the industry average.
Table 2: Long-term solvency indicators.
Long-term solvency
2020 Average 2016-2020
Vanke Real estate Greenland Vanke Real estate Greenland
Asset-liability ratio 0.81 0.79 0.89 0.83 0.79 0.89
Equity ratio 4.34 3.74 7.99 4.92 3.68 8.16
Shareholders' equity ratio 0.19 0.21 0.11 0.17 0.21 0.11
Figure 4: The change trend of asset liability ratio.
3.2 Equity Ratio
Vanke's equity ratio changed significantly from
2016 to 2020. Vanke's equity ratio varies between
4.13 and 5.48. Vanke's ownership ratio over the
years is 4.92. The equity ratio of the real estate
industry changes gently, and the equity ratio
changes from 3.29 to 3.95 over the years. Vanke's
average equity ratio is higher than the industry
average. Vanke and the industry's ownership ratio
over the years are lower than that of Greenland firm.
3.3 Shareholder Equity Ratio
The shareholders equity ratio is an indicator
reflecting the guarantee degree of solvency, which
indicates how many of the total assets of the firm are
formed by the investment of investors. Vanke's
shareholder equity ratio changed significantly over
the years from 2016 to 2020.
81,00%
84,00%
85,00%
84,00%
81,00%
76,00%
78,00%
79,00% 79,00%79,00%
89,00% 89,00% 89,00%
88,00%
89,00%
75,00%
80,00%
85,00%
90,00%
2016 2017 2018 2019 2020
Vanke Real estate Greenland
ICEMME 2022 - The International Conference on Economic Management and Model Engineering
64
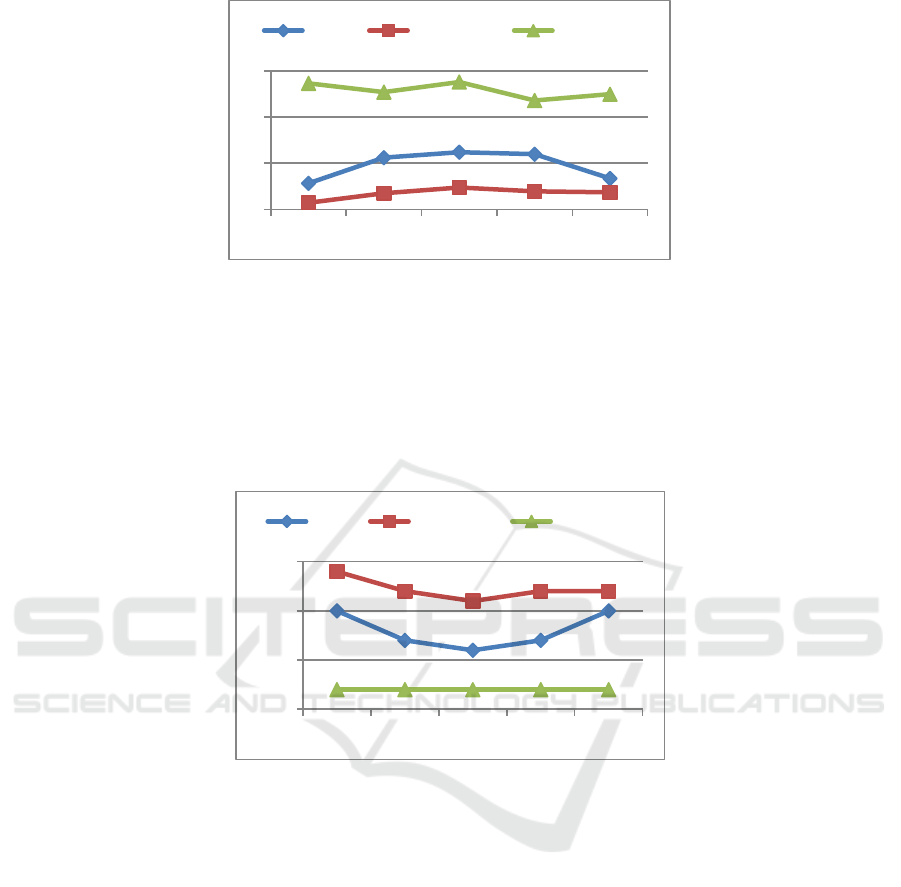
Figure 5: The change trend of equity ratio.
The shareholder equity ratio varied between 0.15
and 0.19, and the average shareholder equity ratio of
Vanke industry over the years was 0.1. The smaller
the equity ratio index of Vanke shareholders, the
smaller the proportion of equity capital, and the
greater the risk of debt repayment. The shareholder
equity ratio of Vanke's real estate industry fluctuated
slightly from 2016 to 2020, ranging from 0.2 to 0.23.
The average shareholder equity ratio of the real
estate industry over the years is 0.21. Vanke's
shareholders' equity ratio over the years is slightly
lower than that of the industry, but higher than the
average equity ratio of Greenland firm over the
years of 0.11.
Figure 6: The change trend of shareholders' equity ratio.
The asset liability ratio is an indicator reflecting
the debt burden of the firm, and the shareholder
equity ratio is an indicator reflecting the degree of
debt repayment guarantee. Equity ratio has the same
economic significance as asset liability ratio and
shareholder equity ratio, but among the three, the
equity interest rate index more intuitively shows the
degree of protection of liabilities from shareholder
equity. Generally speaking, the equity ratio shows
the degree of firm loan operation. Vanke's asset
liability ratio, shareholder's equity ratio and equity
ratio changed little from 2016 to 2020. From 2018 to
2020, Vanke's asset liability ratio and equity ratio
showed a downward trend, and the shareholder's
equity ratio showed an upward trend. The asset
liability ratio and equity ratio show the same change
trend, and the shareholder's equity ratio and asset
liability ratio show the opposite change trend. From
2016 to 2020, Vanke's asset liability ratio has always
been higher than that of the real estate industry. The
greater the asset liability ratio, the higher the degree
of debt; Vanke's equity ratio has always been higher
than that of the real estate industry, and Vanke's
liabilities receive less protection from shareholders'
equity; Vanke's shareholders' equity ratio has always
been lower than that of the real estate industry,
indicating that Vanke's guarantee of debt repayment
is not great. From 2016 to 2020, Vanke's asset
liability ratio has been lower than that of Greenland,
and Vanke's debt degree is lower than that of
Greenland; Vanke's equity ratio has always been
lower than that of Greenland, and Vanke's liabilities
have received greater protection from shareholders'
equity; Vanke's shareholder equity ratio has always
been higher than Greenland, indicating that Vanke's
guarantee of debt repayment is relatively large.
4,13
5,24
5,48
5,39
4,34
3,29
3,7
3,95
3,78
3,74
8,46
8,08
8,52
7,72
7,99
3
5
7
9
2016 2017 2018 2019 2020
Vanke Real estate Greenland
0,19
0,16
0,15
0,16
0,19
0,23
0,21
0,2
0,21 0,21
0,11 0,11 0,11 0,11 0,11
0,09
0,14
0,19
0,24
2016 2017 2018 2019 2020
Vanke Real estate Greenland
Big Data Financial Analysis of Vanke’s Solvency Based on Power BI Software
65

4 CONCLUSIONS
This paper makes a big data financial analysis of
Vanke's solvency through Power BI software. The
conclusion is as follows. Using the industry analysis
method and trend analysis method, taking the real
estate industry and industry leading green space as
the reference object, this paper makes an in-depth
analysis of Vanke from the two aspects of short-term
solvency and long-term solvency. From 2016 to
2020, Vanke's short-term solvency index is lower
than the industry average and empirical value, and
the short-term financial risk is large. The long-term
solvency has gradually improved, but it is still lower
than the overall level of the industry. Compared with
the industry leader Greenland, Vanke has stronger
short-term and long-term solvency, higher debt
degree and greater financial risk.
ACKNOWLEDGEMENT
The thesis is the result of the Taishan University
Introduced Talents Scientific Research Start-up
Fund Project.
REFERENCES
George, G., M.R. Haas and A. Pentland, Big data and
management. 2014, Academy of Management
Briarcliff Manor, NY. p. 321-326.
Koop, G., Analysis of financial data. 2006: John Wiley &
Sons Oxford.
Koop, G., Analysis of financial data. 2006: John Wiley &
Sons Oxford.
McAfee, A., et al., Big data: the management revolution.
Harvard business review, 2012. 90(10): p. 60-68.
Schroeder, R.G., M.W. Clark and J.M. Cathey, Financial
accounting theory and analysis: text and cases. 2019:
John Wiley & Sons.
ICEMME 2022 - The International Conference on Economic Management and Model Engineering
66
