
Morphological Evolution of the Scour Pit After Danjiangkou Dam
Heightening Project
Ying Chen,Xian-zheng Wang, Hong-xia Zhang and Zhi-gang He
Hanjiang Bureau of Hydrology and Water Resources Survey, Changjiang Water Resources Commission, China
Keywords: Danjiangkou Dam Heightening Project, Scour Pit, Mophological Evolution, Empirical Orthogonal Function,
Autumn Flood in Hanjiang in 2021.
Abstract: Danjiangkou Reservoir is the largest artificial fresh water lake in Asia, the water source of the middle route
of the South-to-North Water Diversion Project. This paper analyzes the process and the reasons of the scour
pit under Danjiangkou Dam,then particularly analyzes its morphological evolution after the Autumn flood
in Hanjiang in 2021. After the flood in 2021, there are big increases in the range and depth of the scour pit.
The results shows that the area of 75m contours of the spit increased from about 1.2×10
4
m
2
to 1.4×10
4
m
2
.
Correspondingly, sediment volume of the scour pit drastically decreased, especially the volume between the
75m and 60m contours. Furthermore, the Empirical Orthogonal Function (EOF) is applied to analyze the
morphological evolution of the scour pit under the Danjiangkou dam. The topographic data are separated
into independent spatial eigenfuntion along with temporal eigenfuntion by the EOF analysis. The first three
modes provide a detailed, comprehensive description of the morphological evolution of the scour pit. The
first mode accounts for 58.5% of the overall evolution patterns, it shows the trend of the scouring
downstream of the scour spit. The second mode reflects that the scour pit achieved a dynamic balance of
sediment. And the third mode indicates that the sediment source of the center of the scour pit. This paper
explains that the EOF analysis can be used into the evolution of river-bed, and provides the theory basis for
the safety operation of the Danjiangkou dam.
1 INTRODUCTION
Riverbed erosion and accretion are a major part of
the evolution in which many researchers are very
interested. Researchers have never stopped studying
on it (Nitsche et al., 2006 and Hu et al., 2009).
Research results can be used to analyze the variation
trend, so that appropriate measures can be taken to
protect hydraulic structure or riverbed and avoid
harm. Due to the impact of the flood release from the
dam, scouring below the sluice continues, and it is
subjected to severe erosion damage(Li et al, 2003).
There are many factors leading to scour pits under
dams. A submerged hydraulic jump downstream of
an apron tend to cause the evolution of local
scour(Akiyama et al., 2010), resulting in the shape of
the scour pits similar. The geometrical similarity of
scour pits downstream of a sluice gate is related to
geological factors(Hamidifar et al., 2017).
The establishment of water conservancy
projects in river channels changes the characteristics
of the flow field, and the energy of the discharge
under the spillway is much larger than the normal
specific energy of the flow in the downstream river,
so the scouring damage to the downstream river bed
is more obvious.( Shang., 2012))
The downstream river bed erosion is an
engineering issue of wide concern in the hydraulic
engineering industry. Physical and Numerical models
have been widely employed to explore the
characteristics of river bed erosion downstream of the
dam. Zhang and Liu (2020) developed a physical
model, finding that the special station, such as
downstream apron and the right bank will be scoured
under the condition of the special flow. The research
shows the shape optimum design of overflow weir is
a factor affecting the location of scour.
Hao and Li(2019) build the overall hydraulic
model test of Chaiping Hydropower station, draw a
conclusion of the size of the hydropower station is
optimized to weaken the downstream riverbed scour
and reduce the influence on the overall stability of
the dam, so that the hydropower station can meet the
operation requirements of the project.
A 2D water-sediment mathematical mode is
established by Zou and Tang(2018), for calcutating
308
Chen, Y., Wang, X., Zhang, H. and He, Z.
Morphological Evolution of the Scour Pit After Danjiangkou Dam Heightening Project.
DOI: 10.5220/0012024900003536
In Proceedings of the 3rd International Symposium on Water, Ecology and Environment (ISWEE 2022), pages 308-318
ISBN: 978-989-758-639-2; ISSN: 2975-9439
Copyright
c
2023 by SCITEPRESS – Science and Technology Publications, Lda. Under CC license (CC BY-NC-ND 4.0)

the possible downstream scour of the dam for the
project to be caused after the complete of Bazizui
Project.Meanwhile, in order to accurately predict the
range and depth of scour pits in downstream riverbed,
a numerical model of local riverbed scour was
established based on the dynamic grid technology in
Fluent software by Fan(2021).
Based on the theoretical analysis and model
simulation results of riverbed scour under dam by
many scholars, it can be seen that the main
influencing factors of local scour under dam are
hydraulic factors such as the shape of overflow weir
and the size of downstream discharge. Taking
Danjiangkou Dam as an example, this paper
discusses the characteristics and evolution trend of
scour under danjiangkou dam after its heightening,
which provides technical support for dam operation.
Danjiangkou reservoir covers an area of 95,200
km
2
, accounting for 60% of the total area of the
Hanjiang River basin. Danjiangkou reservoir is the
largest artificial fresh water lake in Asia, the water
source of the middle route of the South-to-North
Water Diversion Project, the national first-class water
source protection zone, the important wetland
protection zone in China, and the national ecological
civilization demonstration zone. Danjiangkou dam
has attracted extensive attention both from both
inside and outside of the industry since it was set up.
Many scholars have also conducted a large number
of studies on the formation and evolution mechanism
of riverbed under the Danjiangkou Dam, and
analyzed the morphological evolution of scour
pits(Duan et al., 2007 and Zhang et al., 2008).
For Danjiangkou dam with the characteristics of
high water head, large discharge, the problems of
erosion damage are exceedingly serious. Virtually,
downstream riverbed has formed many scour pits
since the reservoir operation in the initial period of
the project. According to statistics, the duration of
flood charge in the deep hole 9-11 dam section is the
longest, the downstream bed received the certain
degree of flushing, and formed a prominent pit, now
the scour shows a trend of move to the upstream and
the East direction (Wang et al., 2007).
This paper mainly carried on the concrete
analysis to the scour pit under 9-11 dam section, and
analyzes the process and the reasons of the scour pit
under Danjiangkou Dam, then particularly analyzes
its morphological evolution after the Autumn flood in
Hanjiang in 2021. Therefore, the objectives in this
contribution are as follow: (1) to quantitatively
explore the morphological changes of scour spit in
area, sediment volume variations in different phase;
(2) to interpret the underlying factors associated with
morphological evolution and analysis the trend of the
scour pit.
2 STUDY AREA
2.1 General View of Danjiangkou Dam
Danjiangkou Reservoir is located in Xichuan County
of Henan Province and Danjiangkou City of Hubei
Province. Danjiangkou Reservoir is a large-scale
artificial reservoir with functions of water supply,
flood control and power generation as well as
irrigation and breeding. It is a multi-year regulating
reservoir. The initial project of Danjiangkou Dam
was started in September 1958 and completed in
1973. In the past 30 years, it has played a great role
and achieved remarkable economic and social
benefits. Then the Danjiangkou Dam heighting
project started in September 2005 and completed in
2013. In present, Danjiangkou reservoir dam has a
total area of 1050km
2
with a storage capacity of
29.05 billion m
3
when the normal water level is up
to 170m.
Danjiangkou dam is a wide-slit gravity dam,
which consists of dam sections 1-44 according to the
distribution characteristics of buildings a. According
to the frequency of operation, the spillway structure
is divided into two parts, normal spillway and
extraordinary spillway, which are arranged in the
dam section 8- 24. Among them, the dam sections 8-
13 is the deep hole dam section with a total length of
144m, which are composed of 11 deep spillway
holes. Dam sections 14-17 and 19-24 are overflow
dam sections with a total of 20 open overflow holes
of 8.5m in width. There are 8 holes in dam sections
14-17 as overflow holes, 12 holes in dam sections
19-24 as infrequently used overflow holes. Dam
section 18 is a longitudinal cofferdam with no-
overflow section (Wang et al., 2002).
2.2 Morphology of the Scour Pit Under
Danjiangkou Dam
According to the structural arrangement of the
spillway sections, it can be seen that the downstream
riverbed located at No. 8-13 dam sections and No. 9-
17 dam sections are vulnerable to be flushing. In
addition, combined with the statistics of the date of
the opening and closing of the gates (Table 1), the
duration of the flood discharge takes the longest in
the 9-11 dam section and the 15-16 dam section, so
the scouring situation of the downstream river bed in
this section needs to be focused on. With time the
Morphological Evolution of the Scour Pit After Danjiangkou Dam Heightening Project
309

riverbed has shown the water carved out a large
scour pit downstream of the 10-17 dam section. The
location and form of the scour pit are shown in
Figure 1.
Combined with the morphology of scour pits and the
exploration of riverbed geology under the dam (Cai
et al., 2002), it can be seen that the scour pit is
washed along three geological fault zones in the
plane at the same time. In this paper, three profile
lines are selected for qualitative analysis of scouring
and silting in the fault zone. The following sections
will elaborate on these ideas. The profile lines are
arranged based on the erosion zone and the positions
of the three erosion zones are shown in Figure 1.
Figure1: The location and form of the scour pit of the Danjiangkou Dam.
3 FORMMATERIAL AND
METHODS
3.1 Material
Topographic survey has been widely used to explore
river bed evolution. Based on digital contour DEM,
the sedimentary erosion characteristics of the scour
pit were studied. Topographic data are collected from
topographic maps from 2005 to 2021. All scales are
1:500, and Danjiangkou dam axis coordinate system
is adopted in the maps. Then kriging interpolation
technique is used to interpolate the digital data into a
grid with a spatial resolution of 2.5m × 2.5m to
reduce the interpolation error. In order to investigate
the morphological evolution of scour pits, the data of
discharge flow, water level difference between the
upper and lower reaches and opening position of dam
sections are collected and analyzed. The hydrological
data are all from the Hanjiang Bureau of Hydrology
and Water Resources Survey.
Table2 shows the statistics of flood discharge
from 2005 to 2021. Wusong height datum of China is
determined in the paper.
3.2 Methods
In order to analyze the spatial and temporal
correlations of elevation and explore possible
evolution patterns in different periods, the
multivariate analysis technique Empirical
Orthogonal/Eigen Function (EOF) is used in this
study. Empirical Orthogonal Function analysis
(EOF) method. EOF analysis was first introduced
into meteorological problem analysis (Yosef et al.,
2017). However, in recent years, many scholars have
applied this method to study topographic evolution
(Yuhi et al., 2017, Xia et al., 2005 and Horrillo-
Caraballo et al., 2009). Most of these scholars
analyze the evolution of typical sections by
processing topographic profile data, and some
scholars have applied this method to the evolution
analysis of the whole topographic region (Beckers et
al., 2003 and Dai et al., 2015). Through the research
of many scholars at home and abroad, it is known
that empirical orthogonal function analysis
methodcan be used to explain the causes of river bed
evolution. When EOF is used for terrain analysis,
feature vectors correspond to spatial samples, and
principal components correspond to time
ISWEE 2022 - International Symposium on Water, Ecology and Environment
310

coefficients, so it can be called EOF method for
time-space separation. Its principle is to decompose
the variable field that changes with time into several
mutually independent orthogonal modes through
spatio-temporal decomposition, and each mode has a
corresponding space function and time function. The
first several modes, which account for a large
proportion of the total variance of all variables at the
original space point, can be used to summarize the
most important information of the factor field.
Therefore, we can replace the study by studying the
rules of the change of these major components with
time and better explain the time changes of the field.
The advantage is that it can decompose the
irregularly distributed sites in a definite limited area,
and the result obtained by decomposition has more
complete physical significance, and can better reflect
the basic structure of the appearance.
In this paper, topographic data under
Danjiangkou Dam in recent years are given in the
form of elevation matrix A after anomaly
processing: A=X
m
×
n
. Where m represents spatial
data point and n represents time series length. Then,
the EOF analysis method is applied to decompose
the matrix
X
m
×
n
into orthogonal spatial characteristic
function V and time characteristic function Z.
X=VZ
(1
)
V is the spatial characteristic function,
reflecting the spatial variation of the scour pit area;
Z means time characteristic function, reflecting the
change of scour pit elevation over time.
The specific decomposition method is as
follows:
(1) Calculate the product of X and XT to obtain
a matrix R composed of correlation coefficients
R=X×X
(2
)
(2) Calculate the eigenvalues of the correlation
coefficient matrix R ( λ
1
, λ
2
... λ
m
) and the
eigenvector Vmxm, both of which should satisfy.
R=V
⋀
V
(3
)
∧ represents a diagonal matrix composed of
the eigenvalues of R.
=Λ
m
λ
λ
λ
00
0
00
00
2
1
(4)
Arrange the eigenvalues in non-ascending
order. Each eigenvalue has a list of eigenvectors
corresponding to it, also known as EOF. The
eigenvector corresponding to the k eigenvalue λk is
the k column of the eigenvector matrix V.
)(:,KVEOF
k
=
(5)
V is projected onto the matrix X composed of
terrain data, so as to obtain the corresponding time
coefficients of all spatial feature vectors
XVZ
T
×=
(6)
(4) Calculate the contribution rates of each
mode. The formula for calculating the corresponding
contribution rate Rk of the k is as follows:
[]
1
1, 2,..., ( )
k
k
m
i
i
R
kppm
λ
λ
=
== ≤
(7)
(5) The cumulative contribution rate of each mode can
be obtained according to the formula below
)P
1
1
mG
m
i
i
p
i
i
<=
=
=
(
λ
λ
(8)
Through the numerical calculation software
MATLAB according to the EOF analysis of the
calculation principle of programming, calculate the
time characteristic function and space characteristic
function of each mode, as well as the corresponding
eigenvalue. Therefore, elevation change of scour pits
under Danjiangkou dam can be transformed into a
series of characteristic values to reflect the pattern of
its morphological changes.
Table 1: The duration of the flood discharge of the dam section in 2017-2021.
Time
(h)
Dam Sections
8 9 10 11 12 14R 14L 15R 15L 16R 16L 17R 17L
2017 89.5 140.0 547.5 558.1 454.0 257.1 352.0 413
2018 52.2 139.5 434.9 242
2019 90.2 110.8 115.3 15.7 50.9 59.4 22.9 27.8
Morphological Evolution of the Scour Pit After Danjiangkou Dam Heightening Project
311

2020 23.0 109.2 167.8 3.0 24.5 171.0 142.7
2021 596.8 866.1 1185.5 1043.8 577.9 115.1 913.3 593.4 46.6 375
Sum 851.8 1226 2016.1 1620.6 628.8 166.0 456.0 1110.2 796.9 736.1 655 74.4 375
Table 2: The flood discharge data of the Danjiangkou Dam in 2005-2021.
Year
Maximum
reservoir
water
level
(
m
)
Maximum water
level under the
dam(m)
Water
Head
Difference(m)
Maximum
discharge(m
3
/s)
The number of
discharge sluice
hole(deep/overflow)
Days of
flood
discharge
2005 156.95 95.99 60.96 14300 9 5 32
2007 151.15 92.66 58.49 6870 6 1 27
2009 153.04 91.35 61.69 2450 1 16
2010 154.95 93.71 61.24 7280 7 2 55
2011 157.29 95.78 61.51 12800 9 4 29
2012 155.44 90.91 64.53 2460 2 6
2017 167.00 94.70 72.30 8040 4 4 34
2018 165.43 91.77 73.66 3380 4 23
2019 166.51 94.32 72.19 7260 5 3 10
2020 164.7 91.89 72.81 3680 1 2 19
2021 170.00 95.03 74.97 11100 5 4 75
4 EVOLUTION
CHARACTERISTICS OF
SCOUR PITS UNDER
DANJIANGKOU DAM
Based on topographic data of the Danjiangkou dam
from 2005 to 2021, DEM model was established to
analyze the evolution characteristics of scour pits
under the Danjiangkou dam in recent years.
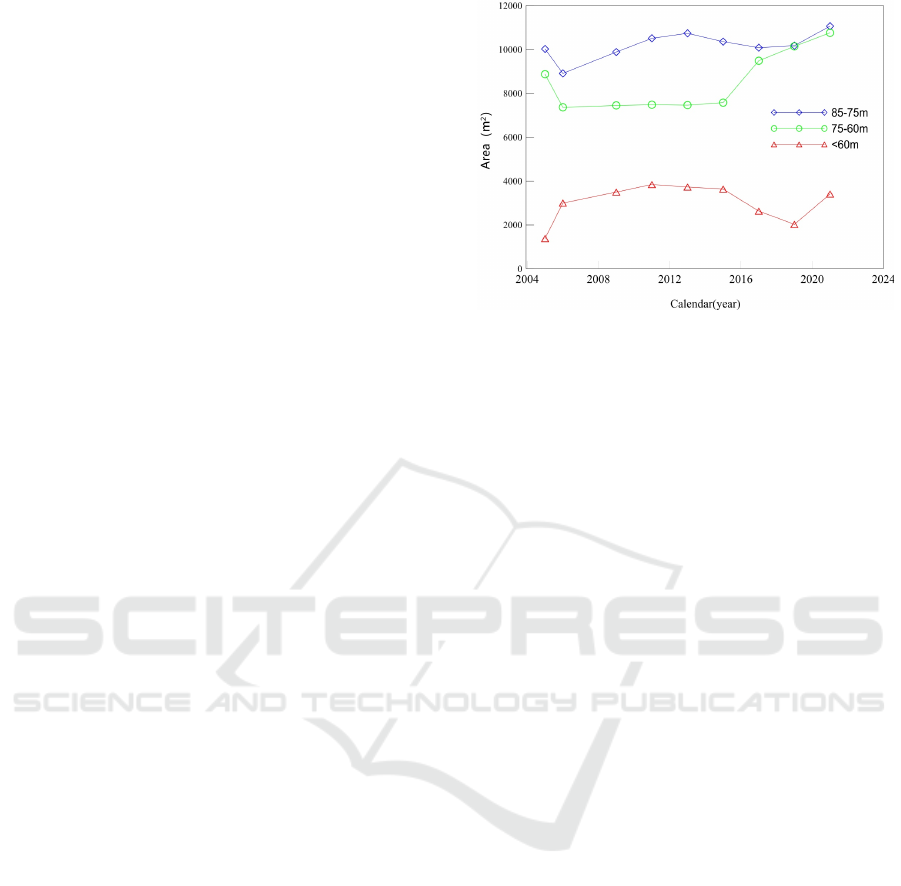
4.1 Horizontal Changes
According to the profile of scour pits, scour pits are
basically extending downstream along the three
scour zones. In order to qualitatively analyze the
scour and silt shape of scour pits, scour pits are
divided into three levels according to contours of
60m, 75m and 85m for analysis.
Changes in the area of the scour pit in the 60m,
75-60m and 85-75m contours can be seen in figure
2. The 60m contours area can be used to describe the
variation of scour and silting at the bottom of the pit,
75-60m can reflect the evolution at the slope of the
pit, and 85-75m was set as the sediment scour and
deposition at the boundary of the pit. Considering
the implement of the Danjiangkou dam heightening
project in 2013 and intensive autumn flood in 2021,
the temporal variations of the morphology can be
generally divided into three phases: before the
heightening project (phaseⅠ: 2005~2013), after the
heightening project (phase Ⅱ : 2013~2019) and
through the autumn flood in Hanjiang in 2021
(phaseⅢ: 2019~2021). Elevation changes according
to the sediment erosion and accretion in each period
in figure 3, which the 75m contour line in 2005 can
better showcase the specific variation position of the
scour pit (bottom or slope).
During the phase Ⅰ :In 2005-2006, the
maximum discharge flow reached 15,100m
3
/s. The
area at the pit bottom increased significantly with
the scour area at 60m contour of 1619m
2
.
Meanwhile, the area of 75m contour almost
remained unchanged, with the area of the 85m
contour line decreased slightly. It shows that the
scour in this period mainly downward scours. In
2006-2013, there was a small change in the area
surrounded by contour lines below 60m and 75-60m,
while the area of 85-75m contour increased
significantly with an area increment of 1828m
2
,
ISWEE 2022 - International Symposium on Water, Ecology and Environment
312
indicating that scour pits were mainly developed and
expanded to the periphery during this period.
During the phaseⅡ: in 2013-2015, changes in
the area of scour pit were not evident. During this
period, discharge was decreasing, and scour pit
basically did not develop further. After the
Danjiangkou Dam heightening project, experienced
the autumn flood in Hanjiang in 2017, the area of
85-75m and below 60m contours decreased, while
the range between 75-60m showed an increasing
trend, indicating that the anti-scour layer had
gradually formed at the pit bottom during this
period, and there was no further scouring. The scour
sand at the pit tail fell back to the pit bottom, leading
to accretion of the pit bottom. As a result, the range
of 60m contour is reduced, and the scour tends to
extend downstream and to the east and west sides,
and the larger the downstream discharge, the larger
the range of expansion.
During the phase Ⅲ: in 2019-2021, Hanjiang
River experienced the autumn flood in 2021. The
discharge flow was as high as 11100m
3
/s with the
water head difference was 74.97m, the highest in
recent years. The water level in front of the dam was
170m, reached normal water level for the first time.
This means the jet trajectory length increased. The
effect goes further downstream. Therefore,
remarkable scour zone can be seen in the tail of the
scour pit(tail means downstream part of the scour
pit).
In order to study the elevation and position
changes of the lowest point of the scour pit, the 60m
contour line and the position and elevation of the
lowest point in 2005, 2011, 2017, 2019 and 2021
were superimposed and plotted in figure 5. As can
be seen from the figure, the 60m contour line is
separated into left and right parts after 2019, while
the middle part is silted, indicating that the scour pit
develops along the scour zone. The main scour site
is located near the right river bed of the scour pit,
and the minimum elevation of the scour pit is also
distributed along the scour zone and presents a
downward trend year by year. After the
implementation of the Danjiangkou dam heightening
project, the minimum elevation of the scour pit does
not move down further, but the elevation is still
reduced by 3.6m in 2021, which is mainly related to
the magnitude of the discharge flow.
Figure 2: Changes in the area of the scour pit in the 60m,
75-60m and 85-75m contours.
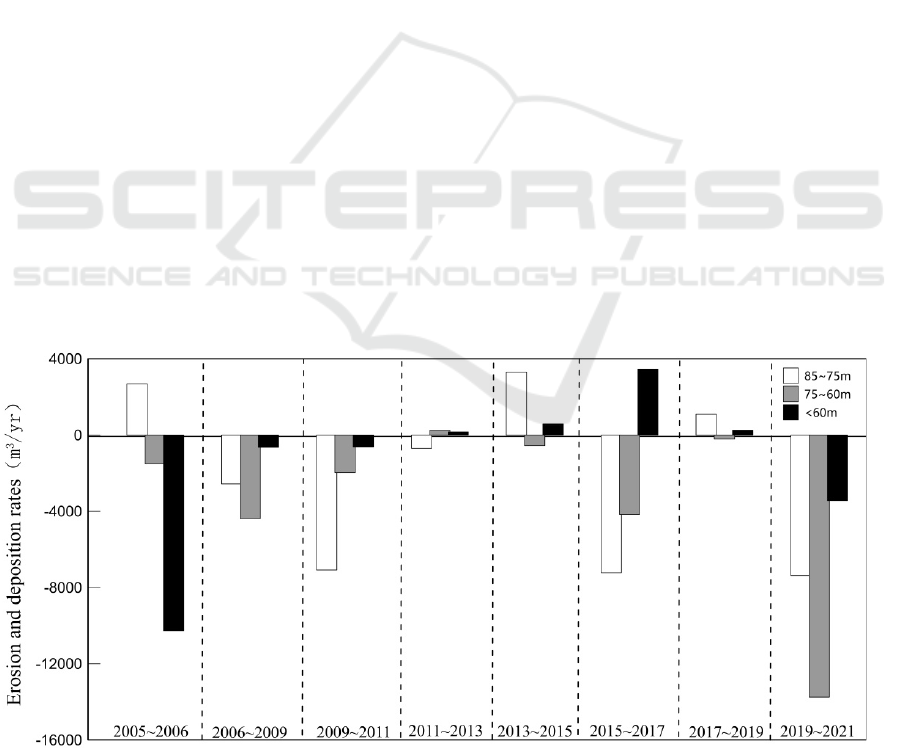
4.2 Longitudinal Changes
Sediment volume of the scour pit was calculated to
explore the erosion or deposition regime during the
2005-2021. The change of sediment volume, as well
as the area, was explored by dividing into three
levels (Figure. 4).
Changes in sediment volume displayed that the
region below the 85m contour received a net erosion
with the amount of 5.18×10
4
m
3
over the phaseⅠ
(2005-2013), with an average erosion rate of 6.48×
10
3
m
3
/yr. Furthermore, the amount of sediment
erosion during the 2006~2009 in the zone was the
most dominant over the phase I, which amount was
2.28×10
4
m
3
, accounting for 44.0% of the period. In
vertical, the erosion mainly occurred in the area
below 60m with the rate was 1.03 × 10
4
m
3
/a in
2005-2006. During this period, the maximum flood
discharge was 15100m
3
/s, which impact played a
dominant role on the scour spit evolution below the
60m contour. The rate of erosion below the 60m
contour in 2005-2006 was obviously higher than the
other periods of the phase I. However, the flood
discharge in 2009-2011 was as high as 13000m
3
/s,
but the elevation of the bottom of the scour pit did
not decrease further. In summary, the period from
2005 to 2011 was the main development period of
scour pit. The initial stage expresses the continuous
downward flushing of the scour pit which the
erosion occurs mainly below the 60m contour. Then
the second stage shows that the anti-scour layer
gradually appears at the bottom of the pit, which
leads to the downward flushing rate of the bottom of
the pit slowing down, and the effect of the discharge
on the surrounding slope becomes relatively
obvious. The sediment volume in 2011-2013 was
Morphological Evolution of the Scour Pit After Danjiangkou Dam Heightening Project
313
relatively in equilibrium and even slight sediment
accumulation was found in the period.
After the execution of heighting project, as a
result of the decrease of the discharge, the scour pits
turned into silting with the amount of 0.67×10
4
m
3
in 2013-2015. Subsequently, with autumn flood in
2017, Danjiangkou dam applied 167m high water
level for the first time after heighten the dam with
the discharge was 7750m
3
/s, the difference between
the upper and lower water levels of the dam reached
72.93m. The increase of water flow resulted in the
scouring trend of the scour pit, but the area from
60m to the bottom of the pit still showed a trend of
silting, which was mainly caused by the sediment at
the slope of the pit falling back to the bottom. In
2017-2019, the fluctuation of area alteration was
much insignificant due to the weak hydrodynamics.
During the period of 2019 to 2021(phase Ⅲ),
autumn floods occurred in the Hanjiang, and the
flood discharge days of the sluice reached 75 days,
and the discharge exceeded 10,000 m
3
/s. With the
hydrodynamic factors changed, the scour pit under
the dam presents a scouring trend, mainly within the
range of 75-85m. As shown in figure 3, the scour is
mainly located on the downstream tail slope. To sum
up, the morphology of the scour pit is
unstable.Considering the increasing discharge, the
scour pit in the morphological changes has the
potential to show an increasing trend. The scour
position of the scour pit is prone to locate the slopes
on both sides and downstream.
The section changes of the three scour zones in
the scour pit over the years were analyzed, as shown
in figure 6. As can be seen from the figures, scour
basically develops along the erosion zone ① . In
2011, the scour depth reached the maximum with an
elevation of 52.6m, which was more than 6m lower
than that of the same area in 2005. Subsequently, the
erosion zone①did not wash down further, and the
lowest elevation gradually increased, but the slope
near the downstream showed a trend of continuous
scour. With an elevation of 73m, the distance in
2019 was scrubbed nearly 20m compared with that
in 2011. The scour zone mainly showed downward
scour from 2005 to 2011, downstream scour from
2011 to 2019, and the scour zone mainly showed
downward scour and slope collapse from 2019 to
2021, with a collapse amplitude of 11m.
The lowest point of erosion zone②occurred in
2013, which was 54.5m. Then the pit bottom showed
a trend of backsilting with erosion zone②, and the
downstream slope showed a trend of scour,
especially in 2021, the slope scoured down about
15m. The erosion zone③ is relatively higher than
the other two, with the lowest elevation of 58.7m.
The scour range at the bottom of the pit and on both
sides of the slope is not large. The maximum scour
occurred in the transverse direction in 2009, which is
relatively stable in recent years. To sum up, scour
mainly occurs in the area of erosion zone①, while
erosion zone ② and ③ is relatively weak. The
amplitude and morphological changes of the scour
pit are strongly correlated with the discharge and
opened dam sections of the Danjiangkou dam.
Figure 3: Elevation changes of the scour pit. Positive values indicate net deposition while negative values indicate net
erosion.
ISWEE 2022 - International Symposium on Water, Ecology and Environment
314

Figure 4: The erosion (negative values) and deposition (positive values) rates of the scour pit.
Figure 5: Horizontal changes of the scour pit in the 60m contours and the state of the lowest elevation.
Morphological Evolution of the Scour Pit After Danjiangkou Dam Heightening Project
315
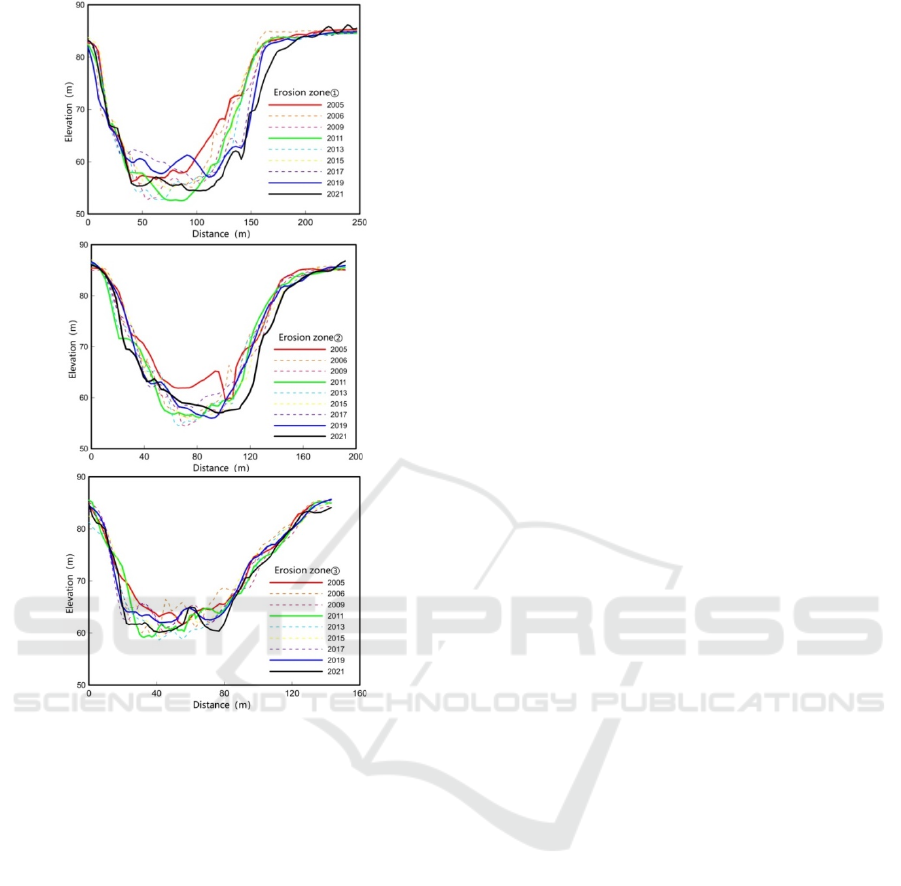
Figure 6: Changes in the profile of the erosion zone①-③.
5 EMPIRICAL ORTHOGONAL
FUNCTION ANALYSIS
Based on the principle of empirical orthogonal
function (EOF) analysis, this section calculate the
contribution rates of different modes and
corresponding spatial and temporal parameters
below the 85m contour area of scour pits under the
dam, so as to accurately and scientifically analyze
the evolution characteristics of the scour pit under
the dam. The contribution rates of the first three
modes are 58.5%, 14.0% and 9.6%, respectively.
Therefore, the spatial and temporal distribution
characteristics of the first three modes are mainly
introduced according to the proportion.
Spatial function data were processed by contour
map, positive value indicated deposition(use warm
colors) while negative value represents erosion(use
cool colors) for making the spatial function more
intuitive to show the evolution of the scour pit. As to
the sedimentation area, scour is in the increasing
stage of time function and sedimentation is in the
decreasing stage. For the scour area, the trend is
opposite.
The first mode is most considerable for
morphological evolution, contributing to 58.5% of
the elevation variability (fig 7a).It can be seen that
the main trend of scour and accretion area of the
scour pit under Danjiangkou dam: the bottom of the
scour pit is gradually silted, and the slope (especially
tail of the erosion zone) are gradually scoured. On
the whole, the scour is the main with the maximum
scour depth is 0.065m while the maximum
sedimentation thickness is 0.02m. According to
figure 9b, the time function corresponding to the
first mode shows a rising trend, indicating that the
bottom of the scour pit near the apron presents a
continuous silting trend, and the tail channel of the
scour zone presents a continuous scouring trend. The
most intense areas of scouring and silting are located
in the erosion zone①, which is consistent with the
analysis results of the evolution characteristics of the
scour pit in the previous chapter. Moreover, it is
found that the evolution intensity is directly
proportional to the gradient of time function. The
change gradient of the time function from 2019 to
2021 is large, indicating that the erosion of the scour
pit has the greatest impact during this period. The
first mode reflects, to a certain extent, the impact of
hydraulic factors (including the intensity of
downstream discharge and the impact of hydraulic
push caused by the water head difference and ect.)
on the scouring and silting of the riverbed.
The contribution rate of the second mode is 14.0% (
figure 7c), and that of the third mode is only 9.6% (
figure7e). Compared with the first mode, the
contribution rate of the second mode is much lower,
but it can also show the evolution characteristics of
the scour pit under the dam to a certain extent. The
scour/silt degree of the second and third modes is
relatively balanced. The scour of the second mode
mainly occurs at the slope of scour pit (mainly
upstream, left and right) and the bottom, and the
scour range is small but the depth is large. Siltation
mainly occurs downstream of the scour pit.
Incorporating with the distribution of alternate time
function of "W" and "M" patterns of the second
mode and the evolution of scour pits over the years (
figure7d), it can be seen that the second mode is an
alternate scour and silting state of the scour pit, and
the degree of scour and silting is basically balanced,
indicating that the siltation in the downstream of
ISWEE 2022 - International Symposium on Water, Ecology and Environment
316
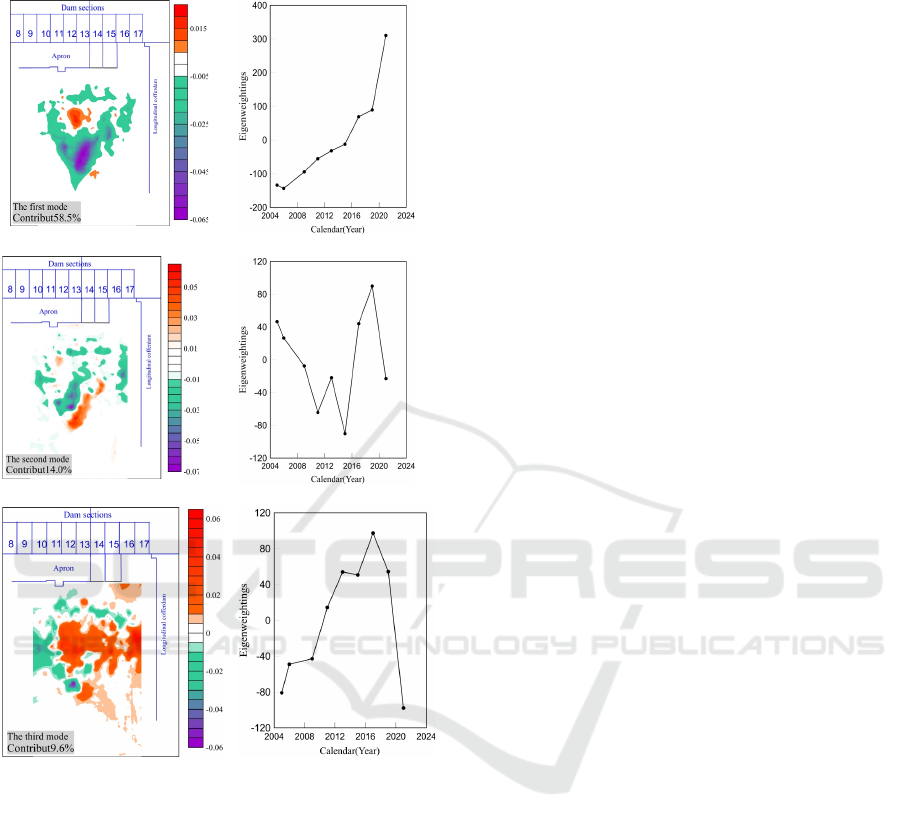
scour pits is mostly from the sediment scoured down
from the upstream of the scour pit.
(a)
(b)
(c)
(d)
(e)
(f)
Figure 7: The time-space variation of the scour pit by the
EOF analysis.
From the perspective of the spatial distribution of
the third mode, the scour area mainly occurs in the
slope and erosion zone①, and the siltation area is
concentrated in the center and the left of the scour
pit. According to the thickness distribution of scour
and siltation, variations are basically the same, that
is to say, the local morphological adjustment of the
scour pit is mainly caused by the exchange of the
center of the scour pit and the slope of the scour pit.
Due to the shape of the scour pit, the sediment of the
slope is prone to deposit in the middle.
6 CONCLUSIONS
During the period of 2005 to 2021, the scour pit
under Danjiangkou dam was experienced
significantly morphological evolution. From the
horizontal plane, the scour pit gradually increased in
scope, mainly reflected in the extension of the
downstream area. The scour pit was mainly scoured
downstream along the three erosion zones, mainly
occurring in the erosion zone①. For the longitudinal
perspective, the phase Ⅰ (2005-2013) is the main
development period of the scour pit, and the scour
pit shows downward flushing depth. Scour volume
in this period is 5.18×10
4
m
3
accounting for 48.1%
of the total amount of scour pit, and the lowest
height of scour pit decreases by about 6m.
After the implementation of the Danjiangkou
dam heightening project, for the phase Ⅱ (2013-
2019), the scour pit developed slowly. The scour
area extended downstream mainly by scouring the
downstream slope. Meanwhile, the scour pit bottom
showed a silting trend instead of being scoured
further. The scour pit was in the redevelopment
stage for the phaseⅢ(2019-2021). The scour pit was
significantly deeper downstream, mainly due to the
change of hydrodynamic factors, such as the
significant increase of downstream discharge and the
increase of water head distance. In 2021, the normal
water level of the Danjiangkou dam was up to 170m
the first time, and the water head difference reached
74.97m. The scour area was moved to downstream
significantly. Meanwhile, the scour pit slopes
(mainly the upstream near the dam apron, the right
bank area and the downstream area of the erosion
zone) were still be eroded.
ACKNOWLEDGMENTS
This work was supported by National Natural
Science Foundation of China (Grant No.
U20A20317).
REFERENCES
Akiyama, J. , Hong, L.D. , Meura, M., (2010). Analysis of
scour process downstream of a sluice. Doboku Gakkai
Ronbunshuu B, volume 35, pages 489-494.
Beckers, J.M., Rixen, M., (2003). EOF calculations and
data filling from incomplete oceanographic datasets.
Journal of Atmospheric & Oceanic Technology,
volume 20(12), pages 1839-1856.
Morphological Evolution of the Scour Pit After Danjiangkou Dam Heightening Project
317

Cai. Y.J.(2007). Forecast for reservoir geological
problems after dam heightening of Danjiangkou
hydroprojec. Yangtze River.
Dai, Z., Liu, J.T, Wen, W., (2015). Morphological
evolution of the South Passage in the Changjiang
(Yangtze River) estuary, China. Quaternary
International, 380-381: 314-326.
Duan, W., Zhang, H., Hou, D., (2007). Hydraulic
problems caused by heightening of Danjiangkou Dam.
Hubei Water Power .
Fan, A.M. (2021). Three-dimensional numerical
simulation of local scour pit downstream of spillway
sluice. Engineering and Technological Research.
Hamidifar, H., Omid, M.H., (2017). Local scour of
cohesive beds downstream of a rigid apron. Canadian
Journal of Civil Engineering, 44(11).
Horrillo-Caraballo, J.M, Reeve, D.E., Li, B., (2002).
Eigenfunction analysis of complex estuary
morphology. Hydroinformatics 2002 Vol.1: Model
Development and Data Management. Division of
Environmental Fluid Mechanics, School of Civil
Engineering, University of Nottingham, University
Park, Nottingham, NG7 2RD.
Hao, M., Li G.D. (2019). Erosion test on riverbed
downstream spillway dam of Chaiping Hydropower
Station. South-to-North Water Transfers and Water
Science & Technology .
Hu, B., Yang, Z., Wang, H., Sun, X., Bi, N., Li,G., (2009).
Sedimentation in the three gorges dam and the future
trend of changjiang (yangtze river) sediment flux to
the sea. Hydrology and Earth System Sciences, 13(11).
Li, Y.T., Sun, Z., Deng, J.N., (2003). A Study on Riverbed
Erosion Downstream from the Three Gorges
Reservoir. Journal of Basic Science and Engineering .
Nitsche, F.O., Ryan, W., Carbotte, S.M., Bell, R.E.,
Mchugh, C., (2006). Regional patterns and local
variations of sediment distribution in the Hudson
River Estuary. Estuarine and Coastal Marine Science,
259-277.
Shang, Y.P.,( 2012) Research of the theory and method of
design of drop-out underflow energy dissipator.
Kunming University of Science and Technology.
Wang, C., Chen, Z., Mao, X., (2002). Hydraulics study on
heightened scheme of Danjiangkou Project. Journal of
Yangtze River Scientific Research Institute .
Wang, Q.G., Hang, H.J., Song, B., Wang, X.B., (2007).
Downriver scouring pit origin analyzed in the project
of raising the Danjiangkou Dam. Water Conservancy
Science and Technology and Economy .
Xia, F., Zhang, Y. Z., Wei, W.U., Sun, Y., Jianhua, M.A.,
Can, L.I., (2009). Progress in applications of the
eof analysis in the research of coastal geomorphology
and sedimentology. Progress in Geography, 28(2).
Yosef, G., Alpert, P., Price, C., (2017). Using EOF
analysis over a large area for assessing the climate
impact of small-scale afforestation in a semiarid
region. Journal of Climatology & Applied
Meteorology, 56 (9), 2545–2559.
Yuhi, M., Dang, M.H., Umeda, S.,
(2005). Comparison
of accelerated erosion in riverbed and downstream
coast by EOF analysis. Journal of Coastal Research,
65(Part 1, Sp. Iss. 65):618-623.
Zhang, H., Zhang, X., Wang, X., Wu, Q., Zhao, Y.,
(2008). Scouring characteristics of downstream
channel after operation of Danjiangkou Reservoir.
Journal of Yangtze River Scientific Research Institute,
25(6):19-22 .
Zou, Q, Tang L , Chen J,. (2018). Study on Calculation of
Scour downstream the Dam of Bazizui Hub of
Xinjiang River. Water Resources and Hydropower
Engineering.
ISWEE 2022 - International Symposium on Water, Ecology and Environment
318
