
Research on Green Clothing Consumption Behavior of Urban
Residents Based on Structural Equation Model:
Take Beijing Residents as an Example
Jia Shi
1a
and Jun Ning
2,* b
1
School of Business, Beijing Institute of Fashion Technology, Beitucheng East Road, Taiyanggong Town, China
2
Beijing Philosophy and Social Sciences Capital Costume Culture and Clothing Industry Research Base,
Beijing Institute of Fashion Technology, Beitucheng East Road, Taiyanggong Town, China
Keywords: Structural Equation Model, Clothing Green Consumption, Cognition, Attitude, Intention, Behavior.
Abstract: In order to promote green clothing consumption and help achieve the goal of "carbon peak" and "carbon
neutrality", based on 1005 questionnaires and combined with the theory of planned behavior, SPSS19.0 and
AMOS23.0 software were used to build a structural equation model to explore the correlation between
cognition, attitude, willingness and behavior of green clothing consumption in Beijing and the moderating
factors. The results show that consumers' cognition of green clothing consumption will have a positive and
significant impact on their consumption attitude, and then have a significant impact on their consumption
intention, and finally affect their consumption behavior. Women, those with lower age and education level,
unmarried, non-state-owned occupation, high family income or small family size have a significantly higher
impact on the attitude of green clothing consumption cognition than other groups. Women, people with
higher education level, higher family income or smaller family size have a significantly higher impact on
green clothing consumption attitude than other groups. The influence of green clothing consumption
intention on behavior of older people is significantly lower than that of other groups. The government
should strengthen the dissemination of green clothing consumption knowledge, enterprises should carry out
differentiated publicity, improve technology, and consumers should cultivate green clothing consumption
habits.
a
https://orcid.org/0000-0003-3492-6576
b
https://orcid.org/0000-0002-7728-9071
1 INTRODUCTION
At the 75th session of the United Nations General
Assembly, China announced that it would strive to
reach a carbon peak by 2030 and become carbon
neutral by 2060. The "double carbon" goal was later
written into the "14th Five-Year Plan", which has
become a hot spot of social concern. The textile and
apparel industry is the second most polluting
industry in the world after the oil industry. How to
reduce its negative impact on the environment,
achieve green development and help achieve the
"double carbon" goal has gradually become the
focus of research. The green development of the
garment industry depends not only on materials,
design and production (Dong, 2018), but also on
consumers and their intension, behavior and habits
(Ning, 2022).
Up to now, there is little research on green
clothing consumption. It mainly focuses on the
following aspects: First, the research on green
clothing consumption behavior (Wang,2018), which
believes that the process of green clothing
consumption behavior includes three stages:
purchase, use, disposal and abandonment. The
second is the research on the influencing factors of
green clothing consumption intention (Zhang, 2013),
which believes that factors such as customer
perceived value will have an impact on consumption
intention. The third is related research on cognition
and attitude of green clothing consumption (Sui,
2013), which holds that consumers' cognition,
116
Shi, J. and Ning, J.
Research on Green Clothing Consumption Behavior of Urban Residents Based on Structural Equation Model: Take Beijing Residents as an Example.
DOI: 10.5220/0012026700003620
In Proceedings of the 4th International Conference on Economic Management and Model Engineering (ICEMME 2022), pages 116-126
ISBN: 978-989-758-636-1
Copyright
c
2023 by SCITEPRESS – Science and Technology Publications, Lda. Under CC license (CC BY-NC-ND 4.0)
attitude and lifestyle of green clothing consumption
will have an impact on their consumption behavior.
According to the viewpoint of psychological and
behavioral science, consumers' cognition of things
will affect their attitude, thus affect their
consumption intention and finally affect their
consumption behavior. Therefore, this paper uses
structural equation model to analyze the cognition,
attitude, willingness and behavior of different
consumer groups in Beijing on green clothing
consumption, and explores the influence path of
green clothing consumption, so as to promote the
concept of green clothing consumption and promote
the green development of the clothing industry.
2 THEORETICAL FOUNDATION
AND HYPOTHESIS TESTING
Existing studies show that cognition, as a kind of
psychological variable, will have an impact on
consumer behavior (Zeng,2009). and consumers'
understanding of the characteristics of green
clothing will have a significant impact on their
consumption attitude, thus affecting their behavior.
So to come up with a hypothesis.
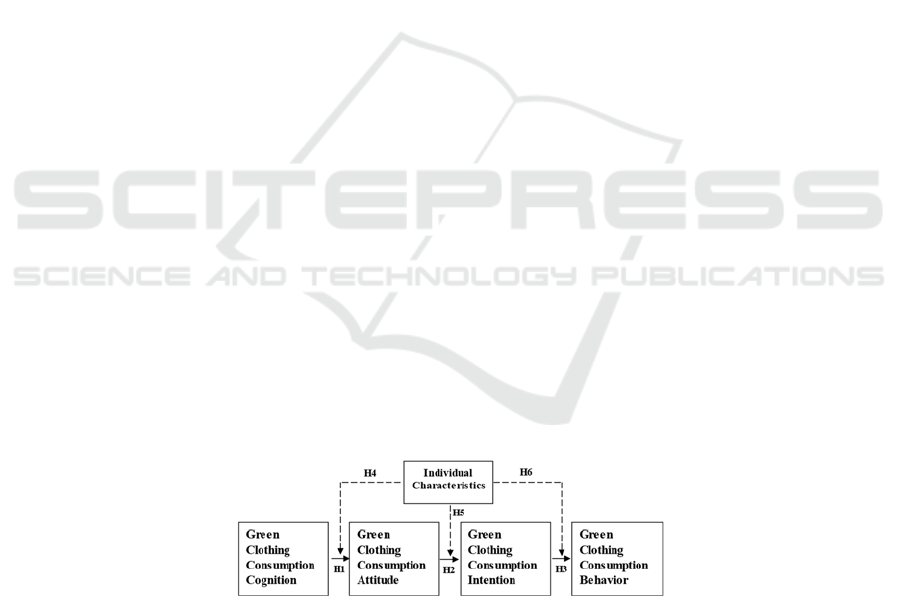
H1: Consumers' clothing green consumption
cognition will affect their attitude toward green
clothing consumption. The more full the cognition,
the higher the impact.
According to the theory of planned behavior,
attitude influences intention and thus determines
behavior (Ajzen, 1997). Green consumption attitude
is an important factor to promote consumers' green
consumption behavior. The more positive the
attitude, the stronger the intention of green
consumption. Therefore, the hypothesis was put
forward:
H2: Consumers' clothing green consumption
attitude will affect their clothing green consumption
intension. The more positive the attitude, the higher
the impact.
Existing research shows that positive attitudes do
not equal positive behavior, and consumer behavior
does not always reflect their preferences. Generally
speaking, the actual behavior of people is the
concrete implementation of their behavioral
intention. The stronger the intension of consumers to
consume green clothing, the more likely they are to
carry out green clothing consumption behavior
(Liang, 2020). Based on this, this paper puts forward
the following hypotheses:
H3: Consumers' clothing green consumption
intension will affect their green clothing consump-
tion behavior. The stronger the intension, the higher
the impact.
Existing studies have shown that individual
characteristics such as gender, age and marital status
have a significant impact on consumption behavior
(Wang, 2008). Therefore, the hypothesis is put
forward:
H4: Individual characteristics have a moderating
effect on the relationship between clothing green
consumption cognition and clothing green consump-
tion attitude.
H5: Individual characteristics have a moderating
effect on the relationship between clothing green
consumption attitude and clothing green consump-
tion intention.
H6: Individual characteristics have a moderating
effect on the relationship between green clothing
consumption intention and green clothing consump-
tion behavior.
The logical framework is shown in Figure 1.
Figure 1: Logical framework diagram (Owner-draw).
3 STUDY DESIGN
3.1 Scale Design
The questionnaire was divided into five parts
including cognition, attitude, intention, behavior and
individual characteristics of green clothing
consumption, with a total of 36 items. The
respondents were asked to fill in the degree of
agreement with the four potential variables of
cognition, attitude, willingness and behavior of
green clothing consumption, which included 29
Research on Green Clothing Consumption Behavior of Urban Residents Based on Structural Equation Model: Take Beijing Residents as an
Example
117
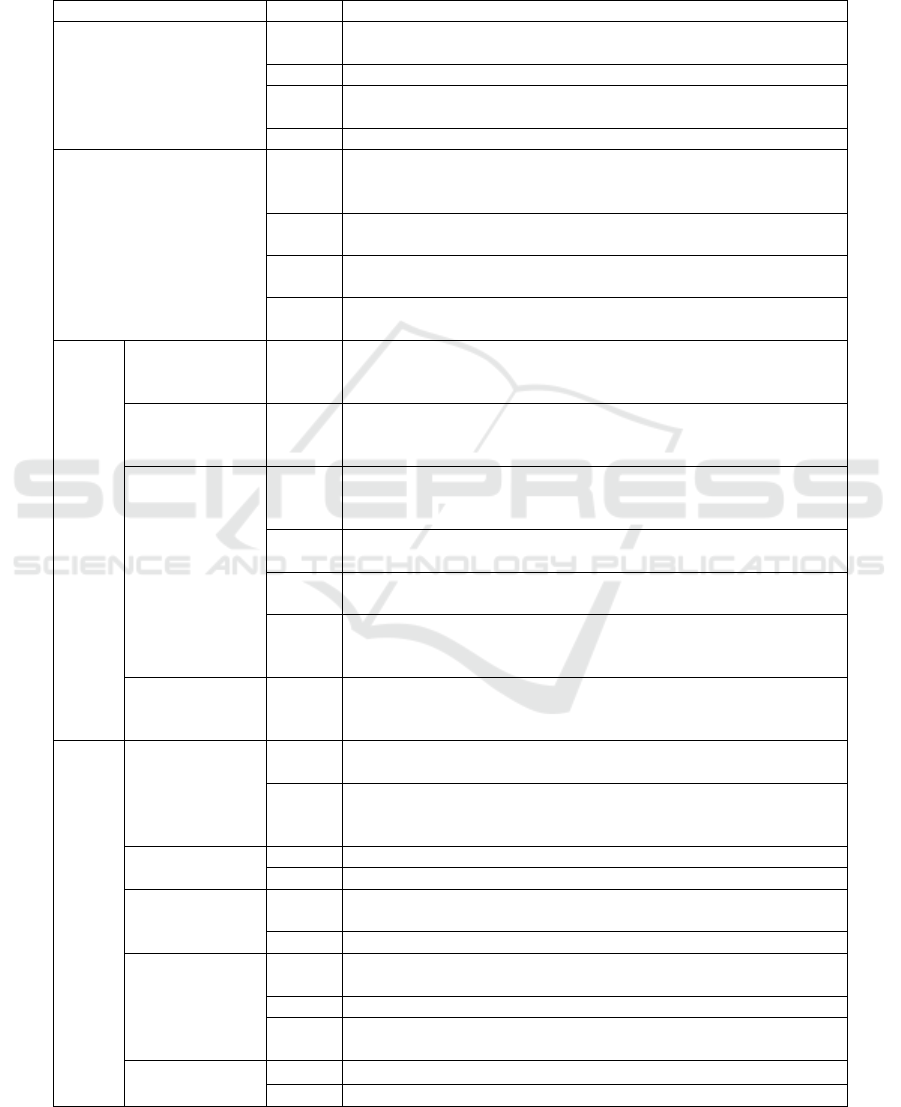
measurement items. Individual characteristics
include gender, age, highest education level, marital
status, occupation, monthly household income and
resident population. C1, C3, A1, BIA1, BWU1 and
BDP1 are reverse design topics, which will be
reversed in subsequent analysis, as shown in Table 1
for details. Maintaining the Integrity of the
Specifications.
Table 1: Measurement variables and measurement contents.
Latent variables s
y
mbol Measurin
g
ite
m
Green
Clothing
Consumption
Cognition
C1
R- I know very little about the negative environmental impact of
the
p
roduction and use of clothin
g
.
C2 I can correctl
y
identif
y
the environmental lo
g
o on the clothin
g
.
C3
R- I am not in the habit of checking the environmental labels on
the han
g
ta
g
s when sho
pp
in
g
for clothin
g
.
C4 I believe in the
g
reen label of clothin
g
manufacturers.
Green
Clothing
Consumption
Attitude
A1
R- I think protecting the environment, saving energy and reducing
emissions is the responsibility of the government and enterprises,
which has little to do with me.
A2
When I go shopping in the supermarket, I bring my own shopping
b
a
g
.
A3
In order to protect the environment, I am willing to give up some
p
ersonal interests and convenience of life.
A4
I will take the initiative to promote environmental knowledge and
skills to m
y
friends and famil
y
.
Green Clothing Consumption Intention
Material
Environmental
Protection
IMR
When buying clothes, I prefer brands that use materials that have
little impact on the environment (e.g., organic cotton; Avoid using
harmful chemicals in production, etc.).
Packaging
Environmental
Protection
IPK
When I buy clothes, I prefer a brand that tests the materials used in
the packaging.
Production
Environmental
Protection
IPD1
When shopping for clothing, I prioritize brands that provide
environmental guidance to outsourced manufacturers: legal
re
q
uirements, best
p
ractices, etc.
IPD2
When I buy clothes, I prefer brands that use less water in the
p
roduction process.
IPD3
When I buy clothing, I prefer brands that reduce the production of
solid textile waste.
IPD4
When I buy clothing, I prioritize brands that encourage suppliers
to continuously improve their environmental performance (e.g.,
reduce water and energy use, reduce solid waste).
Transport
Environmental
Protection
ITP
When I'm shopping for clothing, I prefer brands that are
environmentally friendly transportation companies.
Green Clothing Consumption Behavior
Search for
Information
BIA1
R-I do not pay attention to the environmental information related
to the
p
roduction, wear and use of clothing, waste disposal, etc.
BIA2
I will actively search and query the environmental protection
information related to clothing production, wearing, use and
disposal.
Products to Buy
BP1 I alwa
y
s bu
y
a lot of clothes and en
j
o
y
sho
pp
in
g
.
BP2 I usuall
y
bu
y
smaller
q
uantities of clothes that last lon
g
er.
Products Use
BWU1
R- I like to wear new clothes, and I don't wear the clothes I already
have for more than a few times.
BWU2 I tr
y
to wear as much of what I have.
Products Care
BPC1
I try to reduce the frequency of washing and ironing without
affecting my clothes.
BPC2 When using the washing machine, I let it work at full capacit
y
BPC3
When using the washing machine, I use a moderate amount of
detergent to wash at a low temperature.
Waste Disposal
BDP1
R- I throw old clothes I'm sure I don't want in the trash。
BDP2 For outdated or partially damaged clothes, I will do it myself or
ICEMME 2022 - The International Conference on Economic Management and Model Engineering
118

take them to a chan
g
e sho
p
for modification and reuse.
BDP3
I give my old clothes directly to relatives, friends or people I
know.
BDP4 I
g
et involved in all sorts of old clothes drives.
BDP5 I put my old clothes in the recycling bin.
Demographic
Variables
GEND Gende
r
AGE Age
HEDU The hi
g
hest record of formal schoolin
g
MS Marital status
OCC Occu
p
ation
FMI Monthly household income
PRN The population of permanent residents
3.2 Research Object and Sample
Structure
A total of 1108 questionnaires were collected
through a combination of online and offline
research. There were 1005 valid questionnaires. The
basic characteristics of the interviewees are shown in
Table 2. The respondents were mainly female, with
629 females (62.6%) and 376 males (37.4%). The
respondents are mainly young and middle-aged, with
the majority aged 0-44 years old, ac-counting for
82.7% in total. The sample over 55 years old is less
(only 2.7%). Most of the respondents had a
bachelor's degree or above, accounting for 73%. A
similar proportion of respondents were unmarried
and married; A high proportion of respondents are
students (29.4%), professional and technical
personnel (16.5%), office personnel and related
personnel (13.0%) and commercial and service
personnel (12.6%). The monthly household income
of the respondents is concentrated in the range of
10,000 to 39,000 yuan, accounting for 57.1% of the
total, basically in line with the reality of Beijing. The
family size of the respondents is mainly 3 to 4
people, which is in line with the basic composition
of Chinese families at this stage. Generally speaking,
the social demographic characteristics of the
respondents are basically in line with the basic
characteristics of clothing consumer groups, and the
data have certain reliability.
Table 2: Basic statistics of the survey sample.
Statistical Indicators Classification Indexes Number of Samples The Percent-age %
Gender
Male 376 37.4
Female 629 62.6
Age
A
g
e 24 and unde
r
354 35.2
25 to 44 477 47.5
45 to 54 147 14.6
A
g
e 55 and olde
r
27 2.7
The Degree of Education
Hi
g
h school/Technical school and below 154 16.3
Junior Colle
g
e/Vocational Colle
g
e 117 11.7
University degree 505 49.7
Master degree or above 229 22.3
Marital status
Unmarrie
d
484 48.3
Marrie
d
499 49.3
Divorce
d
22 2.4
Occupation
Staff of state-owned units 90 8.7
Professional and technical personnel 164 16.5
Officials and related personnel 132 13.0
Business and service personnel 122 12.6
Agricultural, forestry, animal husbandry,
fishing, water industry production
p
ersonnel
17 1.7
Production and transportation equipment
operators and related personnel
26 2.5
Police and militar
y
81.0
Freelance
r
60 5.9
Self-em
p
lo
y
ed, small stall owners 31 3.1
Research on Green Clothing Consumption Behavior of Urban Residents Based on Structural Equation Model: Take Beijing Residents as an
Example
119

Other occupations inconvenient to
classif
y
27 2.5
Students 296 29.4
Retired
p
ersons 19 1.8
Unemploye
d
13 1.2
Monthly household
income
10000 the following 296 29.7
10,000 to 39,000 574 57.1
40,000 to 79,000 96 9.4
80,000 and above 39 4.3
The population of
permanent residents
1 to 2 146 14.4
3 to 4 726 72.3
3.3 The Reliable Test
Cronbach's Alpha coefficient is often used as the
measurement standard for the validity of test data. A
value between 0.7 and 0.98 indicates good
reliability, and a value lower than 0.35 must be
rejected (Wang,2021). This paper conducted validity
analysis with the help of SPSS19.0 software, and the
results are shown in Table 3. The overall Cronbach's
Alpha coefficient of the scale was 0.865, and the
coefficient values of each dimension were 0.539,
0.548, 0.964 and 0.665, respectively, indicating that
the scale items need to be further purified.
Therefore, this study conducted variance
homogeneity test to find out and delete items whose
product difference correlation coefficient (CITC)
between a single questionnaire item and other items
of the scale did not reach the consistency level.
According to the empirical results in Table 4, the
CITC values of C4, A2, BIA1, BP1, BWU1 and
BDP1 in the initial question items are low, so they
need to be deleted. After the re-analysis and test,
Cronbach's Alpha values were all greater than 0.7,
except for the cognition of clothing green
consumption, which were improved compared with
the empirical results before the deletion of six
questions. The overall Cronbach's Alpha coefficient
was 0.884, showing high reliability. The results after
the purification and deletion of items are shown in
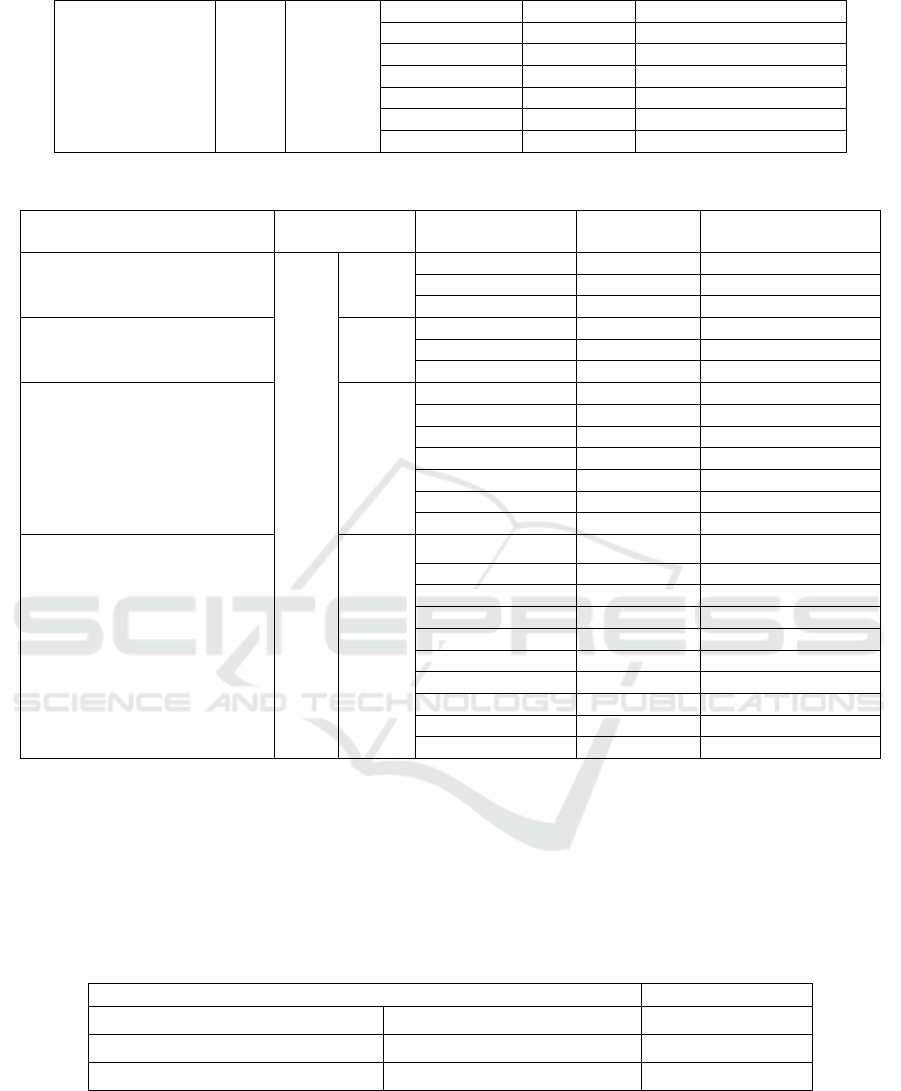
Table 4. Finally, there were 3 items to measure the
cognition of green clothing consumption, 3 items to
measure the attitude of green clothing consumption,
7 items to measure the willingness of green clothing
consumption, and 10 items to measure the behavior
of green clothing consumption.
Table 3: Reliability analysis results of the scale.
Subscales
Cronbach's
Al
p
ha Coefficient
Observed
variables
CICT
Overall α coefficient after
deletin
g
this item
Green Clothing
Consumption
Cognition
0.865
0.539
C1 0.457 0.348
C2 0.457 0.345
C3 0.256 0.533
C4 0.154 0.588
Green Clothing
Consumption
Attitude
0.548
A1 0.327 0.484
A2 0.120 0.738
A3 0.513 0.357
A4 0.543 0.321
Green Clothing
Consumption
Intention
0.964
IMR 0.769 0.966
IP
K
0.832 0.961
IPD1 0.897 0.956
IPD2 0.896 0.956
IPD3 0.914 0.955
IPD4 0.914 0.955
ITP 0.881 0.957
Green Clothing
Consumption
Behavior
0.665
BIA1 0.094 0.677
BIA2 0.332 0.641
BP1 0.104 0.674
BP2 0.183 0.662
BWU1 0.202 0.659
BWU2 0.445 0.631
BPC1 0.430 0.627
ICEMME 2022 - The International Conference on Economic Management and Model Engineering
120
BPC2 0.257 0.652
BPC3 0.397 0.634
BDP1 0.035 0.687
BDP2 0.410 0.628
BDP3 0.345 0.639
BDP4 0.504 0.616
BDP5 0.355 0.637
Table 4: Post item reliability analysis scale.
Subscales
Cronbach's Alpha
Coefficient
Observed variables CICT
Overall α coefficient
after deletin
g
this ite
m
Clothing Green
Consumption Cognition
0.884
0.588
C1 0.510 0.319
C2 0.357 0.545
C3 0.335 0.583
Clothing Green
Consumption Attitude
0.738
A1 0.463 0.770
A3 0.633 0.573
A4 0.602 0.604
Green Clothing
Consumption Intention
0.964
IMR 0.769 0.966
IP
K
0.832 0.961
IPD1 0.897 0.956
IPD2 0.896 0.956
IPD3 0.914 0.955
IPD4 0.914 0.955
ITP 0.881 0.957
Green Clothing
Consumption Behavior
0.745
BIA2 0.272 0.743
BP2 0.255 0.744
BWU2 0.383 0.728
BIPC1 0.488 0.712
BPC2 0.325 0.736
BPC3 0.455 0.718
BIDP2 0.485 0.711
BDP3 0.448 0.717
BIDP4 0.557 0.701
BDP5 0.407 0.726
3.4 Validity of the Test
Exploratory factor analysis was used to test the
validity of the model. As shown in Table 5, The
KMO value was 0.923, indicating that the sample
size was sufficient, the correlation between each
item was strong, and there were potential common
factors. In addition, it passed the Bartlett test at the
level of 0.001, which proved that the validity was
good.
Table 5: KMO and bartlett's test results.
Kaiser-Meyer-Olkin
0.923
Bartlett's test for sphericity
The approximate chi-square
12241.099
df
253
Sig.
0.000
3.5 Goodness-of-fit Test
The questionnaire data were substituted into the
hypothesis model for the fit-ting test of the structural
equation model. It can be seen from Table 6 that all
indicators are at a good fit level, indicating that the
model and survey data have a high fitting effect and
a good reliability of the model.
Research on Green Clothing Consumption Behavior of Urban Residents Based on Structural Equation Model: Take Beijing Residents as an
Example
121
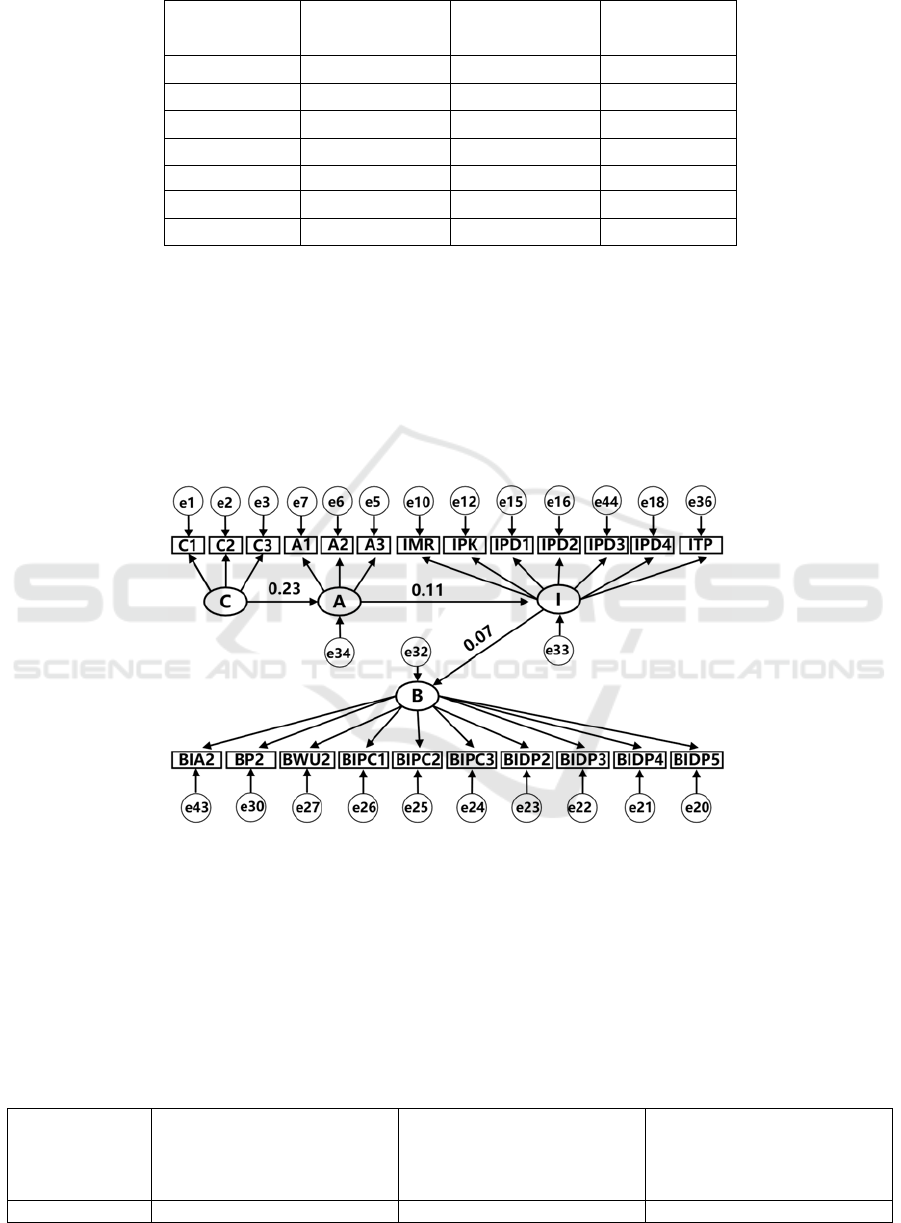
Table 6: Structural equation model fit index and results.
Statistical
indicators
The judgment
standard
value
Fitting
evaluation
X
2
/df
3-5
4.972
Ideal
RMSEA
<0.5
0.063
Approach
NFI
>0.9
0.909
Ideal
GFI
>0.9
0.926
Ideal
CFI
>0.9
0.925
Ideal
IFI
>0.9
0.926
Ideal
TLI >0.9
0.917
Ideal
4 RESULTS AND ANALYSTS
4.1 Influence Path Analysis
After goodness-of-fit and validity tests, hypothesis
H1-H3 was tested by structural equation model, and
the path analysis results were shown in Figure 2.
Ellipses are latent variables, rectangles are explicit
variables and circles are residuals. The number on
the arrow pointing to each explicit variable of latent
variable indicates the standardized factor loading
coefficient.
Figure 2: Structural equation model path analysis results (Owner-draw).
The estimation results of structural equation
model are shown in Table 7. The standardized path
coefficient of clothing green consumption cognition
toward attitude is 0.204, and the standardized path
coefficient of clothing green consumption intention
toward behavior is 0.440, both of which pass the test
at the significance level of 0.001. And dress green
consumption attitude to the will of the standardized
path coefficient was 0.141, and under the
significance level of 0.01 through inspection,
hypothesis H1, H2, H3, clothing green consumption
cognition of consumers more fully, the clothing
green consumption attitude more positive, clothing
green consumption desire more intense, the more
likely it is practice clothing green consumer
behavior.
Table 7: Estimation Results of Structural Equation Model
Hypothesis
H1: Green Clothing
Consumption Cognition→
Clothing Green Consumption
Attitude
H2: Green Clothing
Consumption Attitude→
Green Clothing Consumption
Intention
H3: Green Clothing
Consumption Intention→
Green Clothing Consumption
Behavio
r
Esti-mate 0.204 0.141 0.44
ICEMME 2022 - The International Conference on Economic Management and Model Engineering
122
S.E. 0.048 0.049 0.035
C.R. 4.281 2.856 12.511
P *** ** ***
Conclu-sion su
pp
ort su
pp
ort su
pp
ort
a. p<0.001 (***), p<0.01 (**), p<0. 05 (*)
4.2 Analysis of Moderating Effect
Gender, age, education level, marital status,
occupation, family monthly income and family size
were selected as moderating variables. AMOS23.0
software was used to test the applicability of the
model under different sample groups by multi-group
structural equation model. The results are shown in
Table 8.
Table 8: The Moderating Effect Test Results of Individual Characteristics.
Individual characteristics
The path
C→A A→I I→B
Gender
Male 0.195
**
0.018 0.463
***
Female 0.203
**
0.172
**
0.429
***
Age
Low
(below45)
0.175
***
0.106
*
0.487
***
High
(45 and above)
0.266
**
0.157 0.250
*
The degree of
education
Low
(junior college/
higher vocational
education and below
)
0.449
**
0.027 0.419
***
High
(bachelor's degree and
above)
0.132
*
0.167
**
0.449
***
Marriage status
Unmarrie
d
0.228
**
0.049 0.483
***
Marrie
d
0.122
*
0.131
*
0.379
***
Occupa-tion
State-owne
d
0.136 0.230 0.375
***
Non-state 0.187
***
0.097 0.443
***
Income
Low
(less than 15,000 yuan)
0.085 0.001 0.449
***
High(15,000 yuan or
more)
0.245
***
0.215
**
0.430
***
Family size
Big
(
4 or less
)
0.215
***
0.149
**
0.431
***
Small
(
5 or more
)
0.082 -0.075 0.503
***
a. p<0.001 (***), p<0.01 (**), p<0. 05 (*)
Headings, or heads, are organizational devices
that guide the reader through your paper. There are
two types: component heads and text heads.
Component heads identify the different
components of your paper and are not topically
subordinate to each other. Examples include
Acknowledgments and References and, for these,
the correct style to use is “Heading 5”. Use “figure
caption” for your Figure captions, and “table head”
for your table title. Run-in heads, such as “Abstract”,
will require you to apply a style (in this case, italic)
in addition to the style provided by the drop down
menu to differentiate the head from the text.
4.2.1 Gender Moderating Effect Test
In the path of clothing green consumption cognition
to attitude, both groups passed the test at 0.01
significance level, and the standardized path
coefficient of women (0.203) was higher than that of
men (0.195), indicating that women consumers'
clothing green consumption cognition was more
likely to affect their attitude. In the path from
clothing green consumption willingness to behavior,
both groups passed the test at the significance level
of 0.001, and the standardized path coefficient of
men (0.463) was higher than that of women (0.429),
indicating that compared with female consumers,
Research on Green Clothing Consumption Behavior of Urban Residents Based on Structural Equation Model: Take Beijing Residents as an
Example
123

men are more likely to take action after having
clothing green consumption intension.
4.2.2 Age Moderating Effect Test
In the path of clothing green consumption cognition
to attitude, the low age group and the high age group
passed the test at the significance level of 0.001 and
0.01 respectively, indicating that compared with the
old, the clothing green consumption cognition of the
younger consumers is more likely to affect their
consumption attitude.
4.2.3 Education Moderating Effect Test
In the path from attitude to intention of green
clothing consumption, the group with high education
level passes the test at the significance level of 0.01,
while the group with low education level fails the
test. It can be seen that the attitude of green clothing
consumption of consumers with high education is
more likely to affect their intention. In the path of
green clothing consumption intention to behavior,
both groups passed the test at the significance level
of 0.001, and the standardized path coefficients were
0.419 and 0.449. It indicates that consumers with
high education level are more likely to convert their
green clothing consumption intention into behavior.
4.2.4 Marriage Moderating Effect Test
In the path from willingness to green clothing
consumption to behavior, both unmarried group and
married (or formerly married) group passed the test
at the significance level of 0.001, and the standard
path coefficients were 0.483 and 0.379, respectively.
This indicates that the green clothing consumption
intention of married consumers is more likely to
change into green clothing consumption behavior.
4.2.5 Occupation Moderating Effect Test
In the path from intention to behavior of green
clothing consumption, both state-owned group and
non-state-owned group pass the test at the
significance level of 0.001. The standard path
coefficients of state-owned property group and non-
state-owned property group are 0.375 and 0.443,
respectively. This indicates that consumers with
non-state-owned occupation are more likely to
change their green clothing consumption intention
into green clothing consumption behavior than those
with state-owned occupation.
4.2.6 Income Moderating Effect Test
In clothing green consumption cognition to the
attitude and clothing green consumption attitude to
the willingness of the two paths, high-income groups
in 0.001 and 0.01 respectively through the test, at the
same level of significance of low-income group has
not been through the inspection, visible, high-
income consumers are more likely to affect the
garment green consumption attitude and clothing
green consumption attitude also are more likely to
affect their clothing green consumption desire. In the
path of green clothing consumption intention to
behavior, both the low-income group and the high-
income group pass the test at the significance level
of 0.001. The standardized path coefficients of low
income group and high income group were 0.449
and 0.430, respectively. This indicates that
consumers with lower family income are more likely
to change their green clothing consumption intention
into green clothing consumption behavior.
4.2.7 Family Size Moderating Effect Test
In clothing green consumption cognition to the
attitude and clothing green consumption attitude to
the willingness of the two paths, the small family
size set at 0.001 and 0.01 respectively through the
test, at the same level of significance has not been
large-scale group through the inspection, visible,
family population less consumer's clothing green
consumption attitude and green consumption
cognition are more likely to affect dress Green
clothing consumption attitude is also more likely to
affect their green clothing consumption intention. In
the path from willingness to green clothing
consumption to behavior, both the small family size
group and the large family size group pass the test at
the significance level of 0.001. The standardized
path coefficients of small family size group and
large family size group were 0.431 and 0.503,
respectively. This shows that consumers with more
family members are more likely to change their
green clothing consumption intention into behavior.
5 CONCLUSIONS
5.1 Conclusions
5.1.1 Transmission Mechanism of Green
Clothing Consumption
Green clothing consumption cognition has a
significant impact on consumption attitude, and
ICEMME 2022 - The International Conference on Economic Management and Model Engineering
124

green clothing consumption attitude has a significant
impact on consumption intention, and thus on green
clothing consumption behavior.
5.1.2 Individual Characteristics Will Have
an Impact on Green Clothing
Consumption
Consumer's gender, age, education level, marital
status, occupation, family income and family size
have moderating effects on some paths. Female,
younger, less educated, unmarried, non-state-owned
occupation, higher family income or smaller family
size consumers have a significantly higher impact on
their attitude toward green clothing consumption
than other groups. Consumers with female, higher
education level, higher family income or smaller
family size have a significantly higher impact on
willingness of green clothing consumption attitude
than other groups. However, the influence of green
clothing consumption intention on behavior of older
people is significantly lower than that of other
groups.
5.2 Suggestions
5.2.1 The Government Should Strengthen
the Popularization of Green Clothing
Consumption Knowledge
The government should disseminate knowledge
related to green clothing consumption from the
perspective of consumers, so as to help consumers
grasp more relevant information subtly and enhance
their enthusiasm and love for green clothing, so as to
have a positive effect on the willingness of green
clothing consumption behavior and then take
corresponding actions.
5.2.2 Enterprises Should Carry Out
Alienation Propaganda and Green
Transformation
Companies need to differentiate their publicity and
marketing to different groups, especially consumers
who are female, married, better educated and have
higher household incomes. Improve consumers'
attention to green clothing, improve their
consumption attitude, and then promote their green
clothing consumption willingness and behavior. In
addition, the environmental protection of materials,
packaging, production and transportation that
consumers are concerned about should be further
improved. Efforts should be made to achieve the
green development of the whole industrial chain, do
a good job in carbon footprint certification and data
visualization, and promote the realization of carbon
peak and carbon neutrality in the industry.
5.2.3 Consumers Should Cultivate Green
Clothing Consumption Habits
Consumers should start from themselves,
consciously choose to clean clothes in a way that
reduces resources and energy consumption, do a
good job in recycling and recycling waste clothes,
cultivate their own green clothing consumption
habits, and form a green and low-carbon lifestyle.
ACKNOWLEDGEMENTS
Thanks for the support of the key programs of
Beijing Social Science Foundation (19JDGLA010),
the postgraduate teaching quality improvement
program (120301990132), and the postgraduate
innovation program (120301990131) of Beijing
Institute of Clothing Technology.
REFERENCES
Ajzen.I, (1991). The Theory of Planned Behavior. Orga-
nizational behavior and human decision processes, 19-
91(50).
Dong X, Li H, Liu S, et al.(2018). How does material
possession love influence sustainable consumption
behavior towards the durable products? J. Journal of
Cleaner Production,198: 389-400
Liang J.F,He J.W.(2020). The relationship between
sustainable consumption cognition and clothing reuse
behavior based on the mediating effect of behavior
intention. J .Journal of Donghua University (Natural
Science Edition),46(03):463-471+478 .
Ning J, Shi J. (2022). Beijing residents dress green
consumption emotions and behavior of the empirical
study.J.Journal of textile,.lancet, (6): 157-164. The
DOI: 10.13475 / j.f ZXB. 20210700208.
Sui X.H. (2013). Research on the influencing factors of
consumers' attitudes towards green clothing. Beijing
Institute of Fashion Technology.
Wang M.A, Liu F, He Z.W. (2021). An empirical study on
the impact of major animal epidemics in China on
consumption intension. J. Journal of Henan
Agricultural University (06), 1152-1160.
doi:10.16445/j. cnki.1000 -2340.20210425.001.
Wang Y.Q, Song M.R, Cui Y.H. (2018). Study on the
Fashion Cycle of Green Consumer Behavior of
Clothing Consumers. Western Leather, 40(06):46.
Research on Green Clothing Consumption Behavior of Urban Residents Based on Structural Equation Model: Take Beijing Residents as an
Example
125

Wang Z.F, Yu H. (2008). Analysis on the influencing
factors of consumers' green food consumption
behavior. J. Statistics and Decision, (12): 93-95.
Zeng Y.R, Wang J. (2009). Investigation and Research on
the Internal Mechanism of College Students’ Green
Consumption. J .Consumer Economy, 25(05):56-59.
Zhang Q, Han Y. (2013). Research on Green Clothing
Purchase Intention and Influencing Factors, J, Silk,
50(12):41-45.
ICEMME 2022 - The International Conference on Economic Management and Model Engineering
126
