
Big Data Financial Analysis Comparison Between Midea and Gree
Based on Power BI Software
Tieping Wang
Department of Economics and Management, Taishan University, Tai’an, China
Keywords: Financial Analysis, Big Data, Comparison.
Abstract: Big data financial analysis is the application of big data technology to analyze the financial and
non-financial related information of enterprises. PowerBI is a very useful computer application software for
financial analysis. This paper uses PowerBI software for big data financial analysis, and makes a
comparative analysis of Midea and Gree in terms of profitability, solvency, operating ability and growth
ability. Gree's commodity profitability is better than Midea, and Midea's capital profitability is better than
Gree. Midea and Gree have relatively weak short-term solvency and comparable long-term solvency.
Midea's overall operational capability is stronger than Gree. Compared with the same period last year, both
Midea and Gree have good growth capabilities.
1 INTRODUCTION
Big data financial analysis is a set of techniques and
methods for the collection, preparation, analysis and
action of huge financial-related data (including
financial data and structured data and a large amount
of non-financial data and unstructured data) of the
company. It integrates accounting and information
systems (Fan, 2014). This paper uses Power BI
software for big data financial analysis, and makes a
comparative analysis of Midea and Gree in terms of
profitability, solvency, operating ability and growth
ability.
Power BI is useful business analysis software.
Power BI can connect available data sources,
simplify the data preparation process, provide
specialized analysis, and support the generation of
beautiful reports to better meet the needs of
accounting information users (Schroeder, 2019). The
use of Power BI simplifies the data analysis work of
business personnel, and can intuitively present the
trend of report data in each period, compare the
company's data with other companies in the same
industry, locate the company's position in the
industry, and determine the company's future
development direction (AREAS, 2018). Power BI is
very useful computer application software for
financial analysis.
Midea and Gree are both well-known home
appliance companies. In the industry rankings,
Midea and Gree have been competing for industry
leaders. Midea's earnings per share, net profit,
operating income and assets are better than those of
Gree, and Gree's gross profit margin is better than
that of Midea. This paper compares and analyzes the
profitability, solvency, operating ability and growth
ability of Midea and Gree, and evaluates the
financial status of Midea and Gree.
2 BASIC SITUATION
Midea's products mainly include HVAC and
consumer appliances, as well as robotics and
automation. Among them, HVAC revenue accounted
for 43.96%, consumer appliances accounted for
37.38%, and robotics and automation was a new
business, accounting for 7.24% of revenue. HVAC
and consumer appliances occupy an absolute
position in Midea's revenue. The revenue of HVAC
accounted for 43.96%, the cost accounted for
45.32%, and the profit accounted for only 39.46%,
which showed that the cost of HVAC was high. In
terms of gross profit margin, HVAC's gross profit
margin was 20.85%, lower than 29.6% for consumer
appliances and 22.72% for robots.
Wang, T.
Big Data Financial Analysis Comparison between Midea and Gree Based on Power BI Software.
DOI: 10.5220/0012027200003620
In Proceedings of the 4th International Conference on Economic Management and Model Engineering (ICEMME 2022), pages 155-159
ISBN: 978-989-758-636-1
Copyright
c
2023 by SCITEPRESS – Science and Technology Publications, Lda. Under CC license (CC BY-NC-ND 4.0)
155
Gree's product concentration is very high, and
73.8% of the company's revenue is concentrated on
air conditioners. Gree also produces household
appliances, but its revenue only accounts for 2.43%.
In terms of profit indicators, Gree air conditioners’
profit ratio reached 92.6%, with 73.8% of the
revenue and 67.94% of the cost, generating 92.6%
of the profit, indicating that the air conditioner is
Gree’s ace product, and the cost is very controlled.
The gross profit rate of Gree air conditioners is
29.79%, the gross profit rate of household
appliances is 32.54%, and the gross profit rate of
other products is low. As far as the sales area is
concerned, Gree's domestic sales accounted for
63.93% of its revenue, 55.53% of its costs, 90.9% of
its profits, and 33.75% of its gross profit margin. Its
foreign sales accounted for 13.98% of its revenue
and 16.49 of its costs. %, the proportion of 0 profit
is only 10%. Gree mainly relies on domestic sales to
obtain profits.
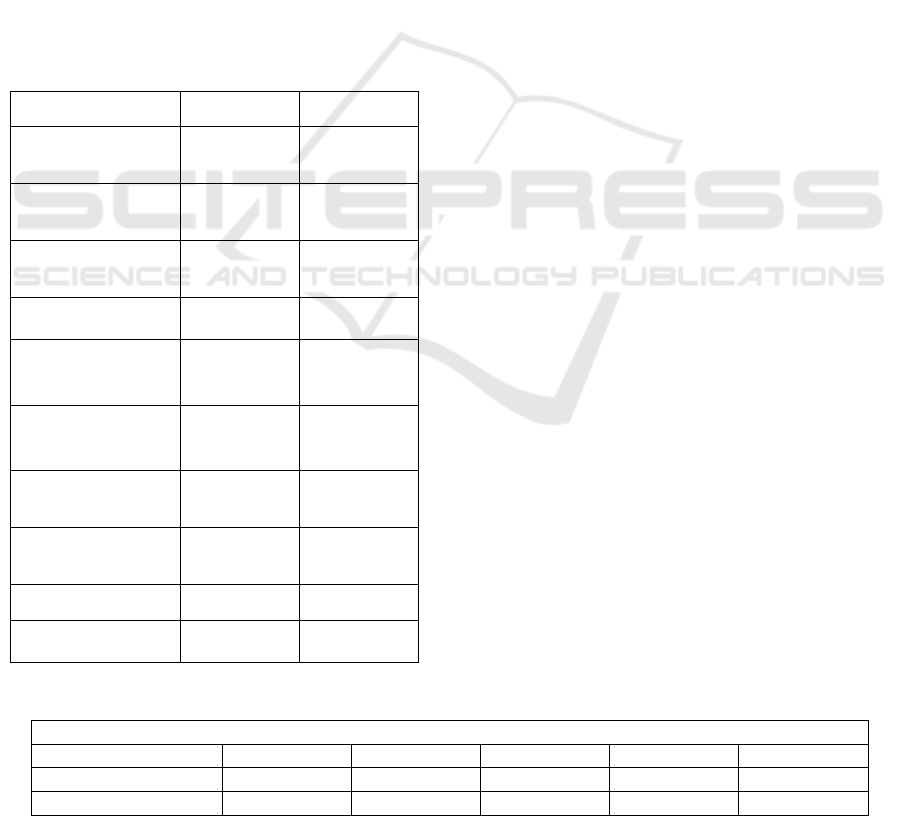
Table 1: Midea and Gree.
Midea Gree
EPS (yuan) 3.41 2.71
Net assets per share
(yuan)
16.97 15.34
Cash flow per share
(yuan)
3.994 1.074
Net profit (yuan)
23.460
b
illion
15.640billion
Total operating
income (yuan)
262.90billion 139.50billion
Total assets (yuan) 376.30billion 286.10billion
ROE 19.51% 15.02%
Shareholders'
Equity Ratio
34.09% 32.87%
Gross profit margin 23.80% 24.13%
Total share capital
(
shares
)
6.985billion 5.914billion
3 FINANCIAL COMPARATIVE
ANALYSIS OF MIDEA AND
GREE
3.1 Profitability
This section analyzes Midea's profitabily. In the
third quarter of 2021, the gross profit margin of
Midea's sales was 23.80%, compared with 25.29%
in the same period last year, indicating that Midea's
main business profitability has been greatly
weakened. Midea's current sales net profit margin
(9.07%), less than 10.24% last year, indicating a
decline in corporate operating efficiency. Midea's
net interest rate on total assets in the current period
(6.43%), less than 6.80% last year, indicating that
Midea's ability to return on total assets declined
slightly. Midea's current ROE was 19.51%, less than
20.35% last year, indicating that Midea's ability to
return to shareholders has weakened. The
profitability indicators of Midea Group have all
declined, and Midea's profitability has weakened.
Gree's gross profit margin in the current period
was 24.13%, compared with 23.37% last year,
indicating that Gree's main business profitability
remained stable. Gree's current sales net profit
margin was 11.36% is more than 10.96% last year,
indicating that the company's operating efficiency
has improved. Gree's net interest rate on total assets
(5.55%) is more than 4.95% last year, indicating that
Gree's ability to return on total assets has improved
slightly. Gree's return on net assets (15.02%) is more
than 11.74% last year, indicating that Gree's ability
to return to shareholders has increased. Compared
with the same period last year, Gree's profitability
indicators generally increased, indicating that the
profitability of the company has improved.
Midea's profitability decreased year-on-year,
while Gree's profitability increased year-on-year.
Comparing and analyzing the profitability indicators
of Midea and Gree, it can be found that Gree's net
sales profit margin and sales gross profit margin are
higher than those of Midea, but Midea's ROE is
higher than that of Gree. Gree's commodity
profitability is stronger, and Midea's capital
profitability is stronger.
Table 2: Profitability of Midea and Gree.
Midea's profitability
Subject\Time 2021-09-30 2021-06-30 2021-03-31 2020-12-31 2020-09-30
Sales margin 9.07% 8.75% 7.96% 9.68% 10.24%
gross profit margin 23.80% 23.23% 23.00% 25.11% 25.29%
ICEMME 2022 - The International Conference on Economic Management and Model Engineering
156
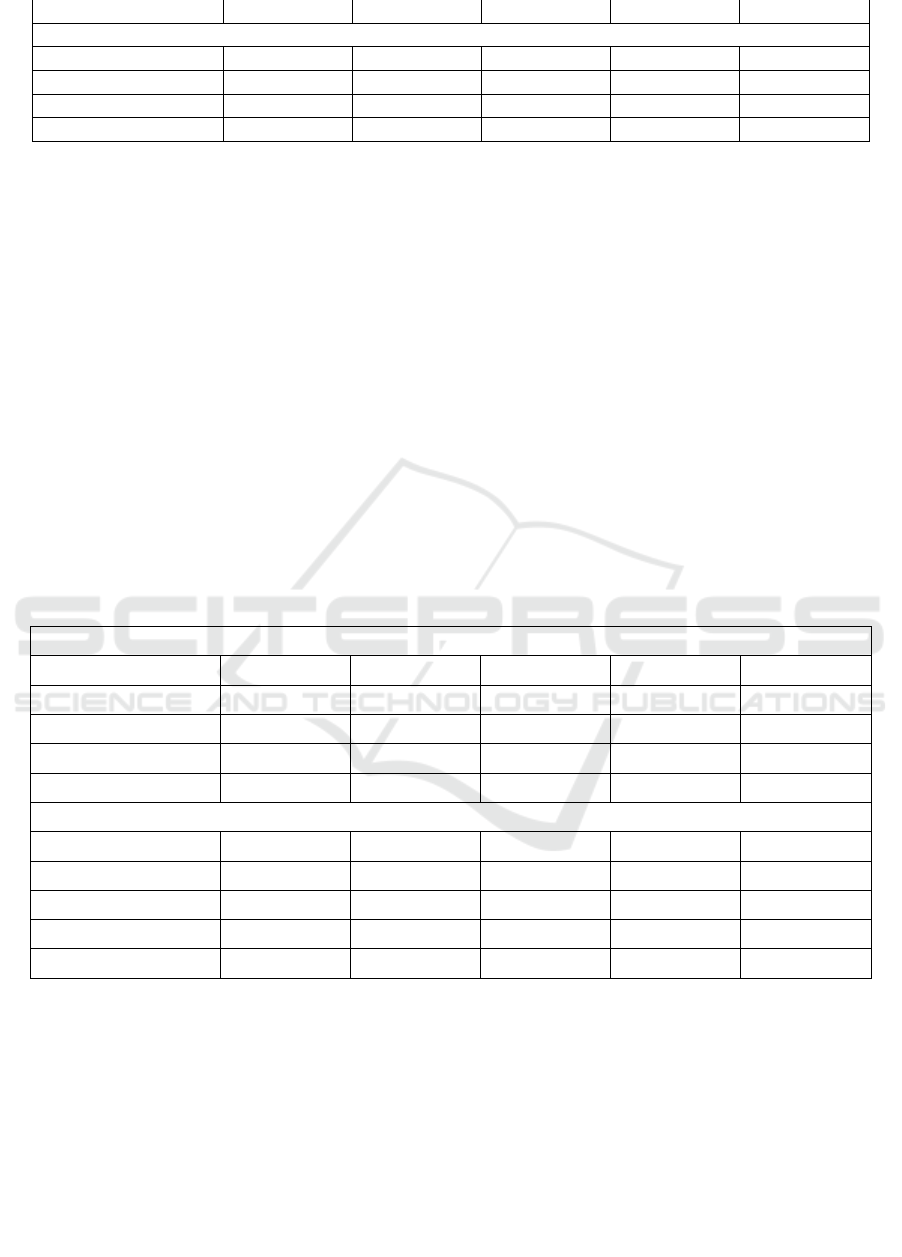
ROE 19.51% 12.63% 5.35% 24.95% 20.35%
Gree's profitability
Subject\Time 2021-09-30 2021-06-30 2021-03-31 2020-12-31 2020-09-30
Sales margin 11.36% 10.42% 10.40% 13.25% 10.96%
Gross profit margin 24.13% 23.74% 24.43% 26.14% 23.37%
ROE 15.02% 8.11% 2.95% 18.88% 11.74%
3.2 Solvency
Solvency can be analyzed in terms of current ratio,
quick ratio, equity ratio and asset-liability ratio
(Helfert, 2001). In the third quarter of 2021, Midea's
quick ratio (0.75) is more than 0.72 last year,
indicating that Midea has controllable short-term
debt risks. The current ratio of Midea (1.37) is more
than 1.33 last year, indicating that Midea's
short-term solvency was weak. Midea's
asset-liability ratio (65.91%) is more than 65.72%
last year, and the company's ratio of liabilities to
assets remained stable. Midea's cash ratio (35.55%)
is less than 37.35% last year, indicating that the
company's ability to pay cash immediately declined.
Compared with last year's third quarterly report,
Midea's solvency has strengthened.
Gree's quick ratio (0.83) is less than 1.15 last
year, indicating that Gree has controllable short-term
debt risks. Gree's current ratio (1.18) is more than
1.33 last year, indicating that the company's
liquidity was poor and its short-term solvency was
weak. Gree's asset-liability ratio (67.13%) is more
than 57.57% last year, indicating that the company's
financial risks have increased. Gree's cash ratio
(66.43%) is less than 85.43% last year, indicating
that the company's immediate cash payment ability
has declined significantly. Compared with last year,
Gree's debt solvency remained stable overall.
Midea's solvency increased year-on-year, while
Gree's solvency remained stable. Comparing and
analyzing the solvency indicators of Midea and Gree,
we can see that the current ratios of both are
relatively low, the short-term solvency is weak, and
the long-term solvency is comparabl
Table 3: The solvency of Midea and Gree.
Midea's solvency
Subject\Time 2021-09-30 2021-06-30 2021-03-31 2020-12-31 2020-09-30
Current ratio 1.37 1.32 1.32 1.31 1.33
Quick ratio 0.75 0.72 0.93 0.95 0.72
Equity ratio 2.09 2.27 2.08 2.01 2.04
Asset-liability ratio 65.91% 67.53% 66.31% 65.53% 65.72%
Gree's solvency
Subject\Time 2021-09-30 2021-06-30 2021-03-31 2020-12-31 2020-09-30
Current ratio 1.18 1.12 1.31 1.35 1.33
Quick ratio 0.83 0.87 1.01 1.05 1.15
Equity ratio 2.08 2.15 1.7 1.41 1.38
Asset-liability ratio 67.13% 67.93% 62.56% 58.14% 57.57%
3.3 Operational Capability
Midea's business cycle and turnover period are all
declining, implying that its turnover period is
shortened and its turnover capacity is stronger. The
operating cycle is the sum of the inventory turnover
period and the accounts receivable turnover period
(Fabozzi, 2003). In the third quarter of 2021,
Midea's business cycle was 68.87 days, down 5.86%
from the same period last year, because the
inventory turnover period and accounts receivable
turnover period decreased by 7.61% and 2.73%
respectively. In terms of days, the inventory turnover
period was 43.57 days, down 7.61% over the same
period last year, and the accounts receivable
turnover period was 25.29 days, down 2.73% over
the same period last year. The significant reduction
in inventory turnover period is the main reason for
the decline in the business cycle of enterprises.
Midea's current account receivable turnover rate was
10.68 times, more than 10.39 times last year,
Big Data Financial Analysis Comparison between Midea and Gree Based on Power BI Software
157
indicating that the company has improved the capital
utilization efficiency.
Midea's inventory turnover rate (6.20 times),
more than 5.72 times last year, implying that its
inventory realization ability has been enhanced.
Midea's current asset turnover rate was 1.05 times,
more than 0.94 times last year, indicating that the
company's current assets have been reasonably
utilized. Midea's total asset turnover rate (0.71
times), more than 0.66 times last year, indicating
that the company's comprehensive utilization of
assets has been optimized. All of Midea's operating
capacity indicators are improving, indicating that
Midea's operating capacity is stronger than the same
period last year.
In the third quarter of 2021, Gree's business
cycle was 105.54 days, an increase of 23.06% than
last year, mainly due to the longer inventory
turnover period. Gree's accounts receivable turnover
rate (14.58 times), more than 11.67 times last year,
indicating that the company's capital utilization
efficiency has been significantly improved. Gree's
inventory turnover rate (3.10 times), less than 4.31
time last year, indicating that Gree's product market
competitiveness has weakened. Gree's current asset
turnover rate (0.66 times), more than 0.61 times last
year, indicating that the company's current assets
were reasonably utilized. Gree's total asset turnover
rate (0.49 times) is more than 0.45 times last year,
indicating that the company has optimized the
comprehensive utilization of assets. Compared with
last year, Gree's operating capacity remained stable.
Comparing the indicators of Midea and Gree,
Midea's business cycle is 68 days, which is much
lower than Gree's 105 days. Midea's overall
operating capability is stronger than Gree's. The
advantage of Midea is that the inventory turnover is
fast, and the inventory turnover rate is twice that of
Gree. It should be noted that Gree's accounts
receivable turnover is faster. In order to optimize
their respective operating capabilities, Midea should
further speed up account turnover, and Gree should
further speed up inventory turnover.
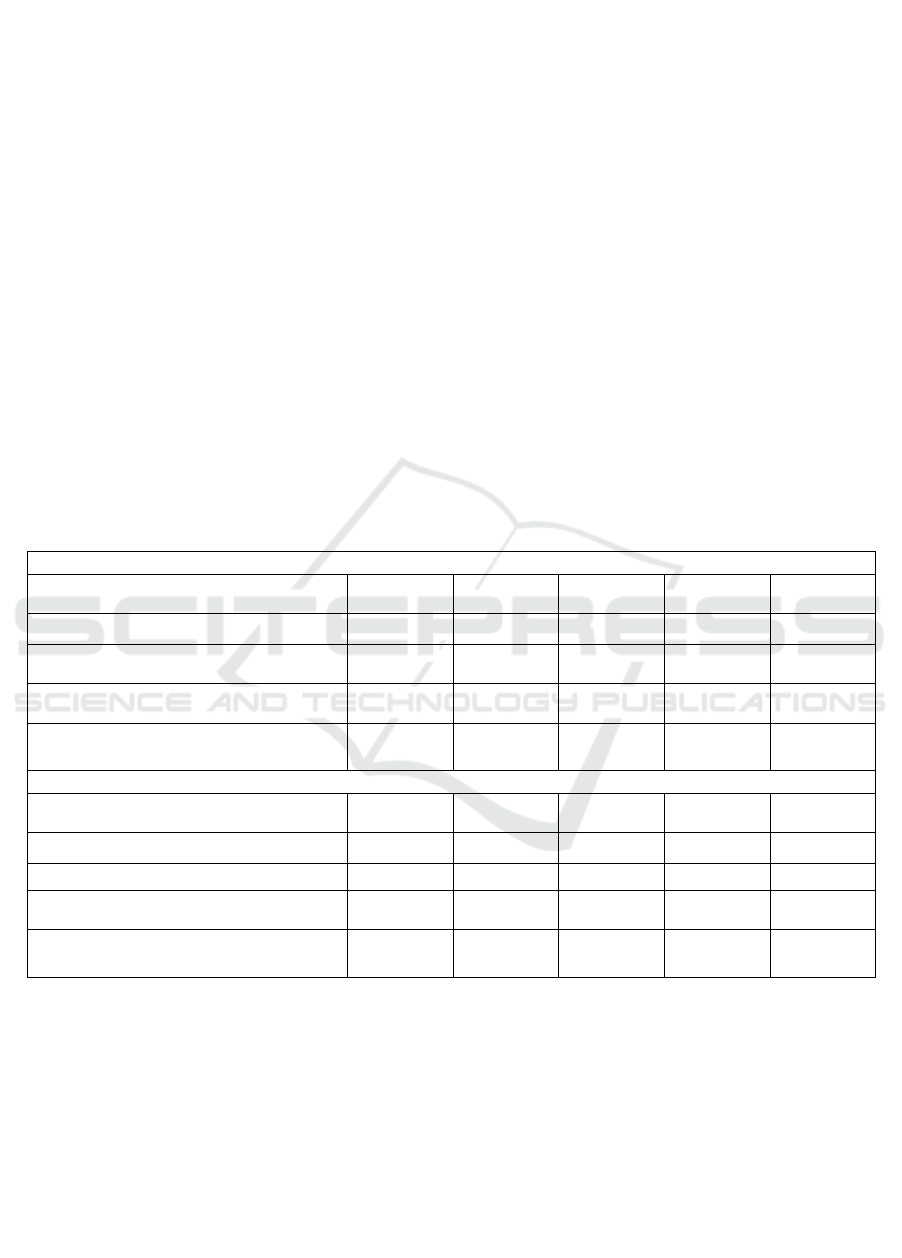
Table 4: Operational Capabilities of Midea and Gree.
Midea's O
p
erational Ca
p
abilit
y
Subject
\
Time 2021-09-30 2021-06-30 2021-03-31 2020-12-31 2020-09-30
Business cycle (days) 68.87 70.41 71.25 80.09 73.16
Inventory turnover rate (times) 6.2 4.07 2.03 6.7 5.73
Inventor
y
turnover da
y
s
(
da
y
s
)
43.57 44.23 44.32 53.72 47.16
Accounts receivable turnover days (days) 25.29 26.19 26.93 26.37 26
Gree's Operational Capabilit
y
Subject
\
Time 2021-09-30 2021-06-30 2021-03-31 2020-12-31 2020-09-30
Business cycle (days) 105.54 98.18 136.09 93.76 85.76
Inventory turnover rate (times) 3.1 2.29 0.83 4.78 4.31
Inventor
y
turnover da
y
s
(
da
y
s
)
87.02 78.55 109.06 75.29 62.63
Accounts receivable turnover days (days) 18.52 19.63 27.02 18.46 23.13
3.4 Growth Ability
This section analyzes Midea's growth ability. In the
third quarter of 2021, Midea's operating income
growth rate was 20.57%. The operating income
turned from loss to profit, compared with -1.88%
last year. Midea's operating profit growth rate was
4.64%. The profit growth rate resumed its upward
trend compared with -0.89% last year. The net profit
growth rate (6.53%) indicates that the company's net
profit growth rate has continued to grow, and the
growth potential needs to be strengthened. The
growth rate of Midea's total assets (4.43%), far less
than 16.06% last year, indicating that the company's
scale has slowed down expansion. Compared with
the same period last year, Midea 's growth ability
has been enhanced.
Gree's current operating income growth rate
(9.73%) indicates operating income turned from loss
to profit. Gree's operating profit growth rate
(13.70%) indicates the profit growth rate has entered
an upward channel. Gree's net profit growth rate
ICEMME 2022 - The International Conference on Economic Management and Model Engineering
158
(14.21%) indicates that the company's growth
potential has been restored. The growth rate of
Gree's total assets (2.46%) indicates that the
company's scale has begun to expand. Compared
with the same period last year, Gree's growth ability
has been strengthened.
2020 is the year of the outbreak of the
COVID-19, and the household appliance industry is
generally sluggish due to the impact of the epidemic.
In 2021, Midea and Gree perform well, and their
growth capabilities are constantly improving.
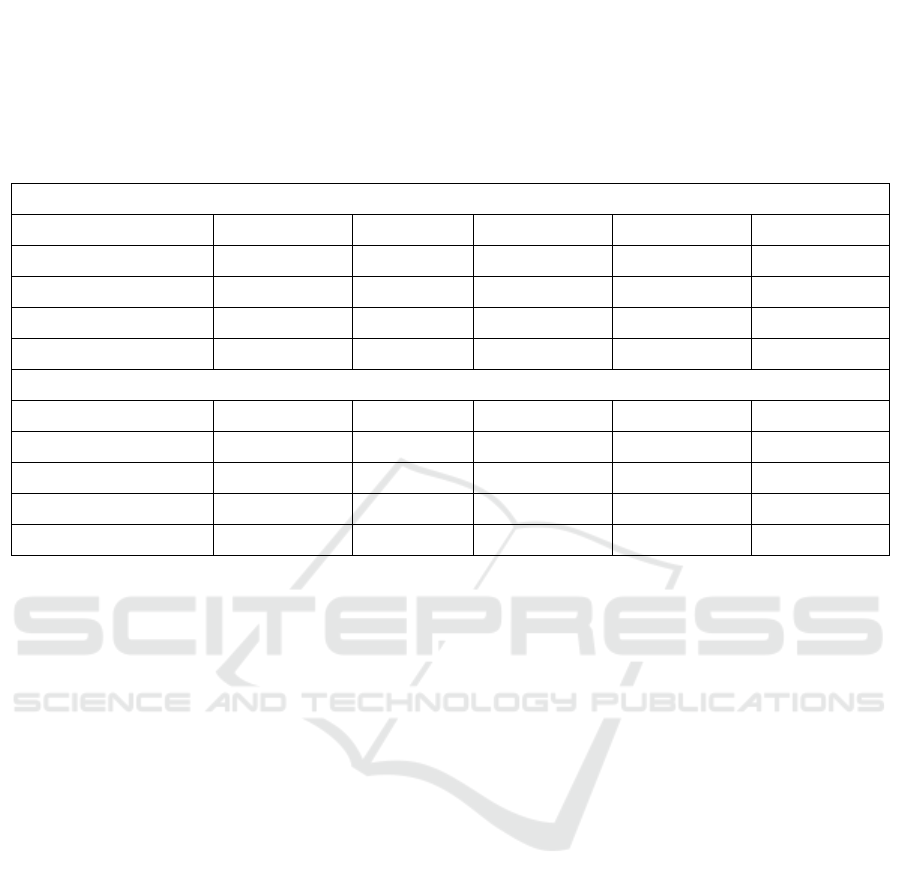
Table 5: Growth capabilities of Midea and Gree.
Midea 's growth abilit
y
Sub
j
ect
\
Time 2021-09-30 2021-06-30 2021-03-31 2020-12-31 2020-09-30
Net profit (yuan) 23455250000 1.501E+10 6468588000 27222969000 22018301000
Net profit growth rate 6.53% 7.76% 34.45% 12.44% 3.29%
O
p
eratin
g
income
(y
uan
)
2.62943E+11 1.748E+11 83017120000 2.8571E+11 2.17753E+11
Revenue growth rate 20.75% 25.14% 42.26% 2.27% -1.81%
Gree 's growth abilit
y
Sub
j
ect
\
Time 2021-09-30 2021-06-30 2021-03-31 2020-12-31 2020-09-30
Net profit (yuan) 1.564E+10 9.457E+09 3.443E+09 2.218E+10 1.37E+10
Net profit growth rate 14.21% 48.64% 120.98% -10.21% -38.06%
O
p
eratin
g
income
(y
uan
)
1.395E+11 9.201E+10 3.352E+10 1.705E+11 1.275E+11
Revenue growth rate 9.48% 30.32% 60.30% -14.97% -18.64%
4 CONCLUSIONS
Through the big data financial analysis of Midea and
Gree carried out by Power BI software, the paper
found that: Midea and Gree are both well-known
home appliance companies. Based on the above
analysis, Gree's commodity profitability is better
than Midea, and Midea's capital profitability is
better than Gree. Midea and Gree have relatively
weak short-term solvency and comparable long-term
solvency. Midea's overall operational capability is
stronger than Gree. Compared with last year, both
Midea and Gree have good growth capabilities.
ACKNOWLEDGEMENT
The thesis is the result of the Taishan University
Introduced Talents Scientific Research Start-up
Fund Project.
REFERENCES
AREAS, B., Financial analysis. Growth, 2018. 30: p. 10.
Fabozzi, F.J. and P.P. Peterson, Financial management
and analysis. Vol. 132. 2003: John Wiley & Sons.
Fan, J., F. Han and H. Liu, Challenges of big data analysis.
National science review, 2014. 1(2): p. 293-314.
Helfert, E.A. and E.A. Helfert, Financial analysis: tools
and techniques: a guide for managers. 2001:
McGraw-Hill New York.
Schroeder, R.G., M.W. Clark and J.M. Cathey, Financial
accounting theory and analysis: text and cases. 2019:
John Wiley & Sons.
Big Data Financial Analysis Comparison between Midea and Gree Based on Power BI Software
159
