
Analysis of China's Textile Printing and Dyeing Industry Based on
the Input-Output Method
Qian Yang
†
, Rutao Zhou
‡
and Yaxin Lu
*
Business School Beijing Institute of Fashion Technology, Beijing, China
*
sxylyx@bift.edu.cn
Keywords: Textile Printing and Dyeing Industry, Input-Output Method, Industry Affiliation, Industrial Ripple Effects.
Abstract: The textile printing and dyeing industry is an important part of the textile industry chain. The industry is
linked upstream to production materials such as spinning and weaving, and downstream to finished products
such as garments and home textiles. In 2021, in the face of complex and changeable domestic and foreign
situations and various risks and challenges, China's printing and dyeing enterprises will actively adjust their
development strategies. The output of printing and dyeing cloth has maintained a good growth trend. The
export scale of main products will be further expanded than before the epidemic, and major economic
indicators will continue to recover, the level of corporate profitability has improved significantly. Therefore,
it is particularly important to study the current development of the textile dyeing and printing industry in
China. In this paper, macroeconomic data are processed for "China's input-output table in 2018". The input-
output model is used to study the textile printing and dyeing industry. From the perspective of industrial
linkages and industrial fluctuation effects, the authors explore the relationship between China's textile printing
and dyeing industry and other industrial sectors of the national economy. Through the measurement of six
related indices, the analysis concludes that the textile printing and dyeing industry is a raw material-based
industrial sector with low value-added characteristics. The results of the study indicate that the textile printing
and dyeing industry has a strong pulling and driving effect on China's economy, and its contribution to social
employment is at an intermediate level.
1 INTRODUCTION
The textile printing and dyeing industry is an
important part of the textile industry, for clothing,
home textiles, technical textiles, and other
downstream industries to provide important technical
support, to meet the new consumer demand for textile
products, leading the new trend of green fashion to
provide important protection. Although the
transformation and upgrading of the textile printing
and dyeing industry have achieved remarkable results
in recent years, there are still many problems that
attract attention. This paper will explore the current
situation and development of the textile printing and
dyeing industry from the perspective of input and
output for the first time. The paper will mainly
measure and analyze the complete consumption
coefficient, intermediate demand rate, intermediate
input rate, impact coefficient, inductivity coefficient,
*
Corresponding author
and complete employment contribution model, and
finally come up with more practical suggestions for
development.
2 OVERVIEW OF TEXTILE
PRINTING AND DYEING
INDUSTRY
In recent years, the transformation and upgrading of
the textile printing and dyeing industry have been
promoted in-depth, the level of innovation has been
steadily improved, green development has achieved
excellent results, and the industry has further
developed towards the goal of high quality. the
printing and dyeing industry has been running
smoothly overall between 2015 and 2019, with
indicators such as scale and efficiency remaining
168
Yang, Q., Zhou, R. and Lu, Y.
Analysis of China’s Textile Printing and Dyeing Industry Based on the Input-Output Method.
DOI: 10.5220/0012027500003620
In Proceedings of the 4th International Conference on Economic Management and Model Engineering (ICEMME 2022), pages 168-173
ISBN: 978-989-758-636-1
Copyright
c
2023 by SCITEPRESS – Science and Technology Publications, Lda. Under CC license (CC BY-NC-ND 4.0)

within a reasonable range. The output of printing and
dyeing fabric of enterprises above the scale increased
by 1.4% annually, the sales profit margin increased
from 5.2% to 5.6%, the export quantity of eight major
products of textile printing and dyeing increased by
6.8% annually, and the export value increased by
3.0% annually. 2020, the operating income of
enterprises above the scale of the textile printing and
dyeing industry was 254.13 billion yuan, and the total
profit was 12.67 billion yuan, the operating income
accounted for 5.6% of the whole textile industry.
5.6%. 2021 green laws and regulations are
implemented to make sustainable development more
important, and enterprises in the industry increase
energy saving and emission reduction.
In this paper, according to the National Economic
Classification of Industries (GB/T 4754-2017), the
main products of the printing and dyeing industry
include cotton textile and dyeing finishing (C171),
wool textile and dyeing finishing (C172), hemp textile
and dyeing finishing (C173), silk and silk textile and
dyeing finishing (C174), chemical fiber weaving and
dyeing finishing (C175). In the "2018 Input-Output
Table" the textile industry is subdivided into 8
categories, and since only two of the 8 categories in
aggregate fall within the scope defined in this paper,
the data explored in this paper are taken only from the
2 categories in aggregate for cotton, chemical fiber
textile and printing, and dyeing finishing products and
wool textile and dyeing and finishing products. The
following section will analyze the current situation of
the industry development through the input-output
method, to put forward reasonable suggestions in a
more scientific and targeted manner.
3 TEXTILE PRINTING AND
DYEING INDUSTRY INPUT
AND OUTPUT INDICATOR
CONSTRUCTION
The data in this paper use the Input-Output Tables
2018 published by the National Bureau of Statistics,
in which 153 national economic sectors are published.
To be able to study the relationship between the sector
and other industries more clearly, this paper
collectively integrates 153 subdivision categories into
92 major categories according to the National
Economic Classification of Industries (GB/T 4754-
2017), according to which subsequent studies will be
more integrated output table for measurement.
3.1 Industry Linkages Analysis of
Indicators
Equation 1 to Equation 5 are calculated using Lu A et
al (Lu, 2013). The equations are as follows.
𝑏
denotes the coefficient of complete consumption.
𝑎
denotes the coefficient of complete consumption.
∑
𝑏
𝑎
is the indirect consumption
coefficient, which indicates the total indirect
consumption of product i buy production unit j formed
by k intermediate products.
𝑏
=𝑎
+
∑
𝑏
𝑎
(𝑖,𝑗 = 1,2,⋯,𝑛)
(1)
𝐺
denotes the intermediate demand rate for
industry sector i.
∑
𝑥
denotes the sum of the
intermediate demand for the product of industry sector
i by each industry sector.
∑
𝑥
+𝑌
denotes
the total output of products in industry sector i.
𝐺
=
∑
∑
(𝑖,𝑗 = 1,2,…,𝑛) (2)
𝐹
denotes the intermediate input rate of industry
sector j.
𝐷
denotes the full depreciation cost of
industrial sector j (1 year).
𝑁
denotes the value
created by industrial sector j.
𝐹
=
∑
∑
(𝑖,𝑗 = 1,2,…,𝑛)
(3)
3.2 Industry Wave Analysis Indicators
Inductance Coefficient is the degree of ripple effect of
production demand on various sectors of the national
economy when a unit of final product is added to the
textile printing and dyeing industry. 𝑒
is the
Inductance Coefficient of industry j; 𝐶
is the
number in the Leontief inverse matrix table; i and j are
the rows and columns in the input-output table
respectively; n is the total number of sectors in the
input-output table.
𝑒
=
∑
∑∑
(𝑖,𝑗 = 1,2,…,𝑛) (4)
𝑒
is the Reaction Coefficient of industry i; i and
j are the rows and columns in the input-output table; n
is the number of industrial sectors in the input-output
table; and 𝐶
is the element in the Leontief inverse
matrix table C.
𝑒
=
∑
∑∑
(𝑖,𝑗 = 1,2,…,𝑛) (5)
In this paper, we use the employment contribution
model of Yin F C et al (Yin, 2010), where the
compensation received by workers is used to explore
the contribution of the industry to society. 𝐷𝐿
=
Analysis of China’s Textile Printing and Dyeing Industry Based on the Input-Output Method
169

(𝑖 = 1,2,⋯,𝑛) , 𝐷𝐿
represents the direct
employment contribution. Its economic significance
indicates the direct employment generated by sector i
for the national economy. 𝑊
denotes the total
remuneration received by workers in sector i. The total
input in sector i is 𝑋
. H is a matrix consisting of ℎ
,
ℎ
represents the ratio of the quantity of sector i's
output that is used as intermediate goods by sector j to
the total output of sector i. GL indicates the full
contribution to employment.
𝐺𝐿 = (1 − 𝐻)
⋅𝐷𝐿
(6)
4 EMPIRICAL ANALYSIS
4.1 Linkage Analysis of the Textile
Printing and Dyeing Industry
4.1.1 Complete Consumption Factor
The top 5 coefficients of complete consumption in the
textile printing and dyeing industry, calculated
according to formula 1, as published in Table 1. The
textile printing and dyeing industry has the highest
coefficient of complete consumption at 0.51, which
shows that the restructuring of the industry needs to
start from its own internal structure and develop in a
coordinated manner between industries. The next
industries in the complete consumption coefficient
table are agriculture (0.28), chemical raw material and
chemical product manufacturing (0.19) and chemical
fibre manufacturing (0.19), which indicates that the
textile dyeing and printing industry is more dependent
on these industries. It is therefore possible to focus on
developing and structuring the primary and secondary
industrial chains to create a linkage and optimistic
effect.
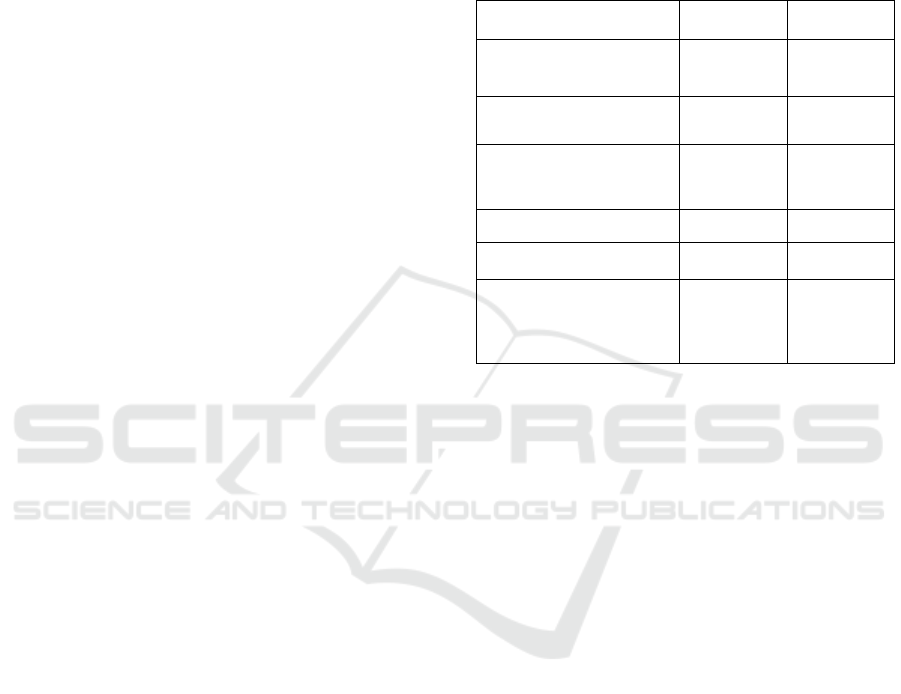
Table 1: Complete consumption factor (partial).
NO. Industry
Textile printing
and dyeing
industry
1
Textile printing and dyeing
industry
0.514241
2 Agriculture 0.278538
3
Chemical raw materials and
chemical products
manufacturing
0.19458
4 Chemical fiber manufacturing 0.187906
5
Agriculture, forestry, animal
husbandry, and fishery services
0.088117
4.1.2 Intermediate Demand Rate and
Intermediate Input Rate
For reasons of space, only the relevant indices for the
relevant sub-sectors of the textile industry are
disclosed in this article. The intermediate demand rate
for the textile printing and dyeing industry, calculated
according to formula 2, is 0.92, ranking 9th out of all
industries with an intermediate demand rate of less
than 1, indicating that more of the textile printing and
dyeing industry's products are used in the production
of other sectors. It is thus clear that the textile printing
and dyeing industry is a sector with the nature of a raw
material industry. At present, the export market share
of textile printing and dyeing products in the world
remains basically stable, and the industry should speed
up the transformation from a quantitative scale to a
quality and efficiency one.
Table 2: Intermediate demand and intermediate input
indicators (partial).
Industry
Intermediate
demand rate
Intermedia
te input
rate
Textile printing and
dyeing industry
0.925838 0.823406
Hemp, silk, and silk
textiles and processed
products
0.962609 0.803244
Knitting or crochet and
its products
0.619587 0.865804
Textile finished products 0.442756 0.818988
Leather, fur, feathers,
and their products and
footwear industry
0.426331 0.801408
Textile clothing apparel 0.416231 0.824878
Using formula 3, the textile printing and dyeing
industry (0.82) is ranked 5th out of 92 industry sectors,
which is a relatively high ranking and represents a low
value added rate for the industry. This leads to the
conclusion that the textile printing and dyeing industry
should optimize its product structure, improve its
ability to supply high quality products and enhance its
product value and market control.
4.1.3 Summary
According to the results of the above empirical
analysis, it is indicated that although the textile
printing and dyeing industry has a closer relationship
with other industries, this dependency is much smaller
than its dependency with its own industry. This
ICEMME 2022 - The International Conference on Economic Management and Model Engineering
170
reveals that we should strengthen the optimization and
upgrading within the industry, extend the industrial
chain and help deepen the coordinated development
with other industrial sectors. The intermediate demand
rate of textile printing and dyeing industry is in the
middle and upstream position, because the textile
printing and dyeing industry has certain characteristics
of raw material industry sector, often as raw materials
into other industrial sectors industry chain. China's
textile printing and dyeing industry is still in the stage
of low value-added, but the textile printing and dyeing
industry wants to break the low value-added situation
needs to face a huge transformation challenge.
4.2 Empirical Analysis of the Ripple
Effect of Textile Printing and
Dyeing Industry
4.2.1 Reaction Coefficient and Inductance
Coefficient
The textile dyeing and printing industry has an impact
factor of 1.246402, ranking 16th out of the 92 industry
sectors studied. This indicates that the industry has a
higher influence on other industrial sectors than the
social average (the social average is 1) and has a
greater pull on the economy. Textile printing and
dyeing are in the middle of the textile industry chain
structure, the upstream of which is dominated by
weaving fabric, dyestuff, and dyeing auxiliaries, while
the downstream is concentrated in apparel, home
textile, and auto textile fields. China is the world's
largest producer and exporter of textiles and garments,
of which the demand for raw materials is also large. In
2021, in the face of complex and changing domestic
and international situations and various risk
challenges, China's printing and dyeing enterprises
actively adjusted their development strategies,
printing and dyeing fabric production maintained a
good growth trend. This background makes the textile
printing and dyeing industry also has an important
influence in China.
The inductivity coefficient of the textile printing
and dyeing industry is 1.898089, which is higher than
the social average level of 1 and ranks 11th. The
degree of sensitivity to the demand for economic
development is greater, so the industry has a pillar role
in the industrial sector of the national economy and
has a greater role in promoting the development of the
national economy. From the results of the coefficient
of complete consumption, we can analyze that the
industries such as agriculture, chemical fiber
manufacturing, and self-consumption within the
industry account for a larger proportion of the demand
for textile printing and dyeing. These industries
account for a relatively large share of GDP, so their
consumption is also large, which laterally explains the
large inductivity coefficient of the textile printing and
dyeing industry.
Table 3: Reaction Coefficient and Influence Coefficient
(partial).
Industry
Reaction
Coefficient
Influence
Coefficient
Textile printing and dyeing
industry
1.898089 1.246402
Hemp, silk, and silk textiles
and processed products
0.572981 1.145388
Knitting or crochet and its
products
0.503255 1.411436
Textile finished products 0.481902 1.339618
Textile clothing apparel 0.776402 1.350662
Leather, fur, feathers, and
their products and footwear
industry
0.6166 1.264972
4.3 Full Employment Contribution
Rate
In our study of the compensation of labor in the textile
industry in the input-output table over the years, we
found that the overall compensation of labor in the
textile industry declined from 2015 onwards. The
study found that the decline in overall labor
compensation against the backdrop of a gradual rise in
labor wages indicates that the number of workers is
shrinking. According to the China Printing and
Dyeing Industry Association, the construction of
intelligent production lines has achieved obvious
results. The construction of intelligent workshops has
reduced the number of employees, helped solve the
problem of large-scale personalization, and enabled
further optimization of production efficiency and
quality.
Analysis of China’s Textile Printing and Dyeing Industry Based on the Input-Output Method
171
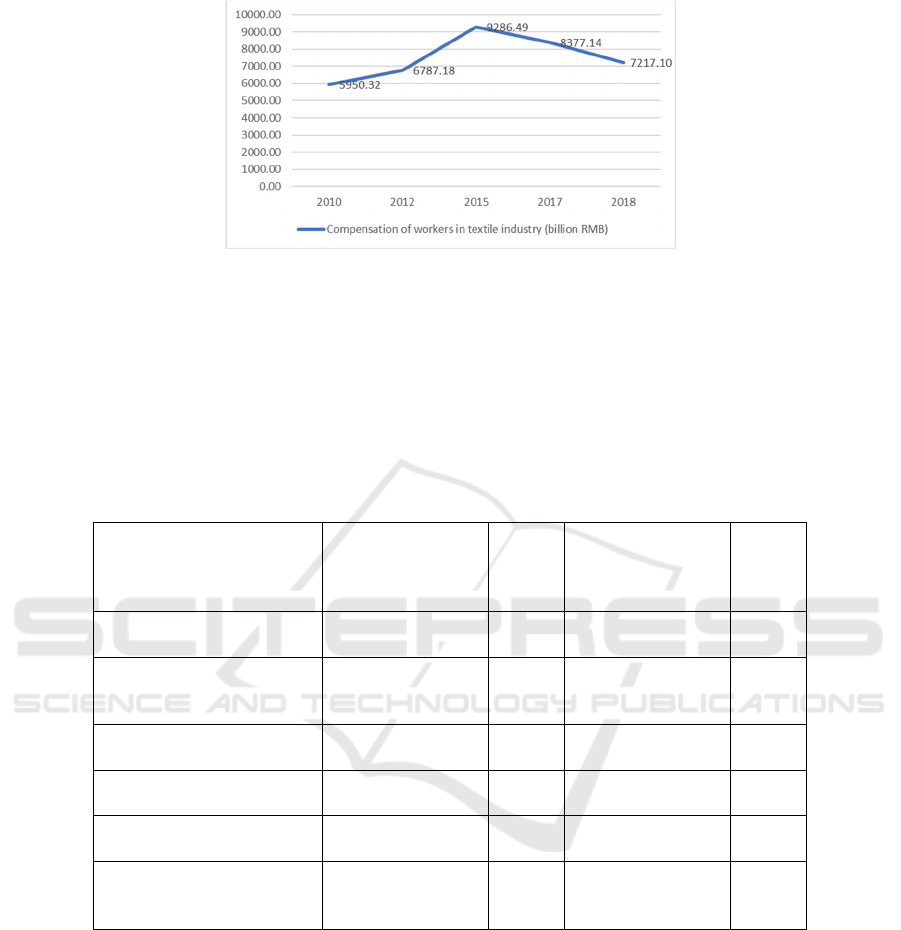
Figure 1: Summary of labor compensation in the textile industry in the input-output table over the years.
The full employment contribution coefficient of
the textile printing and dyeing industry ranks 69th out
of 92 national economy industries, and the overall
employment contribution to society is at an
intermediate level. The coefficient indicates that when
the textile and dyeing industry invests RMB10,000,
the contribution to the employment of society will
increase by 0.4287. The overall trend of labor
compensation in the textile industry is decreasing.
This is mainly related to the digital development of the
industry, which makes high-tech equipment replace
the previous low labor force gradually become the
main production force.
Table 4: Employment contribution of the main sectors of the textile industry.
Contribution rate index
Direct employment
contribution rate
NO.
Full employment
contribution rate
NO.
Textile printing and dyeing
industry
0.0954 69 0.4287 57
Hemp, silk and silk textiles and
processed products
0.0830 78 0.4295 56
Textile clothing apparel 0.1180 61 0.3230 80
Textile finished products 0.1084 65 0.3129 81
Knitting or crochet and its
products
0.0763 69 0.2735 85
Leather, fur, feathers and their
products and footwear industry
0.1155 62 0.2423 86
5 CONCLUSIONS
The intermediate input rate and intermediate demand
rate of textile printing and dyeing industry are greater
than 0.5, so it belongs to the intermediate product
secto
r (Ning, 2004). Generally speaking, the higher
the intermediate input rate is, the lower its added value
is. From the value point of view, China's textile
printing and dyeing industry is still in the stage of low
added value. From the Reaction Coefficient and
Influence Coefficient, it has strong pulling and driving
characteristics to economic growth. From the
measurement result of employment contribution rate,
the full employment contribution rate of textile
printing and dyeing industry is in the middle and lower
status quo.
It can be concluded that the textile printing and
dyeing industry is a major pillar industry in China, and
its ripple effect on various sectors is more obvious.
Although the textile printing and dyeing industry has
a closer relationship with other industries, this
dependency is much smaller than its dependency with
ICEMME 2022 - The International Conference on Economic Management and Model Engineering
172

its own industry. This reveals that we should
strengthen the optimization and upgrading within the
industry, extend the industrial chain and help deepen
the coordinated development with other industrial
sectors (Li, 2018).
In the future, the government can build innovative
production parks to promote the effective connection
between the upper and lower industrial chains of the
printing and dyeing industry. And they take the lead in
providing an exchange platform for enterprises and
universities to promote the rate of transformation of
the results of technological research and development
of universities and broaden the access of enterprises to
high technology. Enterprises should increase
investment in technology research and development to
set up special funds to encourage technological
innovation of R&D personnel. The product side
through sufficient preliminary market research, clear
user portrait and consumer needs, targeted product
design and accurate market segmentation, timely
grasp of consumer needs and preferences. Promote the
quality and efficiency of the industry to achieve
industrial value chain upgrading.
ACKNOWLEDGMENT
Support by: Postgraduate Thesis Project of Beijing
Institute of Fashion Technology (Project No.:
110501990112).
REFERENCES
Li M. J. Lu A., Study on the development of textile
manufacturing industry in Zhejiang Province based on
input-output analysis. [J]. Wool Textile Journal, March
2018, pp 79-84.
Lu A. Hao S L., Clothing industry histology, [M]. Beijing:
People's Publishing House, March 2013.
Ning J., Economics of the apparel industry. [M]. China
Textile & Apparel Press, January 2004.
Yin F. C. Wang Y C., Huang J Y., Research on employment
pulling effect based on input-output employment
contribution model [J]. Statistics and Decision, April
2010, pp 108-110.
Analysis of China’s Textile Printing and Dyeing Industry Based on the Input-Output Method
173
