
Option Pricing and Delta Hedging for Moderna Inc. on Different
Models
Wuyu Wei
Department of Statistical Sciences University of Toronto, Toronto, Canada
Keywords: Delta Hedging, Black-Scholes Model, Binomial Model, Calibration, Option Pricing.
Abstract: The aim of this paper is to compare the performance of the same delta hedging strategies using three different
models in the process of pricing options for Moderna Inc., which has reference value for investors to compare
such models and build their hedging portfolios. Historical volatility is estimated from past open prices and
two implied volatilities are calibrated utilizing the selected 10 options on the Moderna Inc.’s stock. Then the
delta hedging strategy using three different models with volatilities above, containing one unit of a specific
option with different maturity and delta shares of the stock, is applied to obtain daily profit/loss. Finally, the
trends of daily gain/loss for such three models are visualized compared with the trends without hedging. To
conclude, the hedging strategy performs all well for the three models. This results in this study benefits
investors and researchers in choosing the relatively suitable option pricing model and the best-fit hedging
strategy for specific companies or sectors.
1 INTRODUCTION
Option pricing has been a focus of mathematical
research in finance since the publication of the Black-
Scholes formula in 1973 (Davis, 1993). Basically, it
provides an evaluation of an option’s value, which
would be involved into investors’ strategies. Options
are used for hedging and speculation (Amir, 2018).
Hedging is a term used nowadays primarily in
conjunction with financial markets (Rata, 2009),
which refers to the entrepreneur’s financial strategy of
mitigating market price risks through selling or
buying futures contracts for the commodity that is the
object of his activity (Rata, 2009). Hedging strategies
limit the losses to a great extent and meanwhile,
provide a flexible price mechanism. In recent years,
hedging with options, no matter what kind of options,
has been a crucial part in mathematical finance and
widely used. The related topics have been
continuously studied.
To demonstrate, on the one hand, researchers have
improved classical model and hedging strategy to fit
them better in realistic situations. First, based on the
exist theory under the model without considering
liquidity, Gueant, Olivier, and J. Pu modeled a new
framework which considers stochastic optimal control
to price and hedge a call option with execution costs
and market impact (Gueant, 2017). Also, to improve
delta hedging for options, Hull, J., and A. White
determined empirically a model for minimizing the
variance of changes in the value of a trader’s position
(Hull, 2017). Moreover, Ye, M., et al. improved
Black-Scholes model for crop price insurance
premium (Ye, 2017). Also, Imaki et al. proposed a
new neural network to facilitate fast training and
accurate optimal hedging strategies. In addition, Kim
et al. extended binomial model in two ways,
developed the one with time-dependent parameters
and derived a hedging strategy for a trinomial model
(Kim, 2017).
On the other hand, there are also some scholars
who try to test the performance of different models for
specific companies or fields, or for different kind of
options. Lassance, Nathan and Vrins, Frederic
compared the hedging ability of several popular
models on the Apple stock (Lassance, 2017). Also,
Doffou tested three parametric models in pricing and
hedging higher-order moment swaps (Doffou, 2019).
Besides, Bollin and Lepaczuk explored the
performance of several option pricing models in
hedging the exotic options (Bollin, 2020)
To sum up, this topic is of interest to the
researchers in the financial field. This paper also
focuses on this topic and two main parts are included
in the entire study. First, the three volatilities are
Wei, W.
Option Pricing and Delta Hedging for Moderna Inc. on Different Models.
DOI: 10.5220/0012033700003620
In Proceedings of the 4th International Conference on Economic Management and Model Engineering (ICEMME 2022), pages 401-406
ISBN: 978-989-758-636-1
Copyright
c
2023 by SCITEPRESS – Science and Technology Publications, Lda. Under CC license (CC BY-NC-ND 4.0)
401

calibrated. In detail, one historical volatility is
estimated by historical stock open prices, and the
Black-Scholes model as well as Binomial model are
applied to calibrate the other two implied volatilities
by minimizing the SSE. Then, the same delta hedging
strategy using Black-Scholes model and Binomial
model is applied to a specific option. Moreover, the
replicate processes display the daily profits/losses
with hedging and without hedging in three different
models, which are visualized to compare. As a result,
the hedging strategies are successful utilized on the
three calibrated models and all perform well, while the
gain/loss gap between BSM and Binomial model is
quite large.
This paper is structured as follows. Section 2
shows the data and methods. In Section 3, the results
are displayed, and Section 4 refers to the conclusion
of this paper.
2 DATA AND METHODS
2.1 Data
Moderna Inc. are chosen to be the target company
because it delivered a strong first quarter performance
and had a tremendous financial performance
throughout the past years. Besides, the Moderna
vaccines has been broadly used by many countries to
prevent Covid-19, and recently, the Moderna Covid-
19 vaccine was authorized by FDA for children down
to 6 months of age, which makes the Moderna stock
trending higher. Thus, the company’s stock and
underlying options are worth studying.
The data used is all extracted from the Yahoo
Finance (https://ca.finance.yahoo.com). Five call
options and five put options on Moderna Inc. are
chosen with a same maturity date, July 15th, but
different strike prices to calibrate two implied
volatilities for the stock using two different models.
The data is around the current price at the day when
the data was selected to prevent the edge cases of
volatility smile from the calibrated results. Besides,
the historical stock open prices are collected from
March 21st, 2022, to June 22nd, 2022, to estimate a
historical volatility. Then, a Delta hedging strategy is
constructed for another new option, whose maturity is
July 29th, 2022, from June 23rd, 2022, to July 7th,
2022, using the three different volatilities and
corresponding models. In details, options contracts
that are selected to calibrate the implied volatility for
Moderna Inc., followed by their strike prices, are
shown below in the table 1 below.
Table 1: The 10 options selected for the calibration.
Call options chosen for
calibration
Strick
p
rices
MRNA220715C00165000 165
MRNA220715C00170000 170
MRNA220715C00175000 175
MRNA220715C00180000 180
MRNA220715C00185000 185
Put options chosen for
calibration
Strick
p
rices
MRNA220715P00160000 160
MRNA220715P00165000 165
MRNA220715P00170000 170
MRNA220715P00175000 175
MRNA220715P00180000 180
And the option contract which is used in the
hedging section is shown in the table 2 below.
Table 2. The option chosen for hedging
O
p
tion chosen for hed
g
in
g
Moderna Inc. MRNA220729P00135000
Furthermore, the historical stock open price trends
for Moderna Inc. ‘s are shown in the figure below.
Figure 1: The stock price trend for Moderna Inc.
As shown above, Moderna Inc. ‘s stock open price
has increased dramatically from June 30th to July 7th
from $143.4 to $159.5, while prior to that, the prices
fluctuated around $143. It is interesting to find that the
slopes during the increasing prior are almost same.
2.2 Method
To begin with, the Black-Scholes model and Binomial
model are two of the most important concepts which
are widely applied in modern finance to solve the
option pricing problems, and each has its own pros
and cons. Thus, they have been compared to judge
which one is better. On the one hand, the 5 inputs: the
strike price, the current stock price, the time to
maturity, the risk-free rate and the volatility are taken
into account by the Black-Scholes model, and it will
return the numerical result based on these arguments,
140
150
160
170
180
6/23/22 6/28/22 7/3/22 7/8/22 7/13/22
Moderna Inc.
ICEMME 2022 - The International Conference on Economic Management and Model Engineering
402

while the multiple-stage Binomial model can show a
binomial tree structure with options and their
possibilities. On the other hand, the Black-Scholes
model can be only applied to European options but not
American options, but the Binomial model is able to
utilize multiple periods to value American options.
Besides, the assumption of the Black-Scholes model
is that the returns of the underlying asset are normal
distributed.
In this study, the process can be divided into two
parts. First one historical and two implied volatilities
of the stock are calibrated using three different
methods. In details, the historical volatility is
approximated by the standard deviation of the natural
log of the ratio of consecutive past stock open prices
from the assumption that the stock follows the Black-
Scholes model.
𝑉𝑎𝑟log𝑆
(
𝑡
)
−log𝑆
(
𝑡
)
=
(
𝑡
−𝑡
)
𝜎
(1)
Then the Black-Scholes model and Binomial
model are used to calculate theoretical prices of the
selected 5 call and 5 put options. The calculated prices
are compared with the real market prices to calibrate
the implied volatilities by minimizing the SSE. For
the Black-Scholes model, initially, the stock price, the
price, the strike price, the maturity date for 5 call and
5 put options on the stock are collected from June
27th, 2022, to July 6th, 2022. The Black-Scholes
option prices are calculated using Black-Scholes
model with the formula below, where 𝜎 represents to
the implied volatility, t represents time to maturity,
S(t) represents to the stock price at time t, K represents
to the strike prices of the option, r is the risk-free rate,
which is 2.8% in annual term obtained from the
Federal Reserve. The call option price and put option
price are calculated by equation (2) and (3)
respectively, where N represents the standard normal
distribution.
𝐶𝑡,𝑆
(
𝑡
)
=𝑆
(
𝑡
)
𝑁
(
𝑑
)
−𝐾𝑒
𝑁
(
𝑑
)
(2)
𝑃𝑡,𝑆
(
𝑡
)
=𝐾𝑒
𝑁
(
−𝑑
)
−𝑆
(
𝑡
)
𝑁(−𝑑
)
(3)
𝑑
=
1
σ
√
(𝑡)
ln
𝑆
(
𝑡
)
𝐾
+𝑟+
σ
2
𝑡
(4)
𝑑
=
1
σ
√
(t)
ln
𝑆
(
𝑡
)
𝐾
+𝑟−
σ
2
𝑡
=𝑑
−σ
√
t
(5)
Moreover, one-step Binomial model is
constructed to calculate the option price as well, and
the same calibration approach is applied in the
Binomial model by minimizing the SSE of calculated
option prices. For the Binomial model, up and down
factors, which are represented by u and d respectively,
are needed in the formula. The general Binomial
model formula is shown below, where T represents to
the time to maturity, p represents the possibility to
move up, n represents to the number of time steps of
binomial trees. The equation (7) calculate the option
price and it is interesting to notice that call and put
options use the same formula.
𝑆
=𝑒
[
𝑆
𝑢×𝑝+𝑆
𝑑×
(
1−𝑝
)
]
(6)
𝑐
=𝑒
[
𝑓
×𝑝+
𝑓
×
(
1−𝑝
)
]
(7)
𝑢=𝑒
√
∆
,𝑑=
1
𝑢
,𝑝=
𝑒
−𝑑
𝑢−𝑑
,∆𝑡
=𝑇/𝑛
(8)
After the theoretical option prices are calculated
from the two models. The sum of percentage squared
errors between the calculated option prices and real-
market prices is calculated for every option on every
day from June 27th, 2022, to July 6th, 2022, except
for some losing data, shown in the equation (9), where
𝑝
represents the calculated option and 𝑝
represents
the real-market prices. Then the SSE is minimized to
calibrate the final implied volatility. And this process
is repeated for both models.
SSE=
(𝑝
−𝑝
)
𝑝
(9)
At the end of the calibration section, the three
different volatilities and the corresponding methods
are compared. Since the similar amount of data for
calculated option price, SSE from two methods for
implied volatility can be compared as well.
After the calibration of the historical and implied
volatilities, a Delta hedging strategy is applied for a
new selected option on the same stock, which has a
further maturity on July 29th, 2022. Its strike price is
$135. The Black-Scholes models for both historical
volatility and implied volatility follow the same
strategy but with different sigma value. The price of
the option is calculated using the Black-Scholes
model with the parameters and calibrated volatility
provided above. The portfolio contains one unit of call
option contract, and ∆
shares of stock, where ∆
is
equal to 𝑁(𝑑
) for call option. Thus, the following
formula can be applied to calculate the portfolio value
at time t, the profit or loss with hedging as well as
profit/loss without hedging can be calculated every
day from June 23rd, 2022, to July 7th, 2022.
Day 1:
𝑋(𝑡)=𝐶(0)
(10)
Option Pricing and Delta Hedging for Moderna Inc. on Different Models
403

Day 2-10:
𝑋
(
𝑡
)
=𝑋
(
𝑡−1
)
+∆
(𝑆
(
𝑡
)
−𝑆
(
𝑡−1
)
)
(11)
𝐿𝑜𝑠𝑠 𝑤𝑖𝑡ℎ𝑜𝑢𝑡 ℎ𝑒𝑑𝑔𝑖𝑛𝑔(𝑡)
=𝑆
(
𝑡
)
−𝐾−𝐶(0)
(12)
𝐿𝑜𝑠𝑠 𝑤𝑖𝑡ℎ ℎ𝑒𝑑𝑔𝑖𝑛𝑔(𝑡)
= 𝑆
(
𝑡
)
−𝐾−𝑋(𝑡)
(13)
Besides, for the one-step Binomial model, the
strike price, stock price from June 23rd, 2022, to July
7th, 2022, upper factor, down factor, and the
possibility to move up are collected and computed.
The option prices are composed from the formula
below.
𝐻𝑒𝑑𝑔𝑒 𝑅𝑎𝑡𝑖𝑜=
𝐶
−𝐶
𝑢𝑆 − 𝑑𝑆
(14)
𝐶
=max
(
0,𝑢𝑆 −𝐾
)
,𝐶
=max
(
0,𝑑𝑆 − 𝐾
)
(15)
𝑃𝑎𝑦𝑜𝑓𝑓=𝐻𝑒𝑑𝑔𝑒 𝑅𝑎𝑡𝑖𝑜 ∗ 𝑢𝑆− 𝐶
=𝐻𝑒𝑑𝑔𝑒 𝑅𝑎𝑡𝑖𝑜∗𝑑𝑆
− 𝐶
(16)
𝐶=𝐻𝑒𝑑𝑔𝑒 𝑅𝑎𝑡𝑖𝑜∗𝑆−𝑃𝑎𝑦𝑜𝑓𝑓
∗ 𝑒
(17)
Then Loss/profit with hedging can be calculated
every day from June 23rd, 2022, to July 7th, 2022,
using the following formula.
𝐿𝑜𝑠𝑠 𝑤𝑖𝑡ℎ 𝐻𝑒𝑑𝑔𝑖𝑛𝑔
=𝑆
(
𝑡
)
−𝐾
−[𝐻𝑒𝑑𝑔𝑒 𝑅𝑎𝑡𝑖𝑜
∗(𝑆
(
𝑡
)
−𝑆
(
0
)
)
+𝐶]
(18)
𝐿𝑜𝑠𝑠 𝑤𝑖𝑡ℎ𝑜𝑢𝑡 𝐻𝑒𝑑𝑔𝑖𝑛𝑔
=𝑆
(
𝑡
)
−𝐾−𝐶
(19)
Thus, starting at different date, the gain/loss with
or without hedging can be composed every day from
June 23rd, 2022, to July 7th, 2022.
As the profit or loss of the portfolio with or
without hedging using two models and three
volatilities is calculated, the performance of the
hedging strategy can be compared among them.
3 RESULT
From the process of the calibration, one historical
volatility and two implied volatilities using Black-
Scholes model and Binomial model are shown in the
table below followed by their SSE.
Table 3. The calibrated volatilities
Method Calibrated
volatilit
y
SSE
Historical
volatilit
y
0.696
IV from BSM 0.652 31.903
IV from
Binomial model
0.549 61.713
Furthermore, to test the influence of number of
historical stock prices to the calibrated historical
volatility, the trends of historical volatility as the
amount of historical stock prices used increases are
shown in the figure below.
Figure 2: The historical volatility trend.
As shown in the figure, when the used historical
data reaches a certain amount, around 28 in this study,
the change of historical volatility becomes smaller,
and the values of historical volatility fluctuate within
a relative narrow range. But eventually, the chosen
historical volatility is obtained from around 64
historical prices, which is close to the number of
calculated terms in calibrating implied volatility to
make the results comparable.
As shown in the Table 3 above, historical volatility
is largest, followed by the implied volatility calibrated
from Black-Scholes model. They are similar, while
implied volatility using binomial model is relatively
small with much larger SSE, compared with the one
in Black-Scholes model.
In terms of hedging, the profits or losses of the
portfolio with and without hedging for the chosen
period from June 23rd, 2022, to July 7th, 2022, using
the historical volatility and the two implied volatility
are compared and shown in the following graphs and
0,6
0,7
0,8
0,9
1
1,1
1,2
1 6 111621 26 31364146 51 5661667176
amount of histrical stock prices used
Historical volatility
Historical volatility
ICEMME 2022 - The International Conference on Economic Management and Model Engineering
404
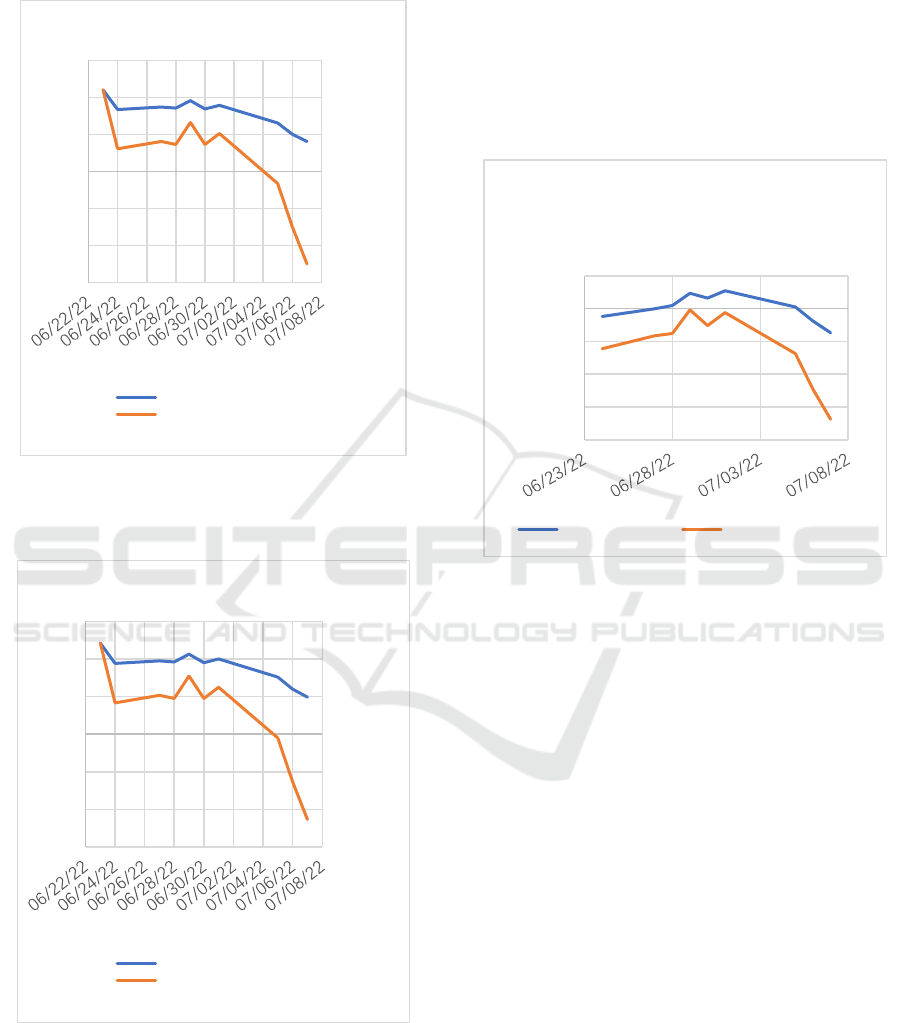
table. It’s clear that the Delta hedging strategy on
Moderna Inc. has performed better than merely
holding the call option without hedging.
Figure 3: The Comparison of the Profit/Loss holding one
unit of option on Moderna Inc. with/without hedging using
Implied Volatility in BSM.
Figure 4: The Comparison of the Profit/Loss holding one
unit of option on Moderna Inc. with/without hedging using
Historical Volatility in BSM.
As shown in the two figures above, the hedging
strategy works very well on the option on Moderna
Inc. using both historical and implied volatility in
Black-Scholes model. Besides it shows that the two
figures follow the similar trends no matter with or
without hedging. Overall, the profit with hedging for
each trading day is comparatively stable, while
without hedging, it remains profitable during the early
days in the period, but the loss appears at the end of
the period. Besides, two methods indicates that the
difference between profit/loss with and without
hedging becomes larger gradually.
Figure 5: The Comparison of the Profit/Loss holding one
unit of option on Moderna Inc. with/without hedging using
Implied Volatility in Binomial Model.
As shown in the figure, the line corresponding to
the strategy with hedging is always above the other
line which displays the gain/loss without hedging,
which is same as the previous results. Besides, the
same conclusion can be presented that the profit/loss
with hedging is relatively more resisting than the loss
by only holding the option. However, the overall
profit or loss is less than the profit/loss using Black-
Scholes model. During the period, the hedging strange
only guarantee that the profit or loss is around 0.
4 CONCLUSION
This paper studies the difference between two kinds
of models: Black-Scholes model and Binomial model,
as well as the disparities between historical and
implied volatilities. In this study, first, the one
historical volatility and two implied volatilities in the
two model are calibrated by utilizing the data on past
stock prices and ten options respectively. Then, a delta
hedging strategy is constructed, including one unit of
-15,00
-10,00
-5,00
0,00
5,00
10,00
15,00
With Hedging
Without Hedging
-15,00
-10,00
-5,00
0,00
5,00
10,00
15,00
Historical volatility BSM
Hedging
With Hedging
Without Hedging
-20
-15
-10
-5
0
5
profit(loss) $
Implied volatility Binomial
model Hedging
With Hedging Without Hedging
Option Pricing and Delta Hedging for Moderna Inc. on Different Models
405

the new selected option and delta shares of the stock
to make delta neutral. Finally, the hedging
performances for three different volatilities in two
models are compared. The hedging strategy on all the
three situations performs well, while the results show
the different amount of profit or loss, especially the
two in BSM with the one in Binomial model.
Nevertheless, there is a limit in the paper, for
example the simple one-step binomial model is
considered merely, but not a higher steps model. The
one-step model makes the calculation much easier
when dealing with long-time period in a replicated
process, while the more steps may make the results
more accurate. Besides, since the interest rate used in
this study is fixed, the transaction costs are ignored
and the options chosen are assumed to be European,
these deficiencies need to be researched
comprehensively in the future.
REFERENCES
A. D. Amir, N. Anuradha. Comparison: Binomial model
and Black Scholes model. Quantitative Finance and
Economics, 2018, 2(1): 230-245.
A. Doffou. Testing derivatives pricing models under
higher-order moment swaps. Studies in Economics and
Finance, 2019, 36(2):154-167.
B. Bollin, R. Lepaczuk. Variance Gamma Model in
Hedging Vanilla and Exotic Options. Working Papers,
2020.
D.A. Rata, L. O. Cinade. HEDGING: AN IMPORTANT
TOOL IN AGRICULTURE RISK MANAGEMENT.
lucrări ştiinţifice management agricol, 2009.
Gueant, Olivier, J. Pu. OPTION PRICING AND
HEDGING WITH EXECUTION COSTS AND
MARKET IMPACT. Mathematical finance, 2017,
27(3):803-831.
J. Hull, A. White. Optimal Delta Hedging for Options.
Social Science Electronic Publishing. 2017, 82: 180-
190.
M. V. G. P. Davis, T. Zariphopoulou. European Option
Pricing with Transaction Costs. IEEE Conference on
Decision & Control IEEE, 1993.
M. Ye, et al. Crop price insurance in China: pricing and
hedging using futures market. China Agricultural
Economic Review, 2017
N. Lassance, V. Frédéric. A comparison of pricing and
hedging performances of equity derivatives
models. Applied Economics, 2017, 50: 1122 - 1137.
Y.S. Kim, et al. Enhancing Binomial and Trinomial Equity
Option Pricing Models." Finance Research Letters,
2017:185-190.
ICEMME 2022 - The International Conference on Economic Management and Model Engineering
406
