
Research on Logistics Warehouse Planning
Based on K-Means Algorithm Clustering Analysis
Hongwei Li
1,*
, Linbo Su
1
, Faming Da
2
and Lei Qin
1
1
College of Information and Communication National University of Defense Technology, Wuhan, China
2
Unit 96716, Ganzhou, China
15897248201@163.com, qinleinust@126.com
Keywords: K-Means Algorithm, Cluster Analysis, Logistics Warehouse Planning, The Center of Gravity Method.
Abstract: With the development of logistics industry, warehouse location planning has become a key link in logistics
network layout, and its rationality has an important impact on logistics cost and service level. K-means
algorithm is efficient and fast for analyzing and processing large sample data, but the randomness of K value
will lead to the reduction of clustering effect. In this paper, the optimal K value is selected by clustering
evaluation index CH, so as to improve the K-means algorithm. Through simulation, the optimal distribution
area is obtained, and then the center of gravity method is used for site selection. Finally, the actual location
of the warehouse is determined by combining the natural environment and infrastructure factors. The results
show that the improved K-Means clustering algorithm has practical significance for the planning of logistics
warehouse.
1 INTRODUCTION
In recent years, with the rapid development of the e-
commerce industry, the number of offline stores
keeps increasing, which means the quantity of
warehouse distribution and distribution routes keep
increasing, and the competition between enterprises
has shifted from the competition of business model to
the competition of logistics services. Therefore, how
to solve the logistics technology lag in reality, so as
to accelerate the logistics distribution speed and
shorten the distribution time, which has become the
source of competitive advantage of enterprises.
Warehouse or logistics center location is a very
important part of logistics network layout planning, it
can carry out strategic storage and allocation of
commodities, can bring objective economic benefits
for enterprises. Whether the location of the
warehouse is reasonable or not has an important
impact on the logistics cost and service level, which
is related to the long-term development of the
enterprise.
2 DEVELOPMENT STATUS AT
HOME AND ABROAD
Domestic and foreign scholars have made many
achievements in the study of logistics center location.
Taniguchi et al. mainly explored the scale and
selection of public logistics nodes by building a
bilevel programming model, and solved the model
with queuing theory and nonlinear programming
(Taniguchi, 1999). Yan Wentao and Qin Yanhong
studied the location of underground logistics nodes by
establishing a two-level programming model, and the
simulation results of real cases verified the feasibility
and rationality of this model (Yan, 2016).
Vlachopoulou et al. applied Geographic
Information System (GIS) to the location problem of
logistics nodes. Based on a variety of qualitative and
quantitative evaluation criteria, he ranked the
advantages and disadvantages of the existing
alternatives of distribution centers, so as to obtain the
optimal location scheme (Vlachopoulou, 2001). Shi
Hongwei and Wang Fanian constructed an
optimization model of logistics node layout after
analyzing the basic characteristics of each logistics
node, such as radiation range, spatial characteristics
and construction cost, and designed a suitable ant
Li, H., Su, L., Da, F. and Qin, L.
Research on Logistics Warehouse Planning Based on K-Means Algorithm Clustering Analysis.
DOI: 10.5220/0012034400003620
In Proceedings of the 4th International Conference on Economic Management and Model Engineering (ICEMME 2022), pages 445-450
ISBN: 978-989-758-636-1
Copyright
c
2023 by SCITEPRESS – Science and Technology Publications, Lda. Under CC license (CC BY-NC-ND 4.0)
445

colony algorithm to solve the problem for research
(Shi, 2010). Zhao Hairu, Chen Ling In order to reduce
logistics costs and improve distribution efficiency, a
multi-objective logistics node location model was
built with the minimum logistics system operating
cost and maximum customer time satisfaction as the
objective function (Zhao, 2016).
Wang Jiaju systematically expounded the
advantages and disadvantages of the center of gravity
method in the location of logistics centers and its
applicable scope, providing a theoretical basis for the
study of the location of logistics centers (Wang,
2008). Wang Feifei and Lin Wen improved the
limitations of the center of gravity method in the
location of logistics center, established a model and
obtained the best location, and finally verified the
correctness of the model through an example (Wang,
2014).
3 K-MEANS ALGORITHM
CLUSTERING ANALYSIS
Clustering is a process of classifying data members
based on similarity characteristics. K-Means
algorithm clustering analysis, also known as K-center
clustering, is a statistical analysis method that sums
the homogeneous continuous variables together
through an iterative process.
Distance is usually taken as the index of
similarity, and the data set
{, 1,2, }
i
Uui n==
is
divided into K classes
{, 1,2, }
j
Ccj K==
, and
each class
j
c
has a clustering center
j
m
. Calculate
the sum of squares of distances from each data point
to the clustering center in all clusters:
2
1
()
ij
K
ij
juc
Dc u m
=∈
=−
(1)
The clustering result is obtained by making
()Dc
minimum through iterative operation.
Because it has the advantages of fast convergence
speed and small computation, it is suitable for
analyzing and processing large sample data, which
can effectively reduce the computation time and
improve the operation efficiency.
For warehousing and logistics, the logistics
network is usually divided into different distribution
areas with each warehouse as the center and the
distribution distance as the radius. K-means
clustering algorithm divides regions according to
distance, and this method can be well applied to the
regional division of warehousing logistics. K in k-
means algorithm is the number of warehousing
logistics distribution regions.
In the k-means algorithm, the number K of
clusters is randomly selected (Xu, 2019). Although
such clustering algorithm is fast and simple, the
randomly selected value of K will affect the
clustering effect, thus leading to the decline of
clustering quality. A good clustering method can
generate clusters with good clustering, the samples
within clusters are very close and the clusters between
clusters are very large. The clustering evaluation
index CH (Calinski, 1974) mainly considers the
similarity degree of samples in the cluster and the
distancing degree of clusters. Between 2 and the
number of samples, the clustering evaluation index
CH is used to evaluate the clustering effect of each K
value, and the optimal cluster number K value is
calculated and evaluated, so as to determine the
number of warehouses.
4 K-MEANS ALGORITHM
CLUSTERING ANALYSIS
WITH DETERMINE K VALUE
Too large or too small cluster number K value will
affect the clustering effect of k-means algorithm, and
the determination of K value becomes the most
important problem to be solved by K-means
clustering algorithm.
4.1 Algorithm Steps
This paper mainly optimizes the first step of K-means
algorithm, and improves this shortcoming by
evaluating the best K value with clustering evaluation
index, so as to achieve a better clustering. The steps
are as follows:
1. Determine K value by clustering evaluation
index;
2. Calculate the distance between each data point
and each cluster center, and determine which cluster
center it belongs to if the distance between each data
point and a cluster center is small;
3. Recalculate the centers of K clusters, and the
arithmetic mean value of the points contained in the
cluster is the cluster center;
4. If the cluster center does not change, go to Step
5; Otherwise, go to Step 2.
5. Output the classification result of the dataset.
ICEMME 2022 - The International Conference on Economic Management and Model Engineering
446
4.2 Implementation Process
The implementation flow of this K-means clustering
algorithm with a determined K value is as follows:
1. Select a search range for the number of clusters
(K
min
, K
max
).
Assuming that there are n data samples, then the
maximum number of clustering clusters is
theoretically n, that is, the number of clustering
clusters when each point is infinitely far away is
K
max
=n; On the contrary, if n points are infinitely
close to each other, they are grouped into a cluster. In
general practical applications, the number of data
samples is between Kmin and Kmax, so the search
range for the number of clusters is determine as (K
min
,
K
max
).
2. In the range of (K
min
, K
max
), the optimal
clustering index value of clustering evaluation index
CH under different cluster number is obtained.
3. Analyze the application effect of clustering
evaluation index, and the clustering evaluation of data
samples is carried out combined with the actual
situation, so as to obtain the best clustering number.
4. According to the best clustering number
obtained, the K-means algorithm is used to cluster the
number of data samples.
5 SIMULATION RESULTS AND
ANALYSIS
Through the investigation and analysis of 59 cities in
East China, the coordinates of prefecture-level cities
in the following table are obtained. Where, the
horizontal coordinate X and vertical coordinate Y are
the distances converted according to the latitude and
longitude of each city respectively, and the task
quantity is determined according to the service area
of each city and the logistics demand of surrounding
users.
Table 1: Geographical coordinates of 59 cities.
City name
X-
coordinate
Y-
coordinate
Task
quantity
Zhangzhou 11764 2451 40
Xiamen 11807 2446 80
Quanzhou 11857 2493 50
Putian 11900 2547 40
Fuzhou, Fujian 11928 2609 70
Ningde 11951 2668 90
Sanming 11763 2627 70
Longyan 11700 2508 60
Nanping 11817 2665 40
Ganzhou 11491 2585 30
Ji’an 11498 2712 50
Wuhu 11842 3136 80
Maanshan 11849 3168 40
Nanjing 11878 3206 100
Shanghai 12146 3125 90
Nantong 12088 3199 80
Changzhou 11997 3182 70
Wuxi 12029 3150 90
Suzhou 12057 3130 50
Zhenjiang 11944 3221 40
Yichun 11440 2782 50
Xinyu 11491 2783 50
Nanchang 11585 2869 40
Fuzhou,
Jiangxi
11635 2797 40
Yingtan 11705 2827 60
Jingdezhen 11717 2928 50
Shangrao 11793 2847 60
Quzhou 11887 2895 70
Chuzhou 11831 3231 70
Hefei 11722 3183 60
Jiujiang 11599 2972 70
Huangshan 11832 2972 80
Jinhua 11964 2909 50
Huaibei 11694 3365 60
Xuzhou 11727 3421 70
Suqian 11826 3397 80
Huaian 11900 3362 70
Chizhou 11749 3067 60
Yancheng 12015 3335 50
Bengbu 11738 3292 60
Fuyang,
Anhui
11580 3290 80
Taizhou,
Jiangsu
11990 3246 70
Lishui 11992 2848 80
Wenzhou 12069 2801 80
Taizhou,
Zhejiang
12140 2867 60
Ningbo 12154 2988 60
Zhoushan 12218 3000 60
Shaoxing 12057 3004 70
Hangzhou 12021 3025 50
Jiaxing 12074 3076 60
Huzhou 12008 3090 70
Xuancheng 11875 3095 50
Tongling 11780 3097 70
Lianyungang 11921 3460 30
Pingxiang 11386 2763 40
Bozhou 11577 3386 60
Research on Logistics Warehouse Planning Based on K-Means Algorithm Clustering Analysis
447
Anqing 11705 3054 50
Huainan 11698 3264 50
Liuan 11650 3174 80
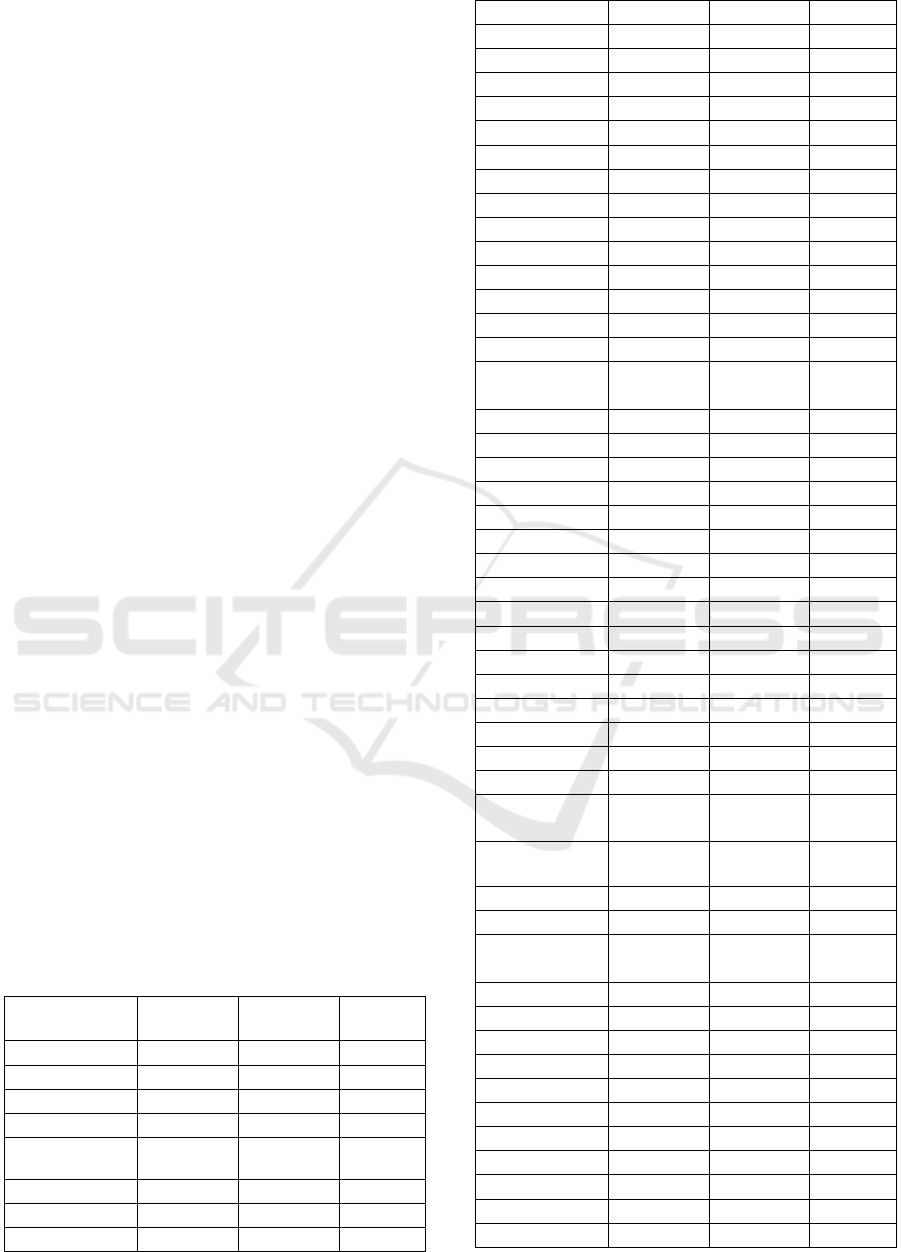
Figure 1: Data tracing points of the above 59 cities.
The coordinates of 59 cities in Table 1 were traced
to get Figure 1, from which the distribution of each
data point can be intuitively seen.
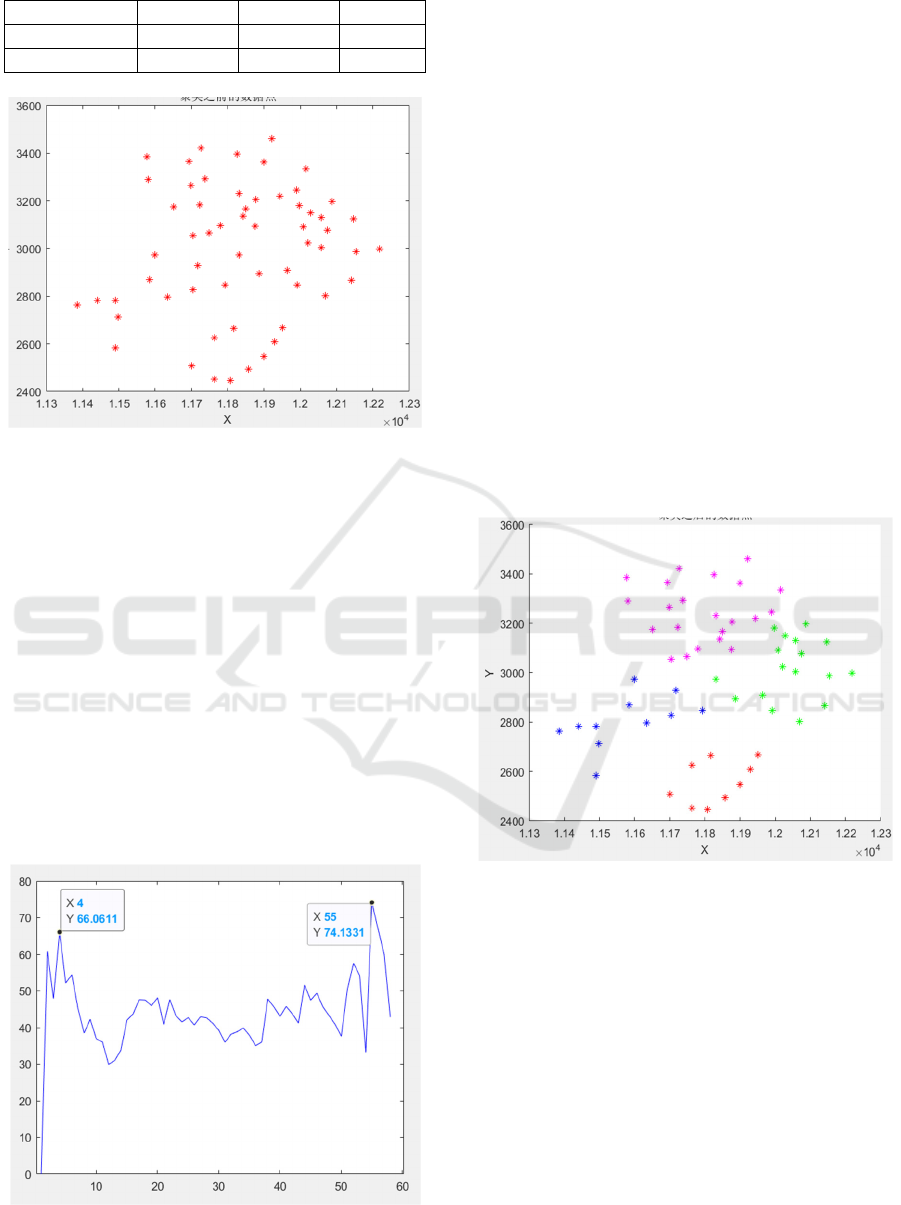
5.1 K-Means Clustering Algorithm
Figure 2 can be obtained by using K-Means clustering
evaluation scheme to simulate data samples. It can be
seen from Figure 2 that the clustering evaluation
index CH changes to a certain extent with the increase
of the cluster number, and there are two peaks, which
are the corresponding values when the cluster number
K=4 and K=55. However, the scheme with relatively
small k value is relatively economical in practice.
Therefore, K=4 is selected as the optimal clustering
number.
Figure 2: Cluster evaluation indicators.
According to the measurement, the area of 59
cities is about 480,000 square kilometers. According
to the optimal clustering number K=4, the area of a
single distribution area is about 120,000 square
kilometers.
On this basis, we assume the following
conditions:
1. The delivery time of transport vehicles is the
working time of logistics industry: 8:00-12:00,2:00-
6:00.
2. In order to ensure the efficiency of warehouse
operation, the transport vehicles must be completed
within one day and returned to prepare for the next
shipment. Therefore, considering the round-trip time,
the single trip time is calculated as 4 hours.
3. The average speed of transport vehicles is
generally 40-60km/h. Considering the problems such
as traffic jams and bad road conditions, the average
speed of vehicles is considered to be 50km/h.
When clustering cluster K=4, the 59 cities in
Table 1 are clustered and the following results are
obtained, as shown in Figure 3:
Figure 3: K-Means clustering.
According to the measurement, the distribution
area of each warehouse center is about 120,000
square kilometers, which is in line with the
distribution range of the warehouse. Therefore, the
selection of cluster number K=4 meets the
requirements of the actual warehouse establishment.
5.2 Center of Gravity Method for Site
Selection
The center of gravity method mainly considers the
transportation rate, transportation distance,
transportation volume and other parameters for site
selection. By calculating the transportation cost
ICEMME 2022 - The International Conference on Economic Management and Model Engineering
448
between each distribution point and the logistics
center, the weighted value is minimized to obtain the
center of gravity of the distribution area, that is, the
theoretical location of the logistics center within the
distribution area. Assuming that the transportation
rate per unit distance is
i
h
, the straight-line distance
from the warehouse to the distribution point is
i
d
,
and the freight volume is
i
w
, then the transportation
cost of goods from the logistics center to the
distribution point is:
iiii
Hhdw=∗∗
(2)
Where,
()()
22
00iii
dxxyy=−+−
(3)
the coordinate of the logistics center is
()
00
,xy
and the coordinate of the distribution point is
()
,
ii
xy
. The total transportation cost of the logistics
center in the distribution area is:
() ( )( )
22
00 0 0
1
,
n
ii i i
i
Hxy h w x x y y
=
=××−+−
(4)
Where,
n
is the number of distribution points in
the distribution area. The value of function
()
00
,Hxy
is minimized by iterative operation, and
the obtained coordinate is the theoretical position of
the warehouse in the distribution area. Through
simulation, the following results are obtained, as
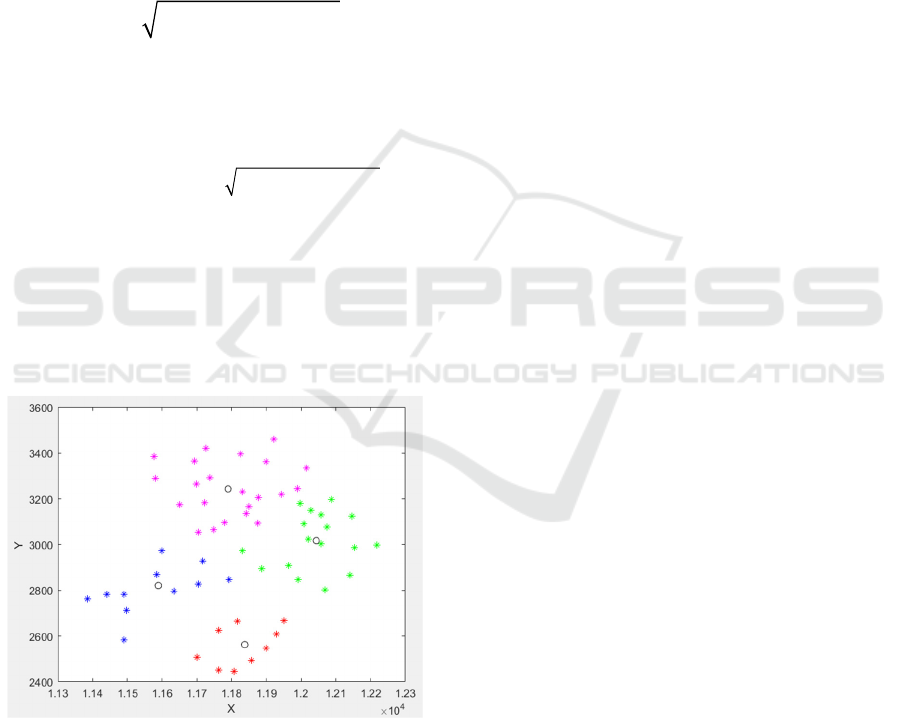
shown in Figure 4:
Figure 4: Theoretical locations of warehouses in each
distribution area.
In the figure, the theoretical coordinates of the
warehouse in the blue clustering area is:
(11597.95,2831.69), the theoretical coordinates of the
warehouse in the red clustering area is
(11845.11,2558.42), the theoretical coordinates of the
warehouse in the green clustering area is
(12049.63,3034.78), the theoretical coordinates of the
warehouse in the purple clustering area is
(11805.42,3228.25).
In addition to transportation costs, the location of
logistics centers also needs to consider factors such as
natural environment and infrastructure conditions.
1. Natural environmental factors
(1) Geological conditions. The warehouse should
be built in a place with high and relatively flat terrain
as far as possible. It should not be built in a place with
geological problems such as silt layer, quicksand
layer and loose soil layer. Otherwise, it may cause
serious consequences such as subsidence and
churning.
(2) Meteorological conditions. The main
meteorological conditions to consider when choosing
a warehouse location include temperature, humidity,
precipitation, frost and other indicators such as the
depth of the frozen soil.
(3) Hydrological conditions. When choosing a
warehouse location, avoid flood basins and
groundwater flooding areas.
2. Conditions of base facilities
(1) Traffic conditions. Logistics distribution
should have convenient transportation to meet the
needs of timely distribution and cost reduction, so the
location of the warehouse should be close to the main
traffic road or high-speed entrances and exits.
(2) Condition of public facilities. The location of
the warehouse needs good communication quality
and is not easy to be interfered with. The power
supply, water supply, heat supply and gas supply
capacity should be sufficient.
(3) Surrounding environment. The warehouse
should be securely spaced from other surrounding
buildings, and the site should be located in an open
area on the outskirts of the city, which may reduce the
occupation of the field.
Taking the above factors into consideration, the
actual location of the warehouse is selected near the
theoretical coordinate according to the actual
situation.
5.3 Result Analysis
It can be found that the experimental results are often
different from the actual results, mainly because:
1. The location of a logistics center needs to
consider many factors, such as the choice of
transportation mode, the guarantee range of the
warehouse, the local climate conditions, etc. In this
paper, when determining the number of cluster,
namely the number of warehouses, only the
Research on Logistics Warehouse Planning Based on K-Means Algorithm Clustering Analysis
449

automobile is considered as the means of
transportation, and the scope of warehouse guarantee
is given in an assumed way. The center of gravity
method adopted in this paper only considers the three
major factors of distance, transportation rate and
transportation volume, and is simply calculated by
mathematical method.
2. K-means clustering has certain limitations. It
has been mentioned in the paper that the k-means
clustering effect is greatly influenced by the initial
clustering number K value. In order to avoid this
influence, this paper uses CH clustering evaluation
index to evaluate a K value, although this method has
certain application value. However, any evaluation
system has its own disadvantages. The CH evaluation
system is obtained by comparing with the existing
more famous clustering indexes BWP and SIL. With
the continuous development of clustering research,
more complete clustering evaluation indexes will also
appear.
7 CONCLUSIONS
Based on K-Means clustering analysis, this paper
studies the planning of logistics warehouse. By
selecting the best value of the clustering evaluation
index CH as the best clustering number K, the k-
means algorithm is improved and the influence of the
randomness of K value on the clustering effect is
improved. After the clustering results are obtained
through the experimental simulation, the planned
quantity of the warehouse is determined by analyzing
the actual situation. Finally, the center of gravity
method is used for site selection, and the actual
location of the warehouse is determined by
combining the natural environment and
infrastructure. It can be seen from the result analysis
that this method has practical significance for the
planning of logistics warehouse.
ACKNOWLEDGEMENTS
This work was supported by National University of
Defense Technology under the Teaching and
Learning Funding Scheme.
REFERENCES
Calinski, T. & Harabasz, J. (1974). A Dendrite Method for
Cluster Analysis. J. Communications in Statistics. 1, 1-
27.
Shi, H. W. & Wang, F. N. (2010). A Clustering Model and
its Adaptive Ant Colony Algorithm in Logistics Service
Nodes layout Optimization. J. Industrial Engineering
and Management. 4, 10-14.
Taniguchi, E., Noritake, M., Yamada, T., Izumitani, T.
(1999). Optimal size and location planning of public
logistics erminals. J. Transportation Research.
35(PartE), 207-222.
Vlachopoulou, M., Silleos, G., Manthou, V. (2001).
Geographic Information Systems in Warehouse Site
Selection Decitions. J. Production Economics. 71, 205-
212.
Wang, J. J. (2008). Selecting the Site of Distribution Center
Based on Centroid Method. J. Journal of Yangtze
University. 4, 64-66.
Wang, F. F. & Lin, W. (2014). Study on Location Problem
of 3PL Distribution Centers Based on Improved
Gravity-Actor Analysis. J. Logistics Technology. 3,
185-187.
Xu, Y. C. & Dai, T. (2019). Solving Multiple Distribution
Center Location Allocation Problem Using K-Means
Algorithm and Center of Gravity Method. J. Logistics
Technology. 6, 69-73.
Yan, W. T. & Qin, Y. H. (2016). Research on Bi-level
Programming Model and Algorithm of Underground
Logistics Node Location. J. Chinese Journal of
Underground Space and Engineering. 4, 870-874.
Zhao, H. R. & Chen, L. (2016). Application of improved
MOPSO in logistics node location model. J. Computer
Engineering and Applications. 12, 239-245.
ICEMME 2022 - The International Conference on Economic Management and Model Engineering
450
